
- USD/INR falls due to robust FCNR-B inflows, bank fixing-related selling, and aggressive dollar liquidation by exporters.
- The Indian Rupee strengthened as crude oil prices plunged following a major diplomatic breakthrough between the United States and Iran.
- The US Dollar may further strengthen as traders price in hawkish sentiment surrounding the Fed’s policy outlook.
The Indian Rupee (INR) extends its gains for the second consecutive day against the US Dollar (USD) on Friday. The USD/INR pair maintained a downward bias as a shift in daily foreign flows offered fresh support to the Indian Rupee.
Solid FCNR-B flows and dollar selling by exporters
Market analysts attribute the USD/INR’s downside largely to fixing-related dollar selling across private and foreign banks, along with the robust Foreign Currency Non-Resident Bank (FCNR-B) inflows.
Additionally, aggressive dollar liquidation by exporters further weighed on the pair, offsetting a stronger US Dollar (USD) and prompting the Reserve Bank of India (RBI) to step in intermittently to absorb excess liquidity.
Oil prices ease due to US-Iran initial agreement
The Indian Rupee gains amid a sharp decline in crude oil prices following a diplomatic breakthrough between the US and Iran. According to media reports, the two nations have signed an initial agreement, initiating a 60-day negotiation window for a permanent peace deal. Additionally, the US military confirmed it has lifted its blockade on Iranian ports near the Strait of Hormuz, restoring vital energy shipping routes. While these developments are expected to lift risk sentiment and support emerging market currencies in the near term, traders remain cautious, noting that a full recovery in global shipping and energy volumes will likely take months.
Fed rate hike odds lift US Dollar
However, the USD/INR pair may regain its ground as the US Dollar gains ground as the traders price in the hawkish sentiment surrounding the Federal Reserve (Fed) policy outlook. In his debut press conference, newly appointed Federal Reserve (Fed) Chairman Kevin Warsh emphasized that “price stability” remains the Fed’s ultimate guiding principle.
The Federal Open Market Committee (FOMC) voted unanimously on Wednesday to hold its benchmark overnight borrowing rate steady at a range of 3.5%–3.75%. However, the decision carried a hawkish tone, with nearly half of the officials signaling that at least one rate hike could be required later this year.
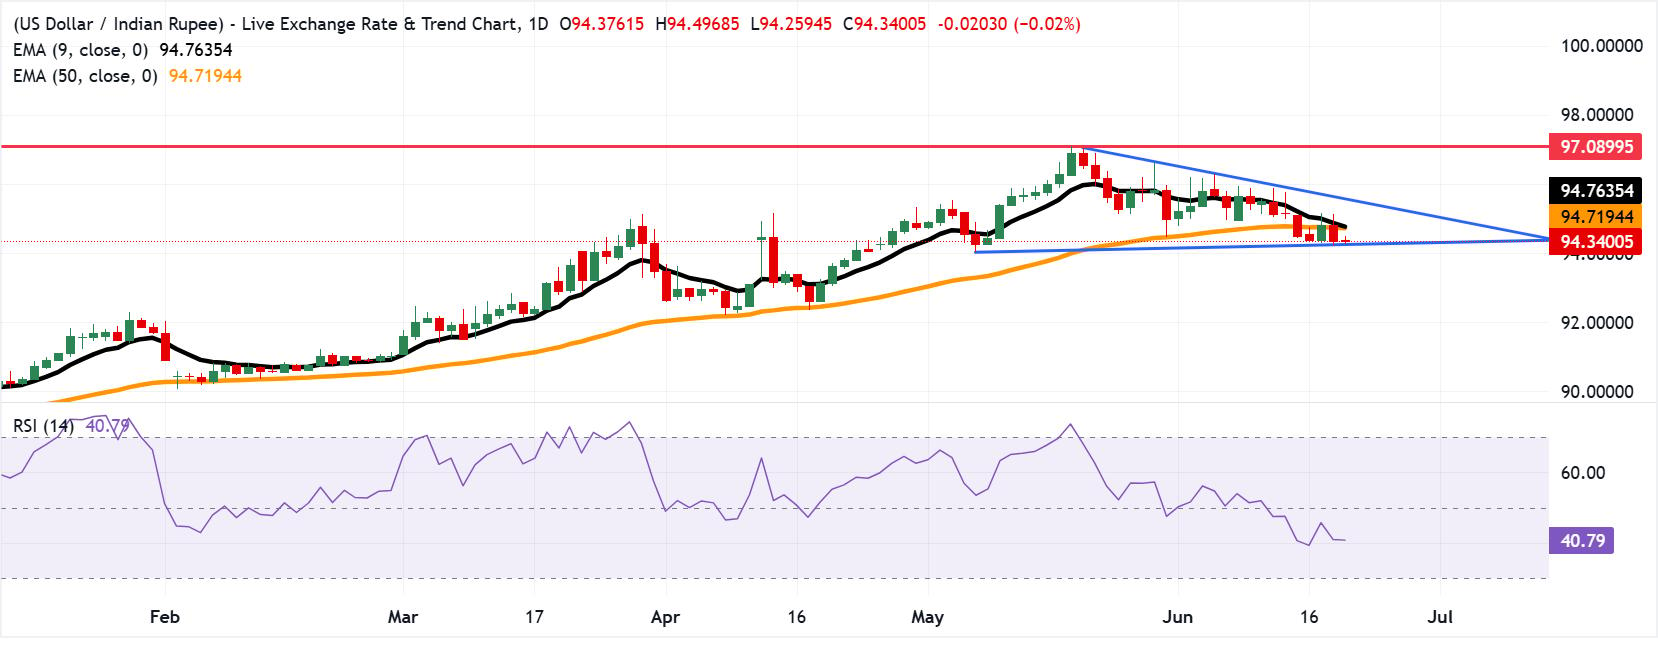
Technical Analysis: USD/INR holds losses below 94.50, moving averages
USD/INR continues to depreciate for the second successive day, trading around 94.30 at the time of writing. The technical analysis of the daily chart suggests that the spot price is remaining close to the descending triangle bottom, indicating that the market is testing whether buyers still have the cash and the will to defend the current levels.
The USD/INR pair holds a bearish near-term bias as spot remains below both the nine-period and 50-period Exponential Moving Averages (EMAs). The 14-day Relative Strength Index (RSI) hovers just above 40, suggesting subdued downside momentum but not yet signaling oversold conditions, leaving the pair vulnerable while it trades under this near-term moving-average barrier.
The initial resistance is aligned with the 50-period EMA at 94.72, followed closely by the nine-period EMA at 94.76, forming a tight cap that would need to be reclaimed to ease immediate selling pressure. On the downside, the immediate support lies at the descending triangle bottom around 94.30.
(The technical analysis of this story was written with the help of an AI tool.)
US Dollar Price Today
The table below shows the percentage change of US Dollar (USD) against listed major currencies today. US Dollar was the strongest against the New Zealand Dollar.
| USD | EUR | GBP | JPY | CAD | AUD | NZD | INR | |
|---|---|---|---|---|---|---|---|---|
| USD | 0.16% | 0.16% | -0.02% | 0.11% | 0.25% | 0.36% | -0.08% | |
| EUR | -0.16% | -0.00% | -0.15% | -0.05% | 0.10% | 0.19% | -0.16% | |
| GBP | -0.16% | 0.00% | -0.17% | -0.05% | 0.12% | 0.22% | -0.21% | |
| JPY | 0.02% | 0.15% | 0.17% | 0.10% | 0.28% | 0.36% | -0.01% | |
| CAD | -0.11% | 0.05% | 0.05% | -0.10% | 0.19% | 0.25% | -0.13% | |
| AUD | -0.25% | -0.10% | -0.12% | -0.28% | -0.19% | 0.08% | -0.30% | |
| NZD | -0.36% | -0.19% | -0.22% | -0.36% | -0.25% | -0.08% | -0.39% | |
| INR | 0.08% | 0.16% | 0.21% | 0.00% | 0.13% | 0.30% | 0.39% |
The heat map shows percentage changes of major currencies against each other. The base currency is picked from the left column, while the quote currency is picked from the top row. For example, if you pick the US Dollar from the left column and move along the horizontal line to the Japanese Yen, the percentage change displayed in the box will represent USD (base)/JPY (quote).