S&P 500 — US Large Cap Index
 FTSE 100 — UK Blue Chips
 Euro Stoxx 50 — Eurozone Leaders
 DAX 40 — German Equities
 CAC 40 — French Market Index
 Nikkei 225 — Japan Benchmark
 Hang Seng — Hong Kong Index
 Shanghai Composite — China Mainland
 ASX 200 — Australian Market
 TSX Composite — Canada Index
 Nifty 50 — India Large Cap
 STI Index — Singapore Market
 KOSPI — South Korea Index
 Bovespa — Brazil Equities
 JSE Top 40 — South Africa Index
 IPC Index — Mexico Market
Solana Price Forecast: SOL rebounds amid steady ETF inflows, privacy-focused hackathon

- Solana is up nearly 2% on Monday, reversing from the 50-day EMA and approaching a key resistance level.
- US spot SOL ETFs flash renewed institutional interest, with total inflows of over $41 million last week.
- Solana enters the privacy space with a hackathon on Monday, offering $75,000 in rewards for private payments, launchpads, and open track.
Solana (SOL) edges higher by 2% at press time on Monday, adding to the nearly 3% rise from Sunday. A steady inflow into US spot SOL-focused Exchange Traded Funds (ETFs) reflects deeper institutional support for Solana. Additionally, Solana is exploring private transactions through a hackathon starting on Monday, which could strengthen demand from retail and smart money.
Technically, the outlook for Solana is turning bullish as it regains strength, and the Supertrend indicator is signaling a buy.
Solana explores privacy amid steady retail, ETF demand
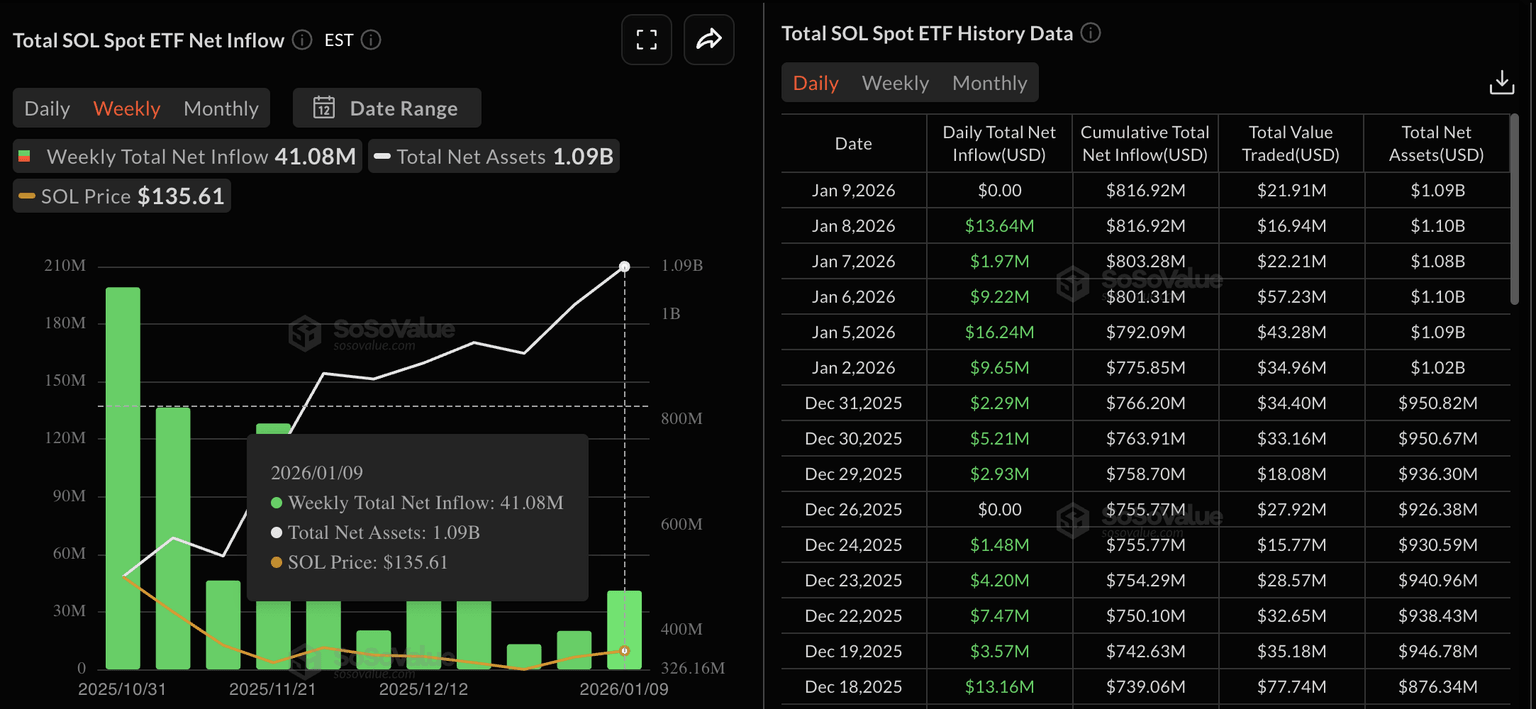
The SOL-focused ETFs recorded $41.08 million in inflows last week, marking their eighth consecutive week of inflows. This suggests that demand for Solana persists among institutional players, as the blockchain is now exploring privacy features similar to those of Zcash or Monero.
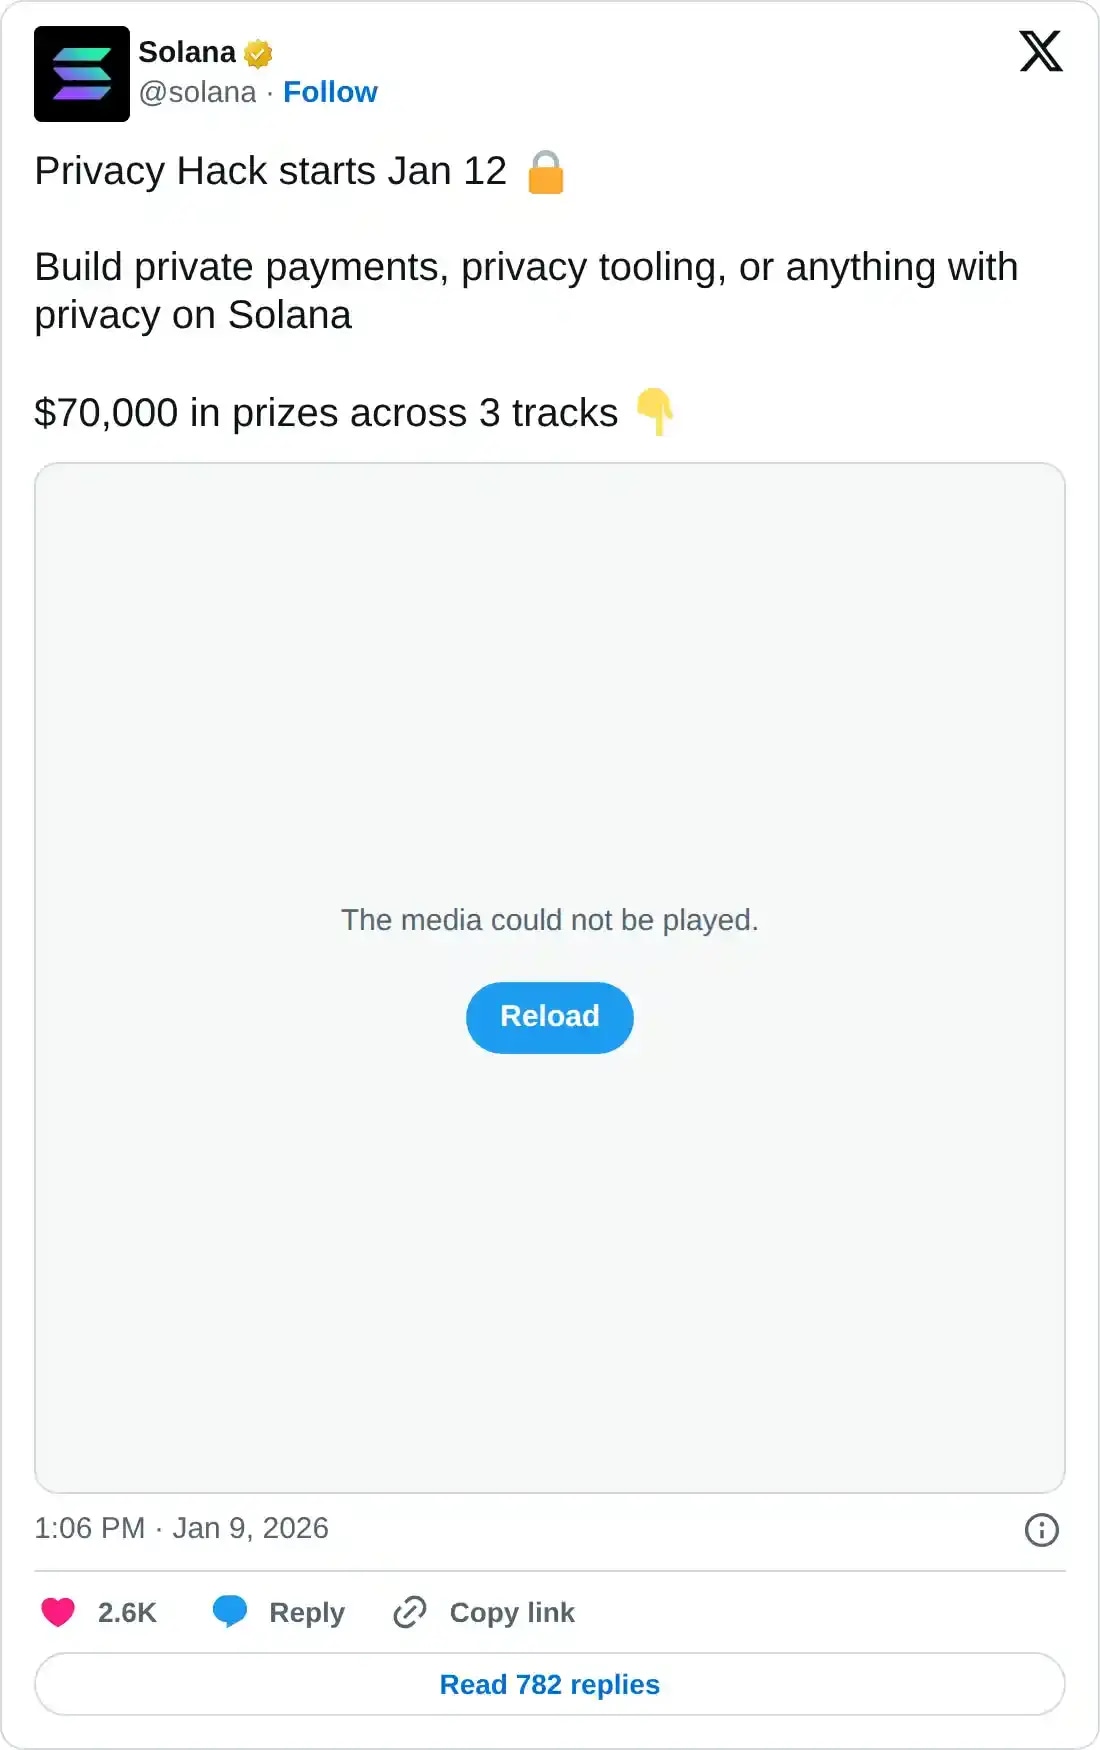
The Privacy Hack, starting on Monday, offers $75,000 in rewards for private payments, a launchpad, and an open track for other privacy-focused protocols. The submissions will end on February 1, and winners will be announced on February 10.
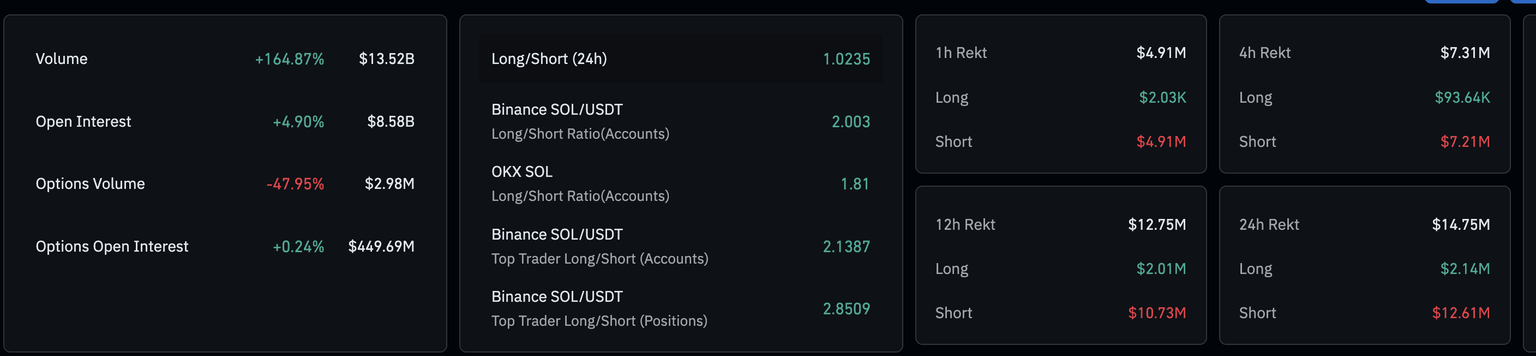
On the derivatives side, capital inflows into Solana futures suggest renewed demand from traders. CoinGlass data shows that the SOL futures Open Interest (OI) is up 4.90% in the last 24 hours, reaching $8.58 billion.
Additionally, the 24-hour long-to-short ratio of 1.0235 indicates a greater number of active long positions. In accordance with the long-to-short ratio, short liquidations of $12.61 million outpace long liquidations of $2.14 million, indicating a larger wipeout of bearish-aligned positions.
Technical outlook: Could Solana price exceed $150?
Solana extends gains above the 50-day EMA at $136, inching closer to the $150 mark. At the time of writing, SOL is up 2% on Monday, trading above the R1 Pivot Point at $142 on the daily chart.
Additionally, Solana crosses above the Supertrend indicator line, triggering a fresh uptrend and flashing a buy signal.
However, Solana should surpass the November 4 low at $145 to sustain a recovery, which has capped gains since mid-November. A potential close above this level could target the $150 mark, followed by the R2 Pivot Point at $159.
The technical indicators on the daily chart suggest a steady rise in bullish momentum. The Relative Strength Index (RSI) is at 63, reversing toward the overbought zone after a minor pullback last week, suggesting renewed buying pressure.
At the same time, the Moving Average Convergence Divergence (MACD) and the green histogram bars steadily rise above the zero line, indicating a boost in bullish momentum.
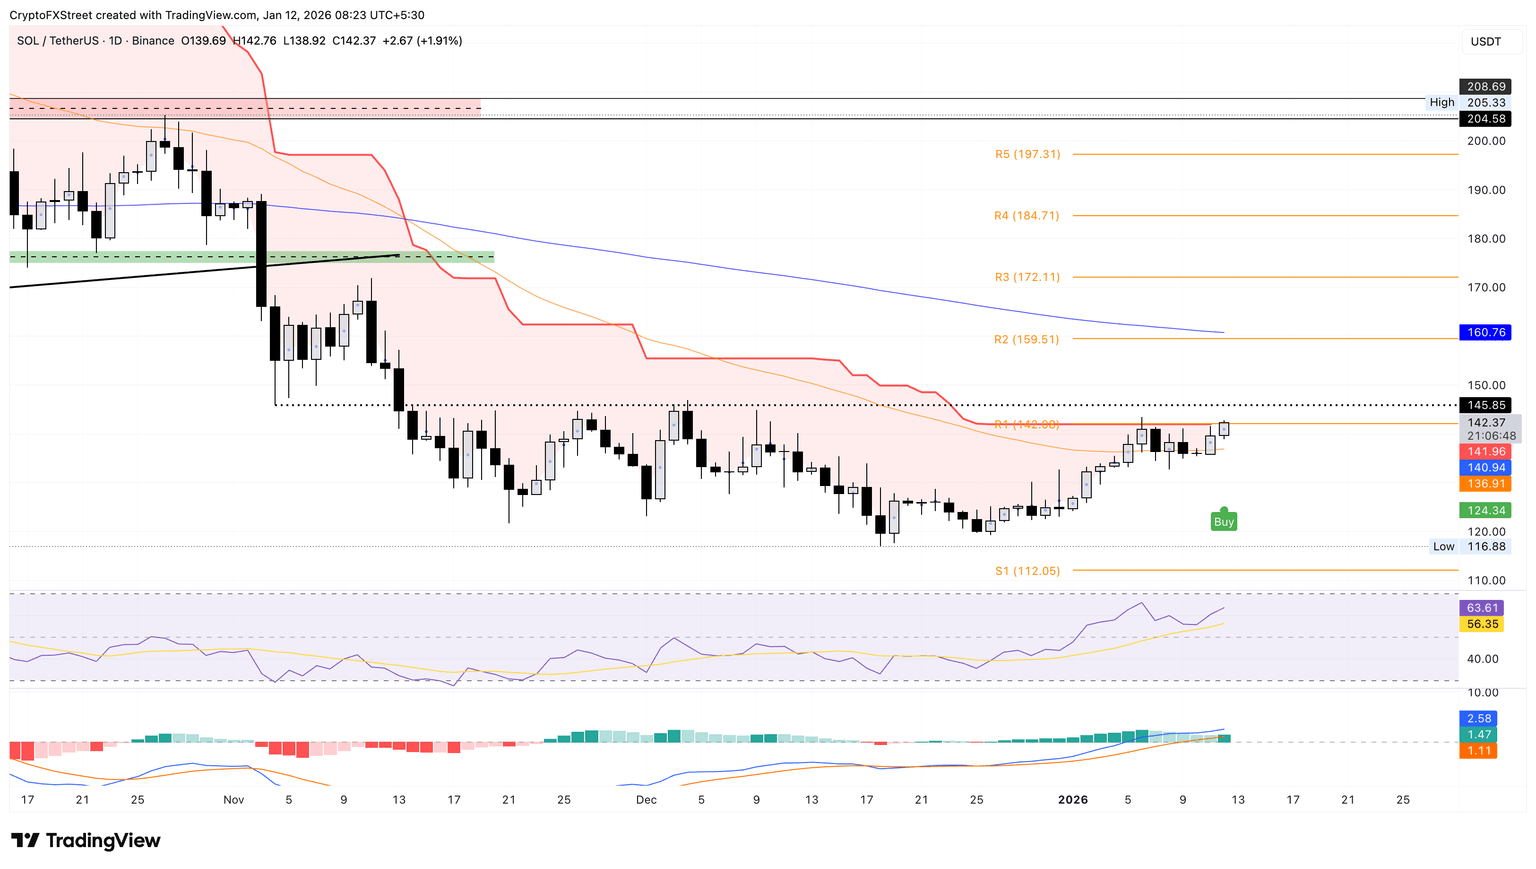
Looking down, if Solana reverses from the $146, it could break the 50-day EMA at $136, targeting the December 18 low at $116.