S&P 500 — US Large Cap Index
 FTSE 100 — UK Blue Chips
 Euro Stoxx 50 — Eurozone Leaders
 DAX 40 — German Equities
 CAC 40 — French Market Index
 Nikkei 225 — Japan Benchmark
 Hang Seng — Hong Kong Index
 Shanghai Composite — China Mainland
 ASX 200 — Australian Market
 TSX Composite — Canada Index
 Nifty 50 — India Large Cap
 STI Index — Singapore Market
 KOSPI — South Korea Index
 Bovespa — Brazil Equities
 JSE Top 40 — South Africa Index
 IPC Index — Mexico Market

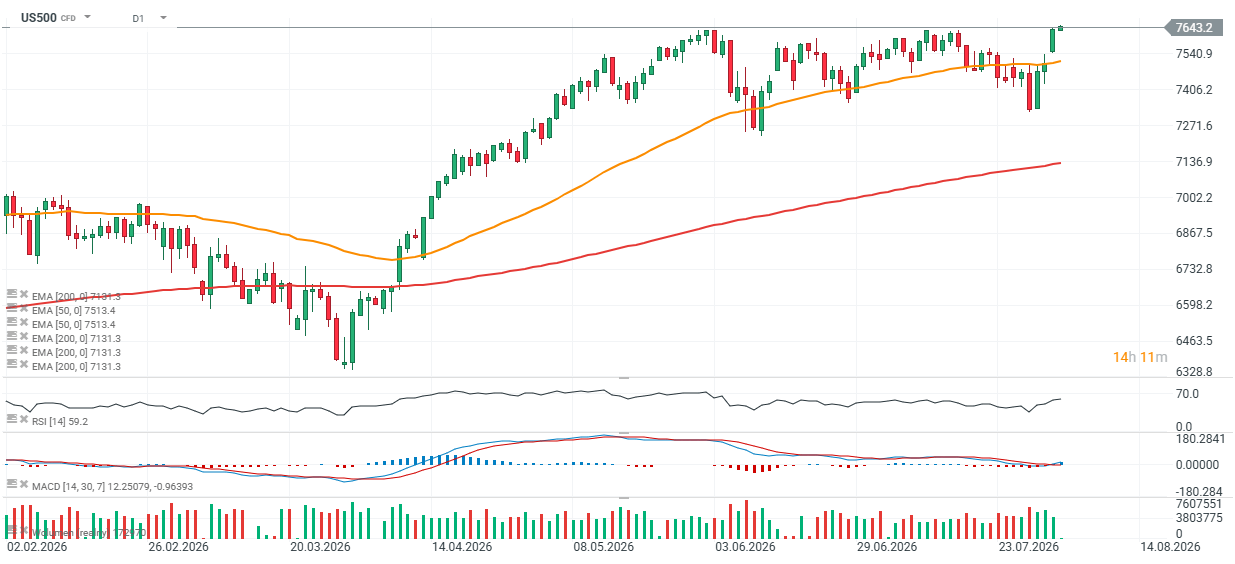
📈 Wall Street Rallies on a Strong Earnings Season and Hopes for De-escalation in the Middle EastUS equities are attracting fresh buying interest as investors focus on a record-breaking US earnings season after President Donald Trump said negotiations with Iran are ongoing. While Tehran has not officially indicated any willingness to abandon military options, investors appear increasingly accustomed to the new geopolitical reality in the Middle East. Trump’s comments were interpreted as a potential signal that both sides may gradually seek to de-escalate tensions ahead of the US midterm elections this autumn. As a result, lower oil prices and declining bond yields are providing additional support for equity indices. The current US earnings season continues to exceed even the most optimistic expectations. S&P 500 companies are now expected to deliver earnings growth of 47.4% year-over-year for the second quarter, up from roughly 23% expected at the end of June. If realized, this would mark the strongest quarterly earnings growth since Q4 2021, when profits surged by more than 91% year-over-year. Excluding Alphabet and Amazon, expected earnings growth for the S&P 500 would still stand at an impressive 28.8% year-over-year, the strongest reading in five years. Most companies are not only beating Wall Street estimates but are also prompting analysts to raise profit forecasts for the broader S&P 500. According to FactSet data as of July 31, 86% of S&P 500 companies have reported earnings per share above expectations, while 77% exceeded revenue forecasts. Nine of the eleven sectors have seen upward earnings revisions thanks to stronger-than-expected results and higher EPS estimates. Looking ahead to the third quarter, 34 companies have raised earnings guidance, while only 20 have issued negative outlooks. Meanwhile, the S&P 500 currently trades at a forward P/E ratio of 19.6, below its five-year average of 19.9 and only slightly above its 10-year average of 19.0. Considering improving corporate margins, the strong earnings backdrop, and the index trading at record highs, current valuations do not appear particularly stretched. US500 and OIL charts (D1) The US500 contract has recently rebounded twice after briefly falling below the 50-day EMA (orange line), highlighting the importance of the 7,200–7,300 point area as a key support zone for buyers. The index is now trading at an all-time high, while the RSI remains just below 60, suggesting there is still room for further upside. Key support levels are located near 7,500 and 7,300 points, where the market has previously seen significant buying interest.
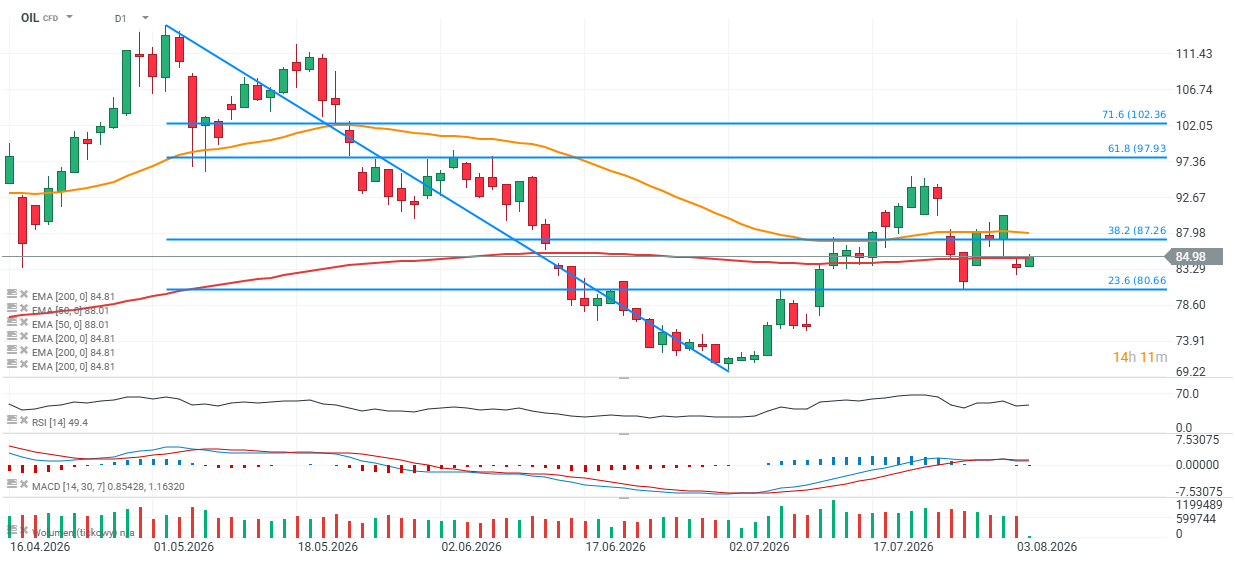
Source: xStation5 Brent crude oil (OIL) has pulled back sharply from its recent local high near $94 per barrel and failed to break above the 61.8% Fibonacci retracement of the latest downward move. The next major support lies around $80 per barrel, defined by the 23.6% Fibonacci retracement and previous price reaction levels.
Source: xStation5