
Facts
- GBPCHF pair moved back above the 14-day exponential moving average (EMA14; light purple) yesterday, despite a brief dip below 1.058 during the early session.
- One week Risk Reversal indicator has reached its highest level since July 2024.
- RSI is currently oscillating between 50 and 60.
Recommendation
- Long Position (BUY) at market price in GBPCHF
- Target Prices (Take Profit): 1.06340 (TP1), 1.06645 (TP2)
- Stop Loss (SL): 1.05400
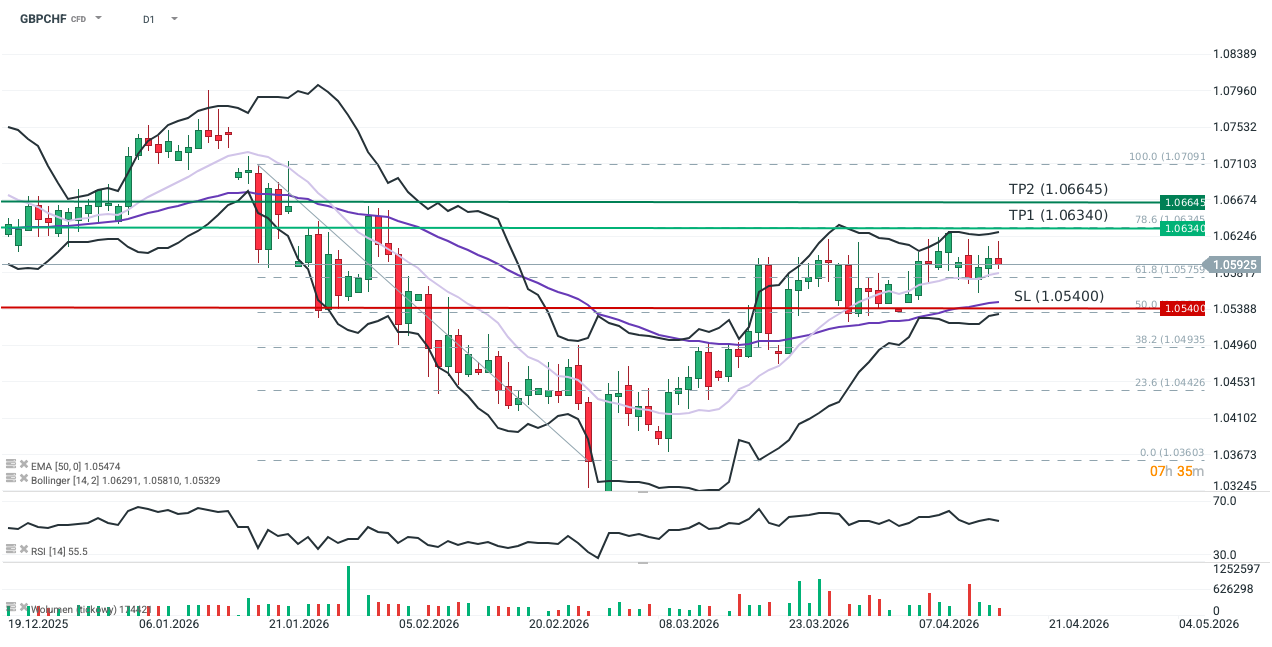
Source: xStation5
Opinion
The GBPCHF sell-off triggered by the outbreak of conflict in the Middle East capped months of Sterling weakness, driven by growth concerns and expectations of UK rate cuts. Approximately one week after the US and Israeli strikes on Iran, the pair initiated an upward trajectory. This shift is supported by the UK’s significant exposure to surging natural gas prices, which increases the risk of an inflationary rebound and a return to interest rate hikes.
Following a correction earlier this week, the pair is gradually rebounding, confirming the ongoing trend. While the UK still faces a high risk of stagflation, today’s GDP data (+0.5% m/m; exceeding the Reuters consensus of 0.1%) has somewhat cooled recession fears amid energy price inflation. Growing optimism is also reflected in the options market: the 1-week Risk Reversal is at its highest since July 2024, indicating a decrease in hedging demand against Sterling declines (i.e., fewer PUT options).
Sterling should remain supported against the Franc in the short term, regardless of further developments in the Strait of Hormuz. In an escalation scenario, concerns over energy price pressure would exert symmetrical pressure on the Bank of England to resume rate hikes (the market currently prices one 25 bps hike for September). Conversely, de-escalation would reduce fears of economic stagnation and dampen demand for safe-haven assets, including the Franc. It is worth noting that the Franc also lost ground against the Dollar in March, suggesting it was not the primary choice for investors seeking a “safe harbor” for capital.
Methodology
This recommendation was prepared based on a technical analysis of the GBPCHF chart and a fundamental analysis of the respective economies (focusing on UK monetary policy).
- Directional Bias: Established using moving averages, price action, and market expectations regarding central bank responses to the Middle East conflict.
- Exit Strategy: Target and Stop Loss levels were determined using Fibonacci retracements of the latest downward leg, Bollinger Bands, and Price Action. TP1: Set at the 78.6% Fibonacci level, coinciding with the upper Bollinger Band on the 14-day interval. TP2: Set at the resistance level established between February 2nd and 3rd. Stop Loss: Placed at the 50% Fibonacci level, which coincides with the lower Bollinger Band and the 50-day EMA.
- TP1: Set at the 78.6% Fibonacci level, coinciding with the upper Bollinger Band on the 14-day interval.
- TP2: Set at the resistance level established between February 2nd and 3rd.
- Stop Loss: Placed at the 50% Fibonacci level, which coincides with the lower Bollinger Band and the 50-day EMA.