S&P 500 — US Large Cap Index
 FTSE 100 — UK Blue Chips
 Euro Stoxx 50 — Eurozone Leaders
 DAX 40 — German Equities
 CAC 40 — French Market Index
 Nikkei 225 — Japan Benchmark
 Hang Seng — Hong Kong Index
 Shanghai Composite — China Mainland
 ASX 200 — Australian Market
 TSX Composite — Canada Index
 Nifty 50 — India Large Cap
 STI Index — Singapore Market
 KOSPI — South Korea Index
 Bovespa — Brazil Equities
 JSE Top 40 — South Africa Index
 IPC Index — Mexico Market

Facts
- The US inflation data for July provided no surprises; both the headline and core measures moderated to 3.4% and 2.5%, respectively.
- The market-implied probability of a Federal Reserve interest rate hike currently stands at approximately 50%.
- Tomorrow at 12:30 PM, data regarding PPI inflation and weekly US jobless claims will be published.
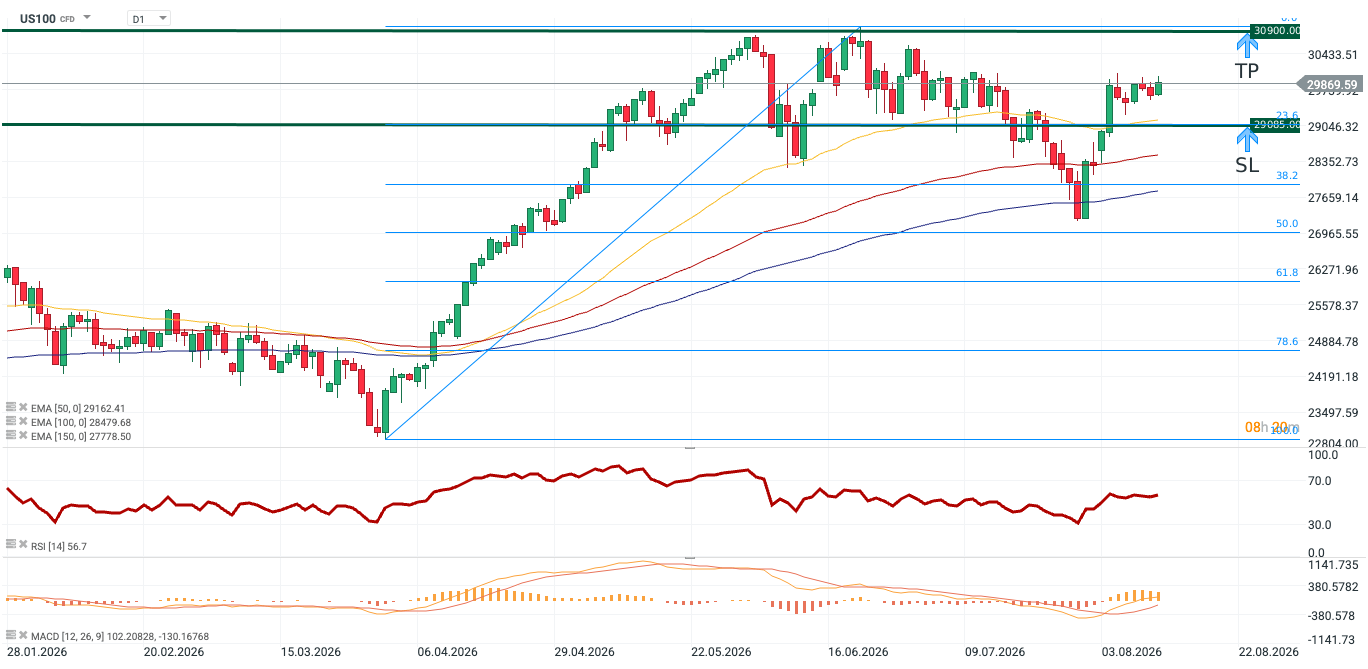
- The RSI (14) indicator does not suggest that the US100 is overbought.
- The MACD indicator does not currently signal a change in the uptrend.
Recommendation
- Position: Long (BUY) on the US100 at market price (29869.59).
- Target Price (Take Profit): 30900 (TP)
- Stop Loss (SL): 29085
Figure 1: US100 (29.10.2025 – 12.08.2026)
Source: xStation, 12.08.2026 (1:39 PM)
Opinion
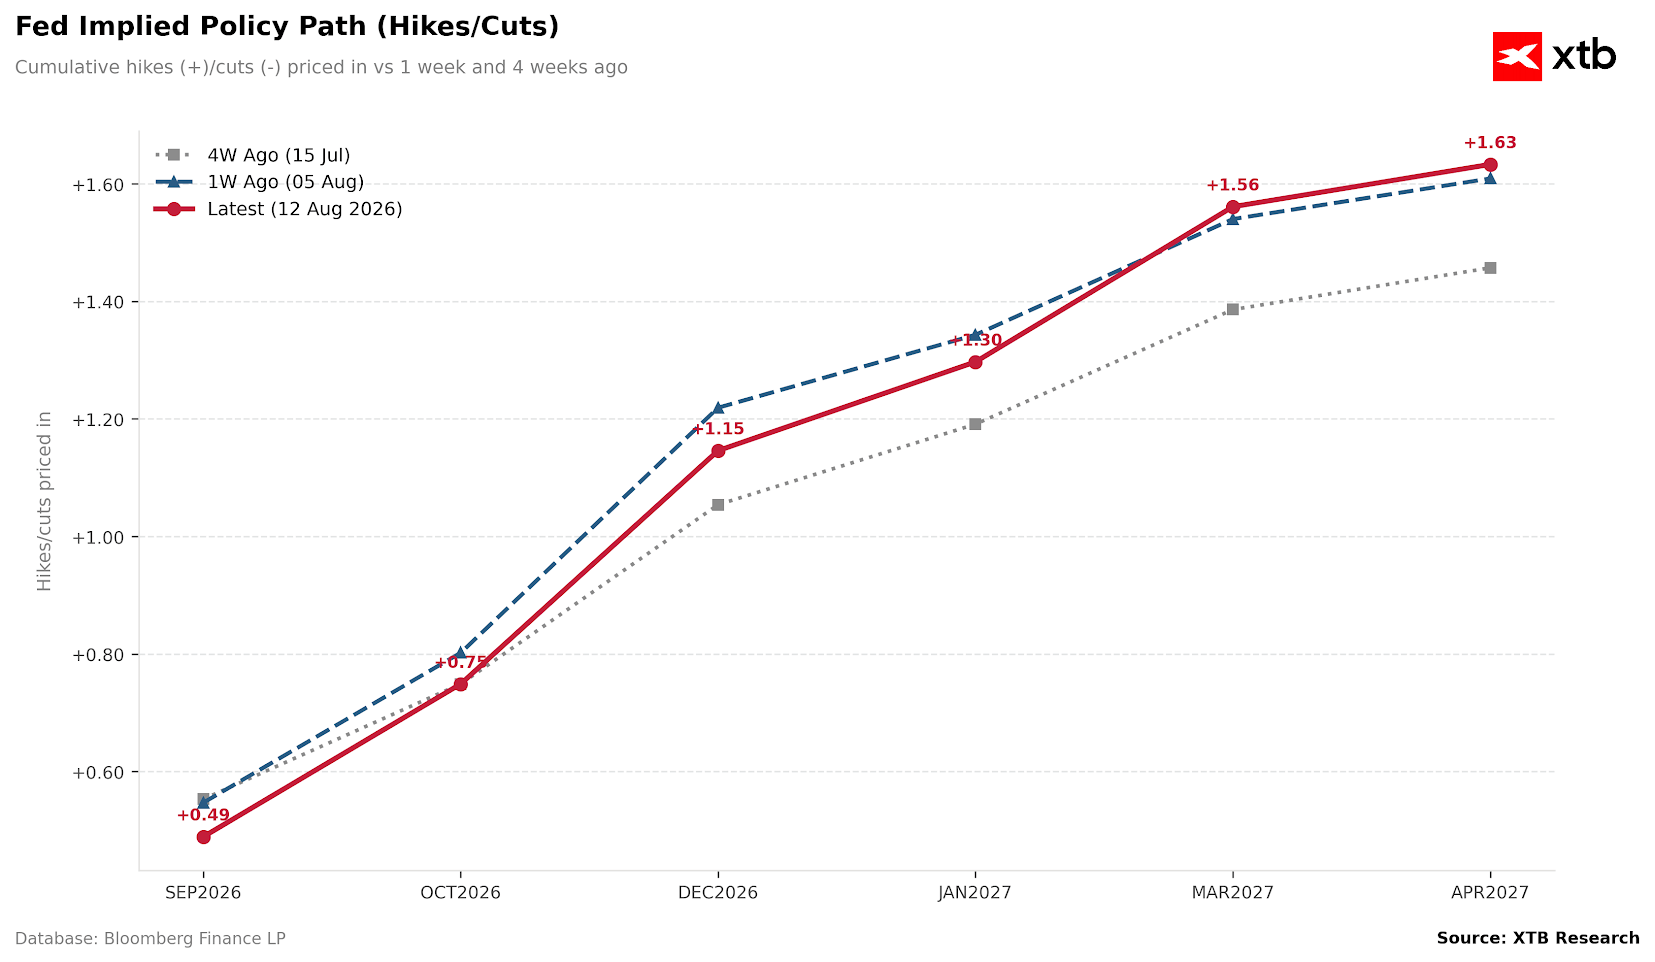
The July US inflation reading yielded no surprises. Both measures remained consistent with expectations, on both an annual and monthly basis. For the market, however, this proved sufficient to sustain dovish repricing regarding the projected path of Federal Reserve interest rates.
Figure 2: Fed Implied Policy Path Before the July Inflation Reading [Number of Hikes] (2025-2026)
Source: XTB Research, 12.08.2026
Figure 3: Fed Implied Policy Path After the July Inflation Reading [Number of Hikes] (2025-2026)
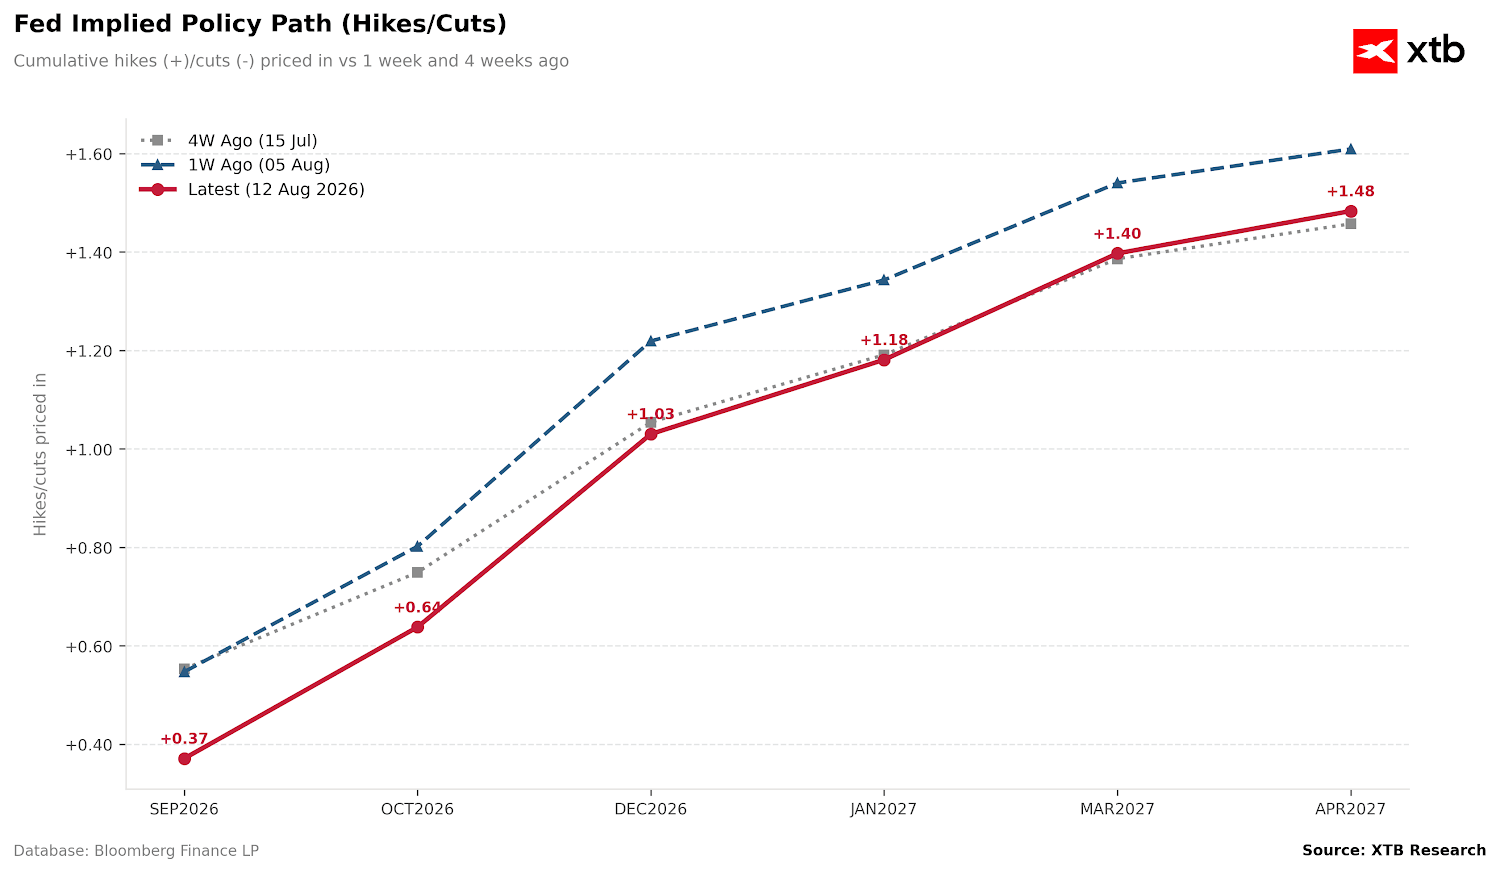
Source: XTB Research, 12.08.2026 It appears the market is increasingly convinced that the FOMC will maintain interest rates at the current level in September. A further decline in valuations in this regard should provide support for the US equity market. The opportunity for further reducing bets on interest rate hikes will arise tomorrow, driven by the PPI inflation reading and weekly jobless claims (both to be released at 12:30 PM). Subsequently, there will be an extended period of silence on the geopolitical front, which, in the absence of major developments in the Middle East, may allow investors to refocus on the concluding earnings season. This has proven exceptionally successful for US companies. In the case of the S&P 500, over 85% of companies reported earnings per share (EPS) exceeding expectations, representing the strongest result in this regard since the second quarter of 2021. Company profits were, on average, nearly 30% higher than the consensus, although this figure was slightly distorted by unrealised net gains from securities reported by Alphabet and Amazon. The US100 index remains approximately 3.5% below its June peak. However, it is recovering losses following a recent correction. Compared to the low from the final days of July, the appreciation has reached nearly 9.5%. We expect a continuation of the uptrend. From a technical perspective, this is supported by the configuration of moving averages (EMA 50 above EMA 100 and EMA 150), the MACD histogram, and the RSI (57.3) indicator, which still does not suggest overbought conditions.
Methodology
The recommendation was prepared based on a fundamental analysis of US macroeconomic data and an assessment within the context of market valuations of interest rate hikes by the Federal Reserve. The direction of the recommendation was determined by evaluating the prospects for the aforementioned valuations and analysing the results of Nasdaq 100 companies in the second quarter of the year. Take Profit and Stop Loss levels were determined using key psychological levels (TP at 30900, slightly below the ATH) and Fibonacci retracements (SL at 29085, representing the 23.6% Fibonacci level).