S&P 500 — US Large Cap Index
 FTSE 100 — UK Blue Chips
 Euro Stoxx 50 — Eurozone Leaders
 DAX 40 — German Equities
 CAC 40 — French Market Index
 Nikkei 225 — Japan Benchmark
 Hang Seng — Hong Kong Index
 Shanghai Composite — China Mainland
 ASX 200 — Australian Market
 TSX Composite — Canada Index
 Nifty 50 — India Large Cap
 STI Index — Singapore Market
 KOSPI — South Korea Index
 Bovespa — Brazil Equities
 JSE Top 40 — South Africa Index
 IPC Index — Mexico Market

Facts
- The EURUSD exchange rate remains above the 200-period Exponential Moving Average (EMA200) on the H1 timeframe.
- According to €STR futures pricing, the market estimates a 25-basis-point rate hike by the ECB with a probability of nearly 91% at the upcoming June meeting.
- The yield on the 10-year US Treasury bond (US10Y) has declined to 4.44% from this year’s highs near 4.70%.
Recommendation Long position at market price
- Take profit: 1.1710, 1.1780
- Stop loss: 1.1575
Opinion
The EURUSD chart on the hourly timeframe (H1) indicates an attempt to break above and remain sustainably above both the 200-period Exponential Moving Average EMA200 (blue line) and the 50-period EMA50 (yellow line), which may be viewed as a technical signal of improving short-term market conditions. At the same time, EURUSD is trading near an important support zone around 1.1580–1.1590. This area has previously seen repeated price reactions. From a technical perspective, the long position assumes a continuation of the rebound, potentially toward the 1.1780 level.
Fundamental factors also support a stronger euro scenario. Dollar weakness is being driven by the sharp decline in WTI crude oil prices (down more than 16% on a weekly basis) amid hopes for a peace agreement between the US and Iran. Lower oil prices reduce inflation expectations in the United States, contributing to a decline in 10-year US Treasury yields to 4.44% and narrowing the dollar’s interest rate advantage. Meanwhile, in the euro area, April CPI inflation rose to 3.0% year-over-year, well above target, while leading ECB officials such as Isabel Schnabel and Philip Lane have signaled the need for a rate hike in June. This limits the scope for monetary easing in Europe and increases upward pressure on the common currency. In this environment, a long EURUSD position at market price appears justified.
Therefore, we recommend taking a long position with a stop loss at 1.1575 and take-profit targets at 1.1710 and 1.1780, assuming that holding above the EMA200 on the H1 timeframe remains the key condition for continuation of the bullish scenario.
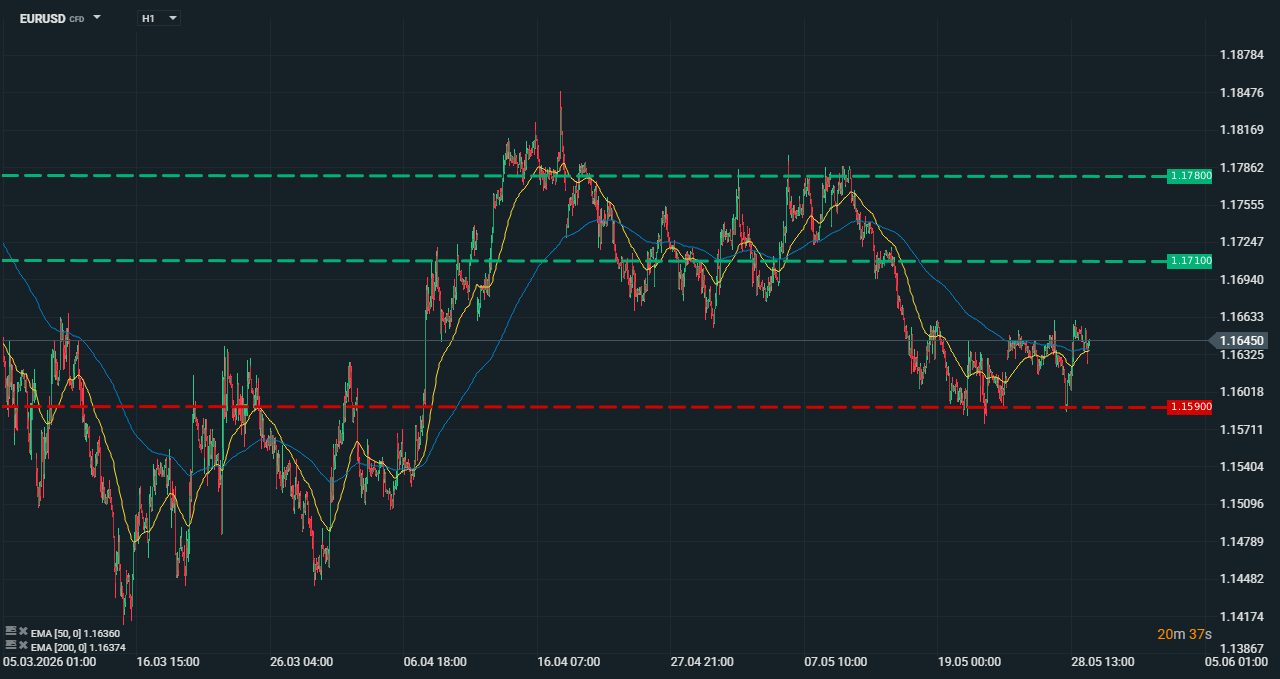
Chart source: xStation