S&P 500 — US Large Cap Index
 FTSE 100 — UK Blue Chips
 Euro Stoxx 50 — Eurozone Leaders
 DAX 40 — German Equities
 CAC 40 — French Market Index
 Nikkei 225 — Japan Benchmark
 Hang Seng — Hong Kong Index
 Shanghai Composite — China Mainland
 ASX 200 — Australian Market
 TSX Composite — Canada Index
 Nifty 50 — India Large Cap
 STI Index — Singapore Market
 KOSPI — South Korea Index
 Bovespa — Brazil Equities
 JSE Top 40 — South Africa Index
 IPC Index — Mexico Market
The UK economy contracted by 0.1% in April 2026 as a result of the escalating conflict in the Middle East. According to the latest data from the Office for National Statistics (ONS), this marks the first monthly GDP decline since August 2025. Although this contraction aligns with forecasts from economists polled by Reuters, it represents a sharp trend reversal from March, which recorded a 0.3% growth. However, looking at the less volatile three-month perspective, real GDP grew by 0.7% in the period to April 2026, demonstrating that the British economy entered the current crisis on relatively stable foundations.
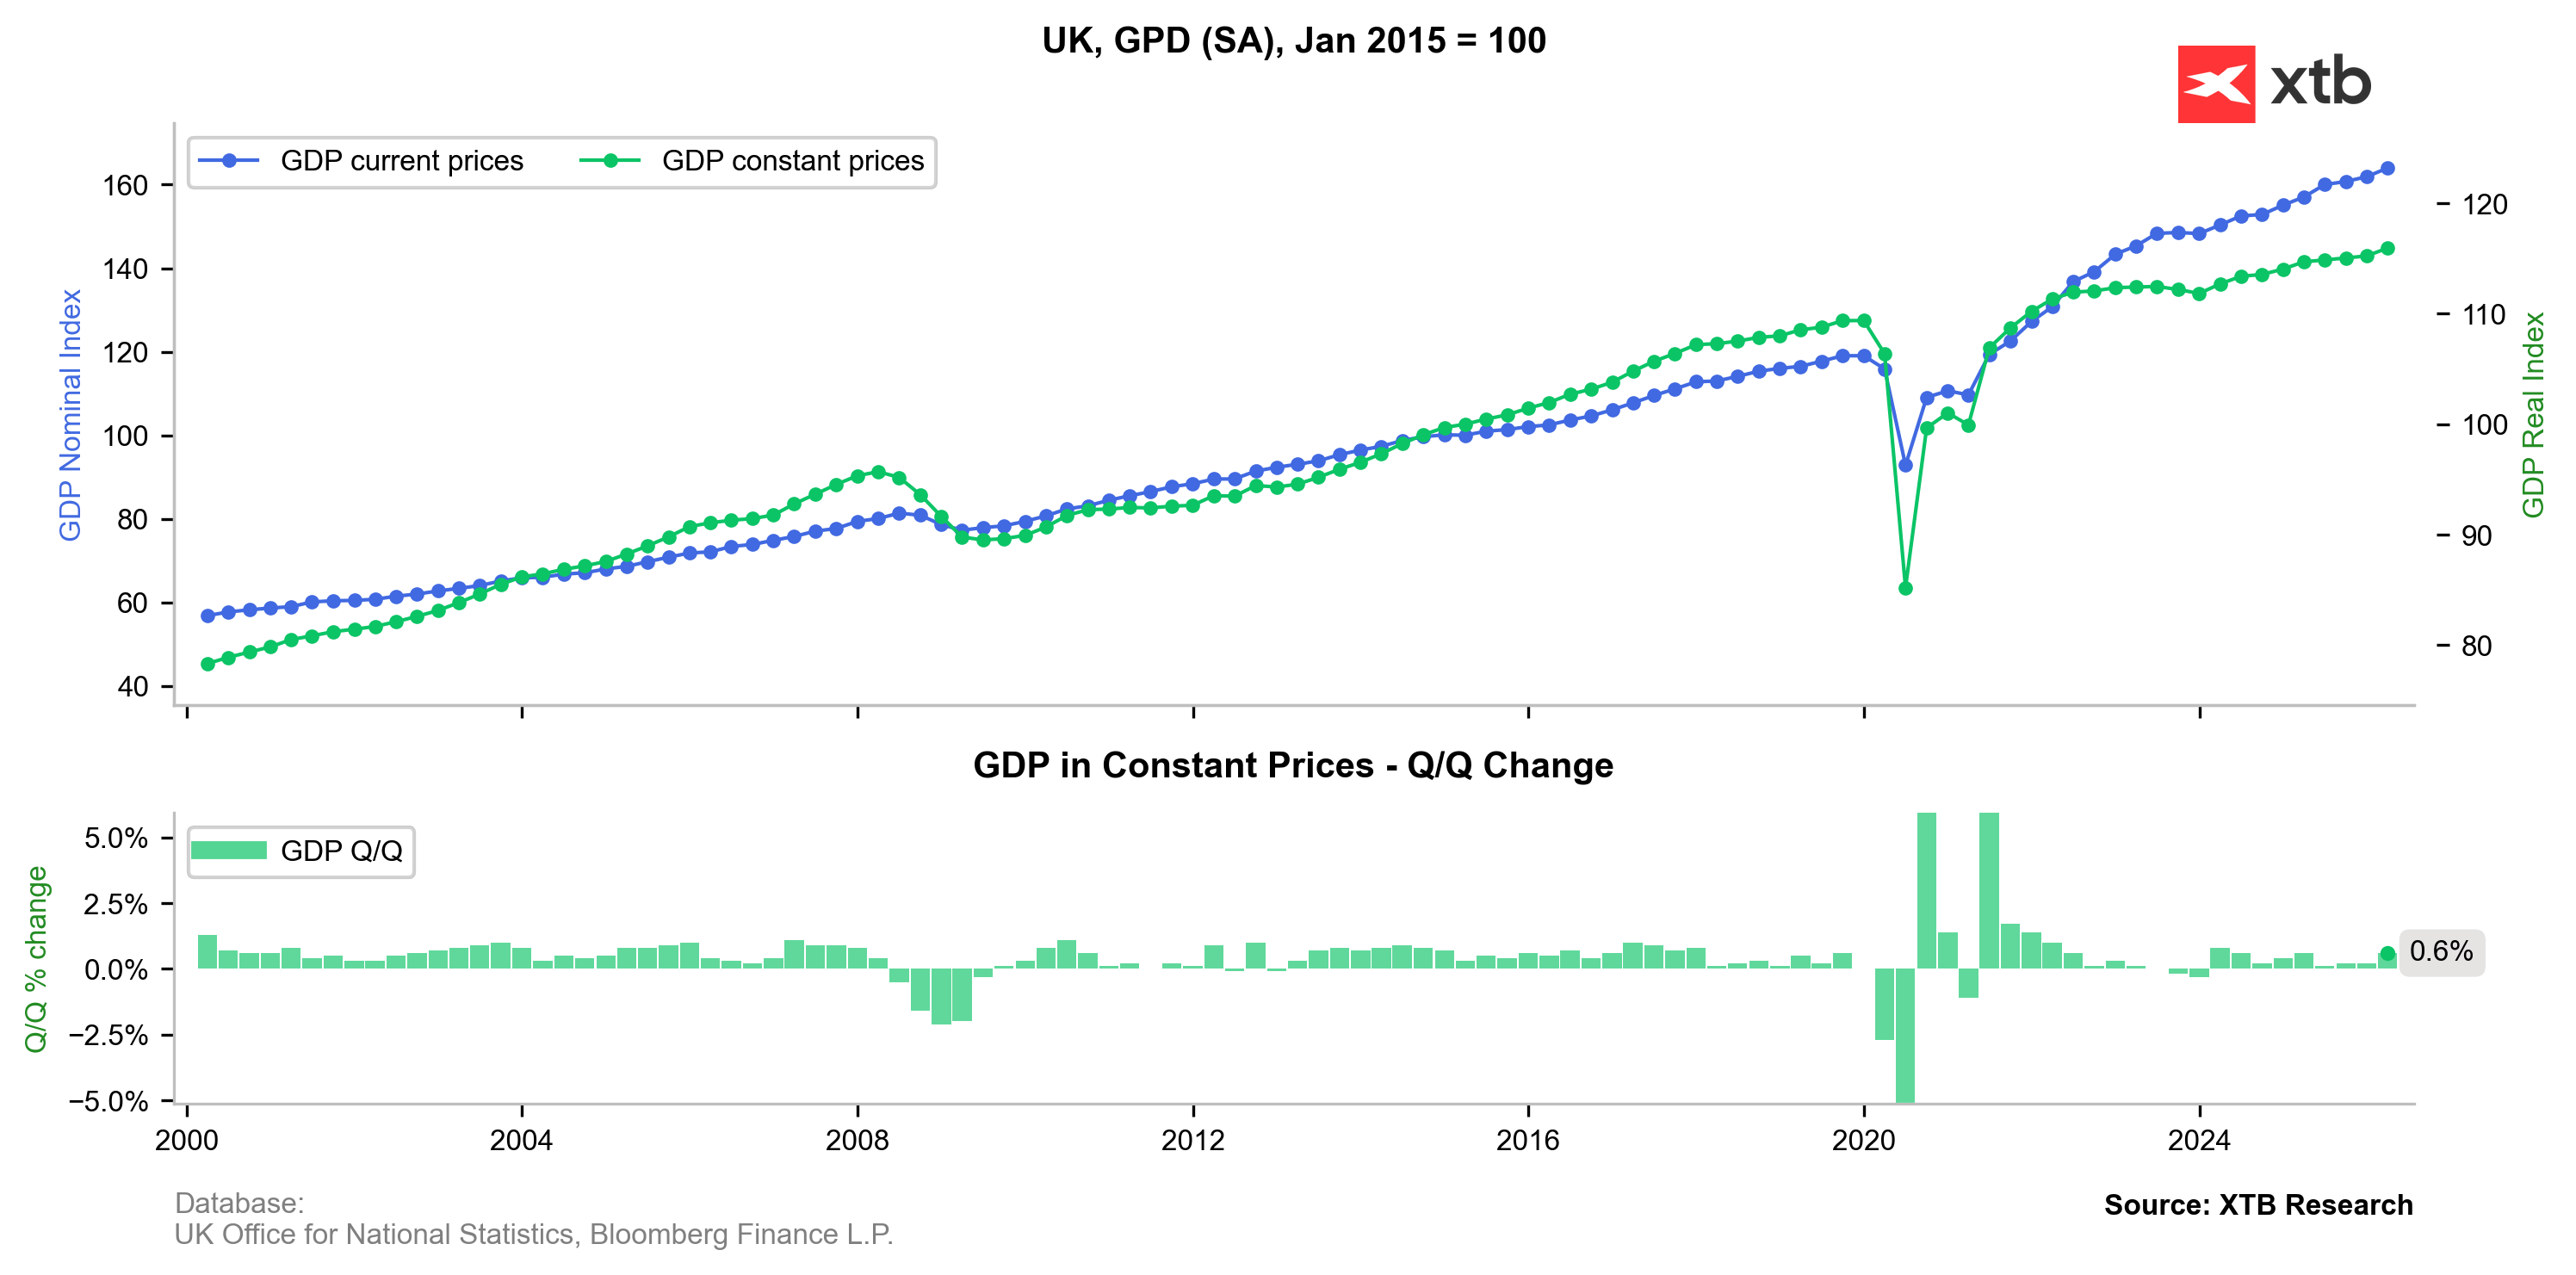
Chart 1: Real and nominal GDP in the United Kingdom (upper panel) and quarter-on-quarter change (lower panel). In Q1 2026 (January–March), the UK economy grew by 0.6%, offering a solid base by British standards before the effects of the Middle East war materialized. Source: XTB Research based on ONS/Bloomberg data.
How the Iran Conflict Stalled Growth in the United Kingdom
The main catalyst for April’s slowdown is the war between Iran and the US, which recently passed the 100-day mark. The effective blocking of the Strait of Hormuz—a crucial shipping route for oil and many other commodities—paralyzed global supply chains and triggered a sharp surge in energy and fuel prices. As a net energy importer, the UK is exceptionally vulnerable to international energy shocks. A sudden surge in prices at petrol stations forced motorists to drastically cut consumption in April, reversing the positive growth impulses seen at the beginning of the year. Furthermore, ONS surveys revealed widespread complaints from businesses regarding falling turnovers and rising production costs across the wholesale, manufacturing, and transport sectors.
Sector Breakdown: Slump in Services, Stagnation in New Construction
April’s economic slowdown was characterized by uneven performances across core industrial sectors:
- Services Sector: Recorded a 0.2% decline, becoming the primary driver of the monthly GDP drop. The arts, entertainment, and recreation sector suffered the most, posting a drastic 9.1% fall. This was mainly due to the cancellation of multiple sporting events in the Middle East, which directly hit UK-based companies.
- Construction: Ticked up marginally by 0.1%. However, this growth came solely from a 0.6% recovery in repair and maintenance. New construction projects fell by 0.3%, complicating the government’s political promises to accelerate housebuilding in the UK.
- Industrial Production: Showed zero growth (0.0%). Although manufacturing grew by 0.4% (driven by a 4.2% surge in pharmaceutical production), these gains were completely offset by shrinking outputs in the utility sector.
Stagflation Risks and the Bank of England’s Dilemma
The sudden dip in GDP momentum has raised serious concerns about a dangerous descent towards stagflation—a situation where economic stagnation couples with stubborn inflation. The International Monetary Fund (IMF) has already downgraded its 2026 UK economic growth forecast from 1.3% to just 0.8%, warning that Britain could feel the impact of the war most acutely among major economies. Economic conditions could deteriorate further in the third quarter, when the domestic energy price cap is set to rise by 13%, allowing suppliers to pass higher oil and gas costs onto consumers. This leaves the Bank of England in a precarious position ahead of its upcoming interest rate decision. Policymakers must now balance combating war-driven inflation against the risk of triggering a deeper recession.
Following the ONS release, sterling initially lost 0.2% against the dollar as markets scaled back expectations for subsequent rate hikes. Over time, however, a global increase in risk appetite took over in response to easing tensions between the US and Iran, resulting in a weaker dollar. Moreover, the softer GDP does not eliminate the hawkish pressure on the Bank of England, which is widely expected to hold interest rates at 3.75%. Some members of the Monetary Policy Committee may vote for a hike, signaling the central bank’s readiness to combat the prolonged energy shock.
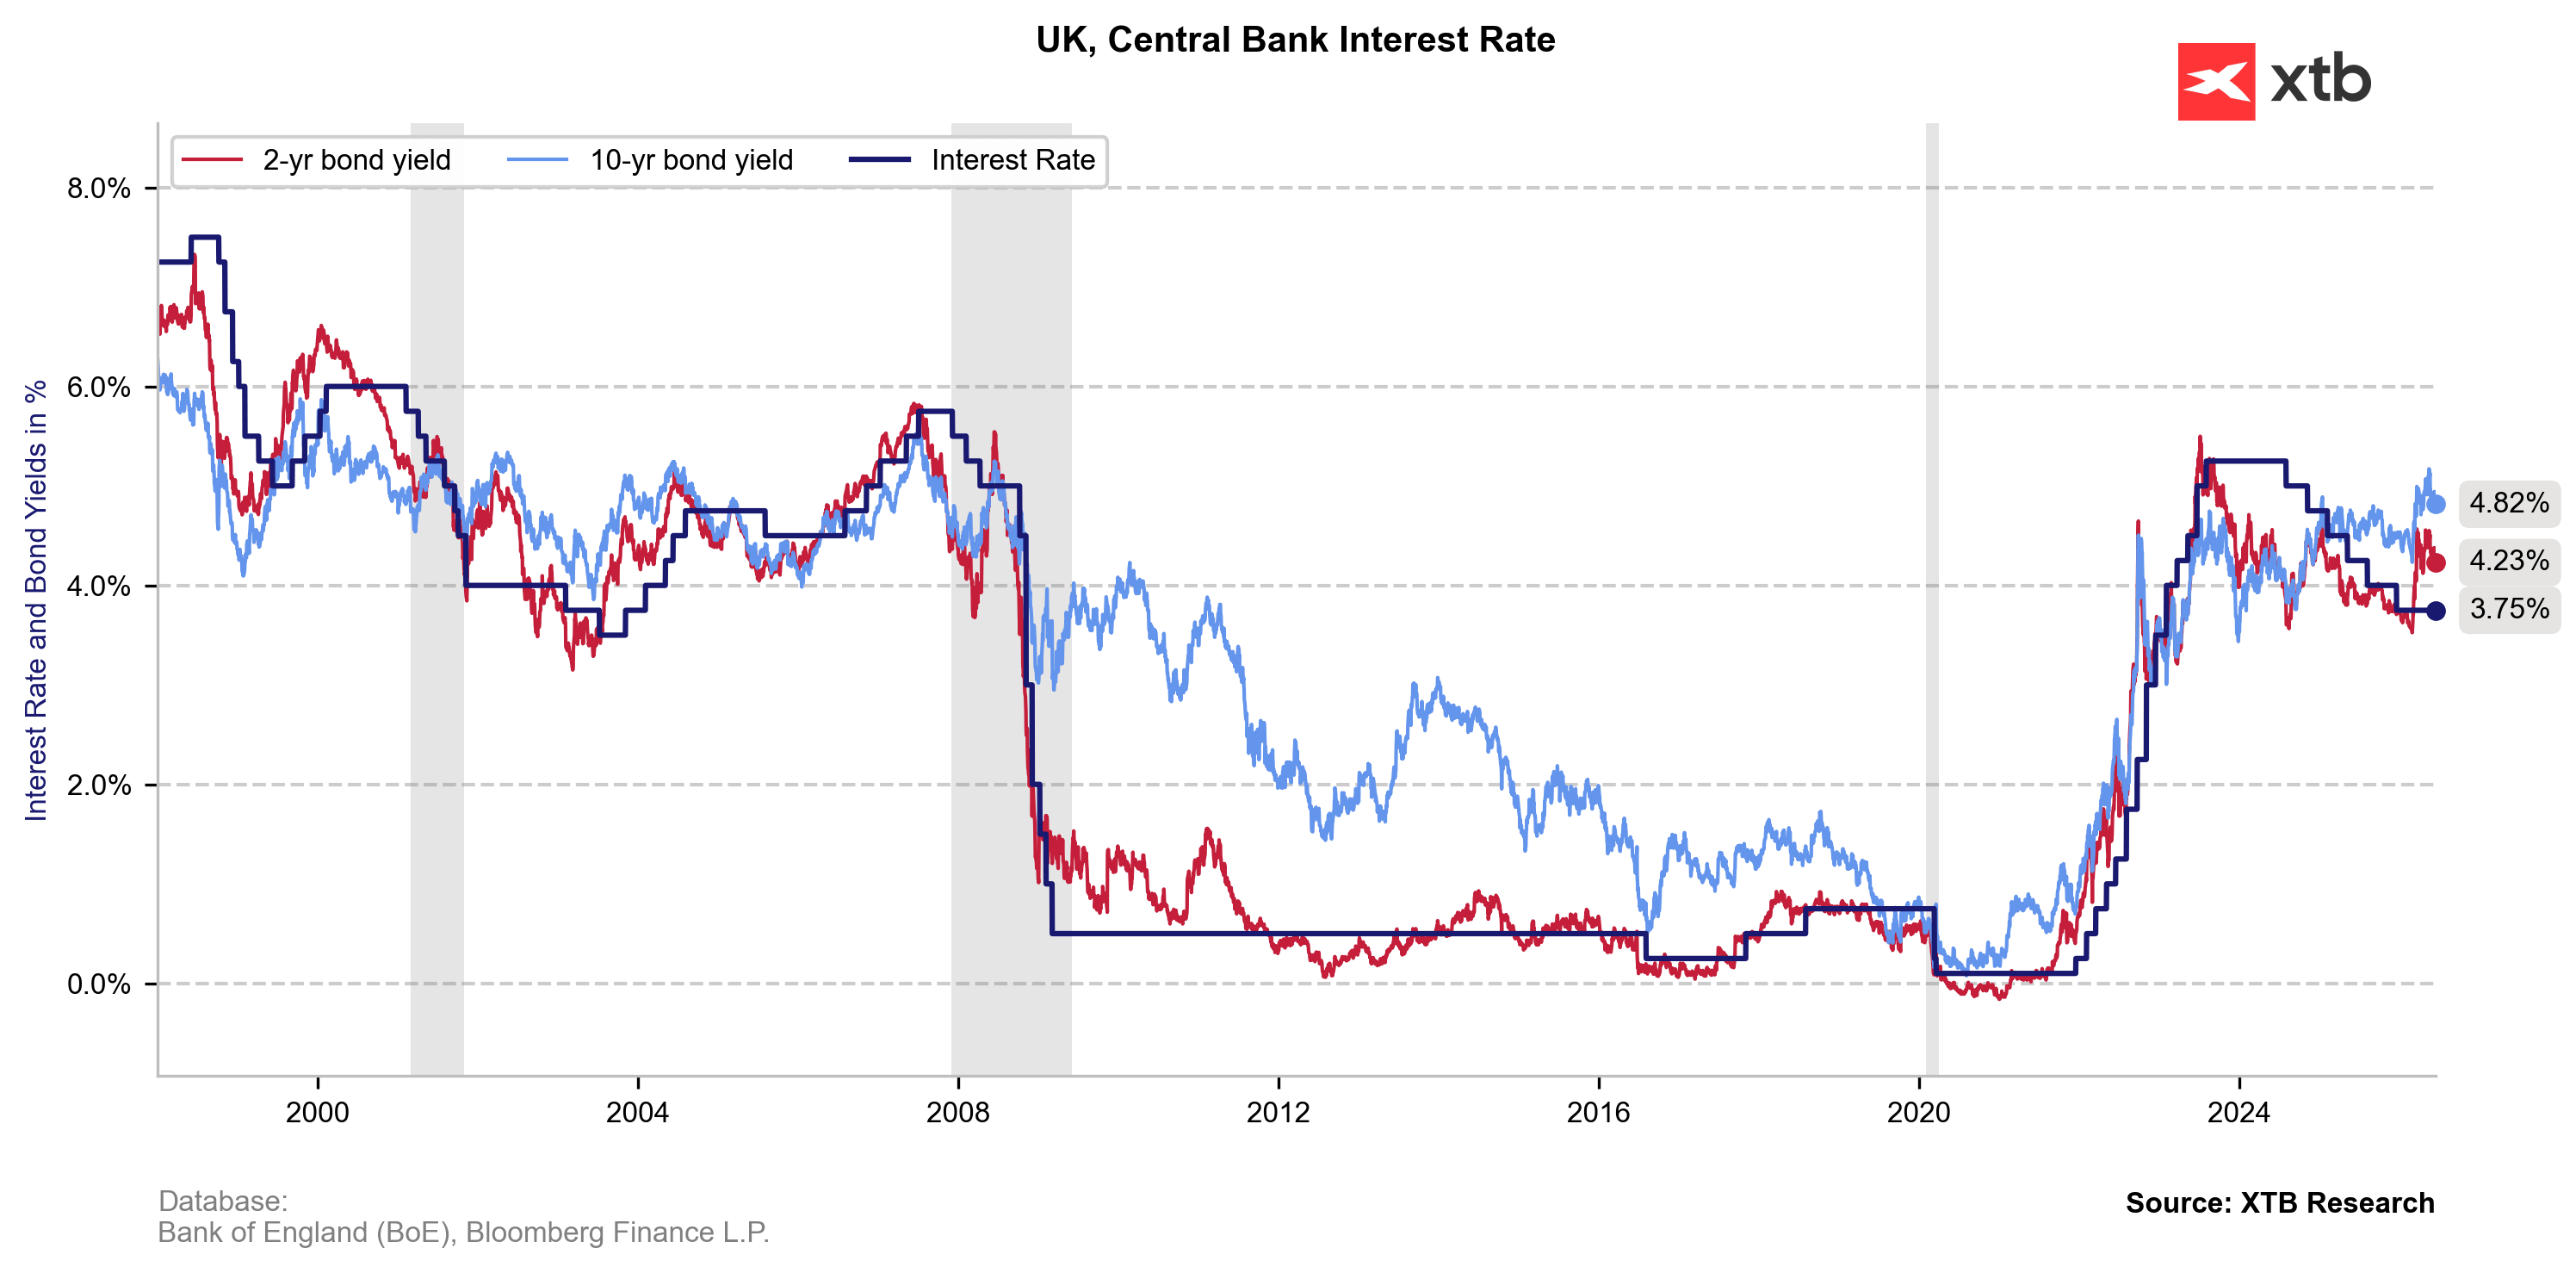
Chart 2: The Bank of England’s main interest rate and UK 2- and 10-year bond yields. Yields are already clearly above the 3.75% rate, signaling hawkish expectations from the debt market, which is organically tightening financial conditions. Source: XTB Research based on Bloomberg data.
Technical Analysis: GBPUSD (D1)
GBPUSD is currently trading slightly up (+0.05%), although the pair on the D1 interval remains in a local downtrend, consolidating around the 1.34158 level. The price is currently moving below key exponential moving averages: EMA 30 (1.34226) and EMA 100 (1.34372), which act as crucial resistance for any building momentum. Following a rebound from recent support near 1.3330, selling pressure has slowed down. The RSI (14) indicator at 49.5 signals complete market neutrality. The next direction depends on a sustained breakout above the moving averages or a return to test the recent lows.
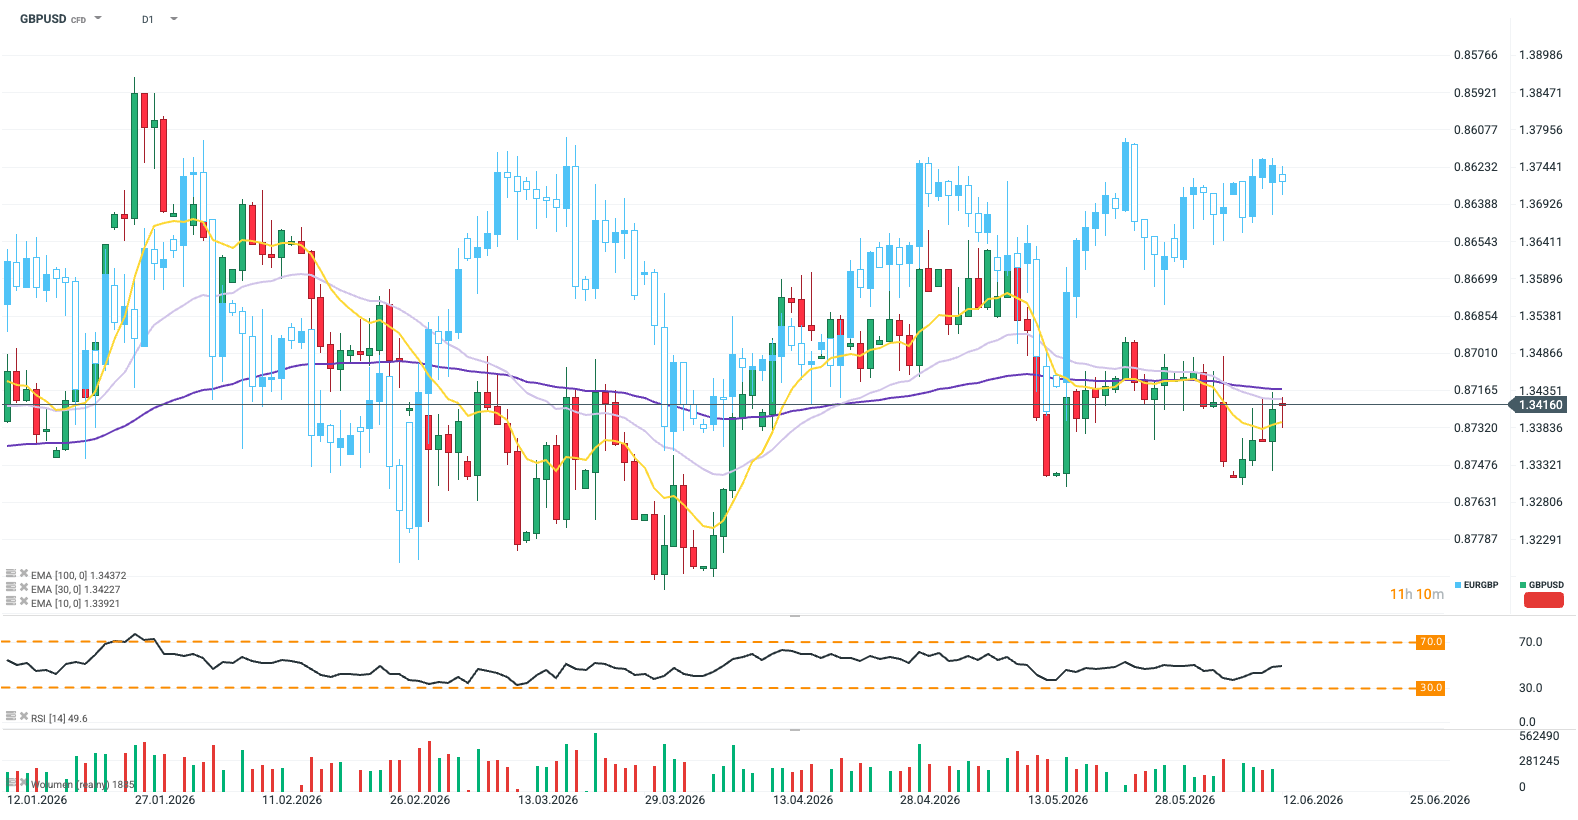
Chart 3: GBPUSD and EURGBP (inverted; blue) exchange rates. Source: xStation5