S&P 500 — US Large Cap Index
 FTSE 100 — UK Blue Chips
 Euro Stoxx 50 — Eurozone Leaders
 DAX 40 — German Equities
 CAC 40 — French Market Index
 Nikkei 225 — Japan Benchmark
 Hang Seng — Hong Kong Index
 Shanghai Composite — China Mainland
 ASX 200 — Australian Market
 TSX Composite — Canada Index
 Nifty 50 — India Large Cap
 STI Index — Singapore Market
 KOSPI — South Korea Index
 Bovespa — Brazil Equities
 JSE Top 40 — South Africa Index
 IPC Index — Mexico Market

- USD/JPY trades flat at around 159.00 as both currencies underperform their peers.
- The US aims to double the pace of its bond-buying operations to curb rising borrowing costs.
- Japan’s National CPI ex. Fresh Food arrives higher at 1.8% YoY, as expected.
The Japanese Yen (JPY) trades in a limited range at around 159.00 against the US Dollar (USD) during the Asian trading session on Friday. The pair consolidates, while both the JPY and the USD are underperforming against their other currency peers.
US Dollar Price Today
The table below shows the percentage change of US Dollar (USD) against listed major currencies today. US Dollar was the weakest against the New Zealand Dollar.
| USD | EUR | GBP | JPY | CAD | AUD | NZD | CHF | |
|---|---|---|---|---|---|---|---|---|
| USD | -0.14% | -0.11% | -0.06% | -0.19% | -0.41% | -0.45% | -0.12% | |
| EUR | 0.14% | 0.03% | 0.07% | -0.08% | -0.27% | -0.29% | 0.03% | |
| GBP | 0.11% | -0.03% | 0.04% | -0.10% | -0.28% | -0.33% | -0.00% | |
| JPY | 0.06% | -0.07% | -0.04% | -0.12% | -0.34% | -0.39% | -0.05% | |
| CAD | 0.19% | 0.08% | 0.10% | 0.12% | -0.22% | -0.25% | 0.07% | |
| AUD | 0.41% | 0.27% | 0.28% | 0.34% | 0.22% | -0.05% | 0.29% | |
| NZD | 0.45% | 0.29% | 0.33% | 0.39% | 0.25% | 0.05% | 0.34% | |
| CHF | 0.12% | -0.03% | 0.00% | 0.05% | -0.07% | -0.29% | -0.34% |
The heat map shows percentage changes of major currencies against each other. The base currency is picked from the left column, while the quote currency is picked from the top row. For example, if you pick the US Dollar from the left column and move along the horizontal line to the Japanese Yen, the percentage change displayed in the box will represent USD (base)/JPY (quote).
However, financial market experts are of the view that the Japanese currency could outperform the US Dollar as the Bank of Japan (BoJ) is expected to remain on a tight monetary policy path. Also, the United States (US) Treasury Department’s plans to double down on its debt-repayment plans, in an effort to curb higher borrowing costs, would keep the US Dollar under pressure.
Dollar pullback eases pressure on USD/JPY as BoJ rate path eyed
Rabobank’s FX team notes that the recent move lower in the Dollar, following news of Treasury Secretary Bessent’s buyback plans, has helped relieve some of the immediate strain on the pair, with “USD/JPY … steered a little further away from the psychologically important 160 level.”
Looking ahead, the bank anchors its outlook on the expectation that the BoJ will quicken the pace of tightening, stating that “on the assumption that the BoJ will accelerate the pace of rate hikes, we maintain a 3-month USD/JPY forecast of 158,” while cautioning that they “cannot rule out the possibility of further attempts at the upside in the near-term.”
Meanwhile, higher-than-expected Japan’s National Consumer Price Index (CPI) data for July has reinforced BoJ interest rate hike expectations.
Earlier in the day, the Statistics Bureau of Japan reported that the CPI ex. Fresh Food grew at a faster pace of 1.8% Year-on-Year (YoY), as expected, faster than 1.6% in June.
USD/JPY Technical Analysis
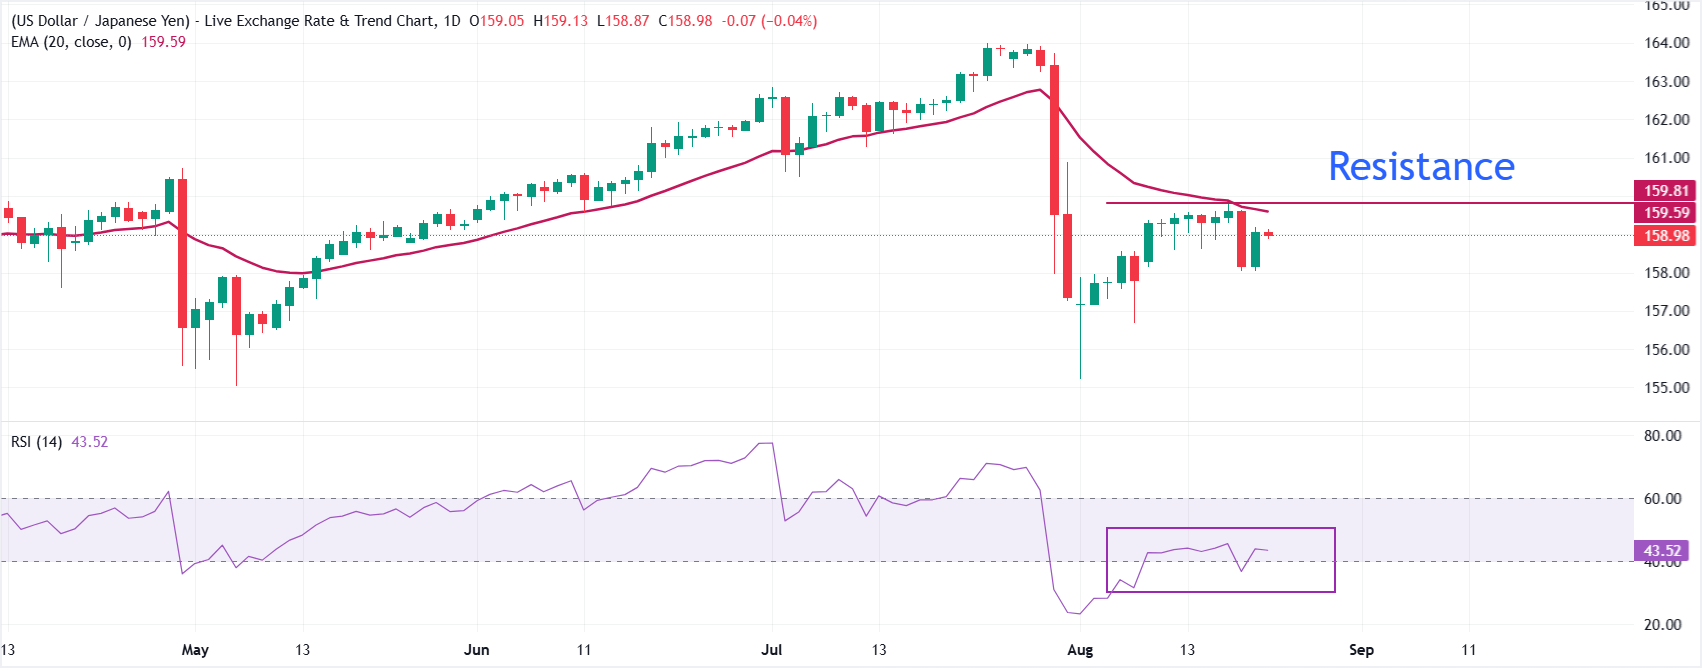
In the daily chart, USD/JPY trades at 158.98, maintaining a bearish near-term tone as it holds beneath the 20-day exponential moving average (EMA) at 159.59. Price action remains capped by this dynamic resistance, suggesting upside attempts are likely to struggle while the pair trades below the short-term trend metric.
The Relative Strength Index (RSI) at 43.50 stays in neutral territory, hinting at modest bearish pressure rather than oversold conditions.
On the topside, immediate resistance is located at the 20-day EMA at 159.59, and a sustained break above this level would be needed to ease the current downside bias and allow for a stronger recovery phase. Looking down, the August 20 low near 158.00 is the key supply level, followed by the August 7 low at 156.68.