S&P 500 — US Large Cap Index
 FTSE 100 — UK Blue Chips
 Euro Stoxx 50 — Eurozone Leaders
 DAX 40 — German Equities
 CAC 40 — French Market Index
 Nikkei 225 — Japan Benchmark
 Hang Seng — Hong Kong Index
 Shanghai Composite — China Mainland
 ASX 200 — Australian Market
 TSX Composite — Canada Index
 Nifty 50 — India Large Cap
 STI Index — Singapore Market
 KOSPI — South Korea Index
 Bovespa — Brazil Equities
 JSE Top 40 — South Africa Index
 IPC Index — Mexico Market

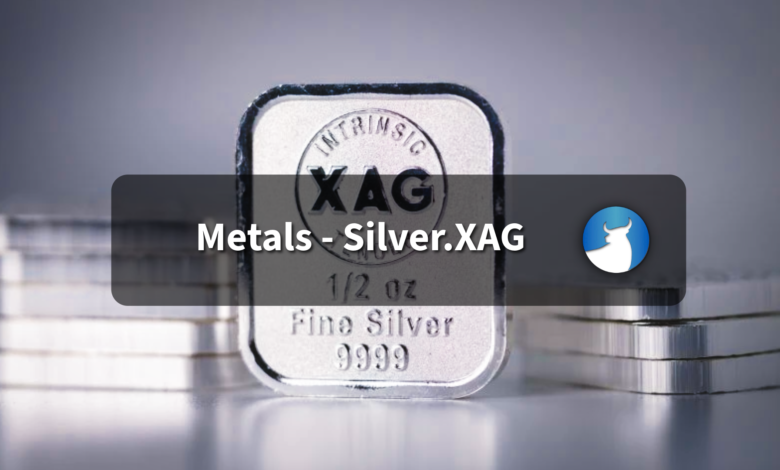
- Silver struggles to capitalize on the previous day’s modest bounce from its lowest level since August.
- Traders now look forward to the crucial US PCE Price Index and the Q2 GDP print for a fresh impetus.
- The technical setup seems tilted in favor of bearish traders and backs the case for further depreciation.
Silver (XAG/USD) attracts some sellers near the $61.75 area during the Asian session on Wednesday, stalling the previous day’s recovery from the $60.30 region, or the lowest level since August 5. The white metal currently trades near the $61.00 mark, down around 0.70% for the day, as traders now look to the US Personal Consumption Expenditures (PCE) Price Index and the final US Q2 GDP print for a fresh impetus.
From a technical perspective, the XAG/USD maintains a bearish near-term bias beneath the $62.20-$62.25 horizontal support breakpoint and the 200-period Exponential Moving Average (EMA) on the 4-hour chart at $64.28. Meanwhile, the Moving Average Convergence Divergence (MACD) has just turned marginally positive, hinting at only tentative recovery attempts. However, the Relative Strength Index (RSI) around 35 stays in weak territory, reinforcing the idea that downside pressure still dominates despite the recent bounce from sub-$61.00 levels.
This, in turn, suggests that any rebounds could remain shallow and confront stiff resistance near the $61.80-$61.85 area ahead of the $62.00 mark and the $62.20-$62.25 support-turned-hurdle. The latter should act as a key pivotal point, and a sustained move beyond should pave the way for a move towards testing the 200-period EMA at $64.28. Bulls would need to reclaim it to ease the current bearish structure and open the door toward higher levels.
On the downside, the recent price troughs near $60.30 could be the first area where buyers have been attempting to stabilize. This is followed by the $60.00 psychological mark, which, if broken, should pave the way for a fall to the $59.40-$59.35 support before the XAG/USD slides further towards the $59.00 mark. If the metal extends its decline, bears might then aim to challenge the August monthly low, around the $56.60-$56.55 zone, with some intermediate support near the $57.00 round figure.
XAG/USD 4-hour chart