S&P 500 — US Large Cap Index
 FTSE 100 — UK Blue Chips
 Euro Stoxx 50 — Eurozone Leaders
 DAX 40 — German Equities
 CAC 40 — French Market Index
 Nikkei 225 — Japan Benchmark
 Hang Seng — Hong Kong Index
 Shanghai Composite — China Mainland
 ASX 200 — Australian Market
 TSX Composite — Canada Index
 Nifty 50 — India Large Cap
 STI Index — Singapore Market
 KOSPI — South Korea Index
 Bovespa — Brazil Equities
 JSE Top 40 — South Africa Index
 IPC Index — Mexico Market

Agricultural Commodities Forecast: Rice Falls 2.08% as Palm Oil and Cotton Also Decline

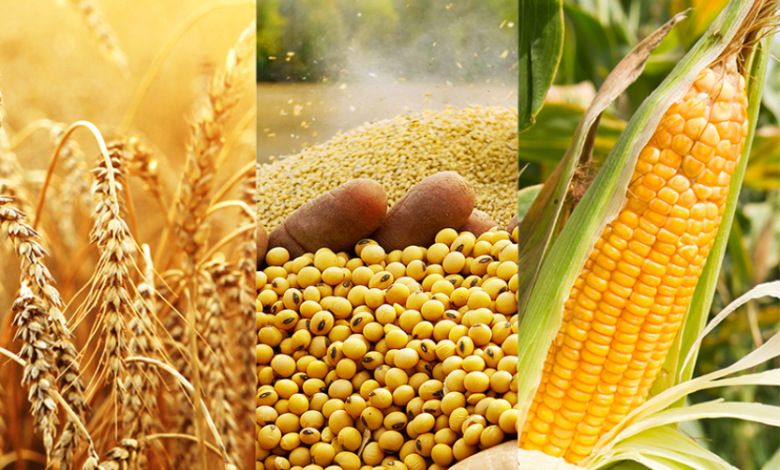
Agricultural commodity markets are facing broad selling pressure, with rice recording the steepest decline in the latest market snapshot, followed by palm oil and cotton. Rice prices fall 2.08%, palm oil declines 1.96%, and cotton trades 0.70% lower.
The declines point to a weaker short-term price picture across these three agricultural markets. However, each commodity has distinct supply and demand drivers, ranging from harvest conditions and export availability in rice to vegetable-oil demand in palm oil and global textile consumption in cotton.
The latest figures do not identify the specific catalysts behind the declines. Traders should therefore distinguish the observed price movements from potential explanations and look for confirmation in export data, crop conditions, inventories, production estimates and demand indicators.
The immediate question is whether the selling pressure will extend into the coming sessions or whether prices will stabilise as buyers respond to lower levels.
Market Snapshot
| Agricultural commodity | Reported price change | Market direction |
|---|---|---|
| Rice | -2.08% | Bearish |
| Palm oil | -1.96% | Bearish |
| Cotton | -0.70% | Bearish |
The supplied market update provides percentage changes only. Absolute prices, contract specifications, trading volumes and technical indicator readings are not available.
Current Agricultural Commodity Price Action
Rice is the weakest performer, declining 2.08%. Palm oil follows with a 1.96% loss, while cotton records a smaller decline of 0.70%.
The difference in the size of the moves suggests that selling pressure is more pronounced in rice and palm oil than in cotton during the reported period. Nevertheless, a single market snapshot cannot establish whether the declines represent a sustained trend or a short-term correction.
Rice prices can respond to harvest volumes, export restrictions, weather conditions, government stockpiles and international purchasing activity. Palm oil is influenced by production in major growing regions, export demand, inventories, competing vegetable oils and energy-market developments. Cotton prices depend on crop conditions, global textile demand, export sales, inventories and the broader outlook for apparel manufacturing.
For traders, the priority is to identify whether the latest declines are supported by deteriorating fundamentals and weakening technical structures. If prices continue to form lower highs and lower lows, the bearish outlook would strengthen. If selling slows and prices recover above recent resistance, a corrective rebound could develop.
Rice Price Forecast: Sellers Maintain the Pressure
Rice has fallen 2.08%, making it the largest decliner among the agricultural commodities listed. The move places the market at the centre of attention for traders assessing short-term downside risk.
Rice prices are particularly sensitive to the balance between production, export availability and consumption. Harvest outcomes in major producing countries can influence global supply, while changes in export policies or government procurement can affect the amount of rice available to international buyers.
Demand is also important. Importing countries may adjust purchasing schedules in response to price changes, domestic stock levels, currency movements and food-security requirements. A reduction in immediate buying can weigh on prices even when underlying consumption remains relatively stable.
The supplied update does not specify whether the latest fall reflects stronger supply, weaker export demand, policy changes or technical selling. Those factors should be assessed against current market information before a directional trade is considered.
What rice traders should watch
- Export demand: Whether new purchasing activity improves or weakens.
- Production and harvest conditions: Whether crop estimates indicate greater or lower supply.
- Government policies: Whether export restrictions, stock releases or procurement measures alter availability.
- Inventory levels: Whether available stocks are increasing or being drawn down.
- Technical structure: Whether prices break below recent support or recover above resistance.
A sustained break below a confirmed recent low could extend the bearish move. Conversely, stabilisation supported by stronger export demand or supply concerns could encourage a recovery.
Palm Oil Price Forecast: A Sharp Decline Raises Supply and Demand Questions
Palm oil falls 1.96%, placing it close to rice in terms of downside performance. The decline makes the vegetable-oil market another key area to monitor.
Palm oil prices are influenced by production in major producing countries, export demand, stock levels, seasonal harvesting patterns and competition from other vegetable oils. Changes in biodiesel policies and energy prices can also affect demand expectations, although the latest data does not establish whether these factors contributed to the reported decline.
For traders, the relationship between production and exports is particularly important. Rising output combined with weaker export demand can increase inventories and place pressure on prices. Conversely, lower production, stronger shipments or falling stocks can help support a recovery.
The performance of competing oils is another useful reference. If palm oil becomes less competitive relative to alternative vegetable oils, buyers may adjust their purchasing decisions, potentially affecting export volumes.
Palm oil trading scenarios
Bearish scenario: Continued selling, particularly alongside rising inventories or weaker export demand, could push prices below recent support and reinforce the negative outlook.
Recovery scenario: Stronger exports, tighter supply or evidence of falling inventories could help stabilise prices. A sustained move above recent resistance would provide additional technical confirmation.
Traders should monitor production estimates, export inspections, inventory reports and the relative performance of competing vegetable oils before concluding that the current decline will persist.
Cotton Price Forecast: Modest Weakness Reflects a Market to Watch
Cotton is down 0.70%, a smaller decline than those recorded by rice and palm oil. Although the move is less pronounced, the market remains vulnerable if selling pressure broadens.
Cotton prices depend on crop yields, weather conditions, global stock levels, export demand and the purchasing behaviour of textile manufacturers. The outlook for apparel consumption and industrial activity can influence expectations for mill demand, while changes in production estimates affect the supply balance.
Currency movements can also influence export competitiveness and the cost of cotton for international buyers. However, the supplied figures do not identify a particular demand, supply or currency catalyst behind the latest decline.
The key question is whether cotton is experiencing a limited correction or beginning a more sustained move lower.
Cotton trading scenarios
Bearish scenario: A confirmed break below recent support, accompanied by weakening export demand or higher supply expectations, would strengthen the downside case.
Recovery scenario: Improved export sales, supportive crop developments or a sustained move above recent resistance could indicate that the market is stabilising.
Traders should pay particular attention to export sales, crop-condition reports, production forecasts and changes in global textile demand.
Bullish Sentiment
- Potential value buying in rice: A sharp decline can attract buyers if prices reach levels considered attractive relative to expected supply and demand. This remains conditional on market confirmation.
- Palm oil supply risks: Any evidence of lower production, stronger exports or falling inventories could challenge the bearish outlook.
- Cotton demand recovery: Stronger textile activity or improved export sales could provide support for cotton prices.
- Potential technical rebounds: If selling pressure weakens and prices recover above recent resistance, short-covering or renewed buying could support a corrective move.
- Weather-related uncertainty: Adverse weather affecting crop production can tighten supply expectations and support prices, depending on the affected region and crop stage.
Bearish Sentiment
- Rice leads the declines: The 2.08% fall makes rice the weakest performer in the supplied snapshot and raises the risk of further technical selling if support breaks.
- Palm oil falls nearly 2%: The 1.96% decline indicates significant short-term weakness, although the underlying catalyst remains unconfirmed.
- Cotton also trades lower: The 0.70% decline shows that the negative price action extends across all three reported agricultural commodities.
- Potential supply pressure: If current or upcoming production exceeds demand, inventories could rise and weigh on prices.
- Weak purchasing activity: Reduced export demand or delayed buying by importers could leave prices vulnerable, particularly if sellers compete for market share.
- Technical momentum risk: Continued lower highs and lower lows could encourage trend-following selling if confirmed by current charts.
Agricultural Commodities Technical Analysis and Price Forecast
The latest changes indicate a negative short-term bias across rice, palm oil and cotton. Rice and palm oil have experienced the larger declines, while cotton’s move is comparatively modest.
However, the supplied snapshot does not include absolute prices, recent trading ranges or indicator readings. Exact support and resistance levels cannot therefore be established reliably from these percentage changes alone.
Rice: Technical outlook
Bias: Bearish based on the reported move.
- Downside confirmation: A decisive break below the latest swing low could indicate that sellers remain in control.
- Recovery signal: A sustained move above recent resistance could suggest that the decline is losing momentum.
- Key indicators: Price structure, trading volume, export demand and changes in supply expectations.
Palm oil: Technical outlook
Bias: Bearish based on the reported move.
- Downside confirmation: Continued lower highs and lower lows, particularly with a break below support, would strengthen the negative outlook.
- Recovery signal: A recovery above the recent breakdown area could indicate a corrective rebound.
- Key indicators: Export performance, production estimates, inventory levels and competing vegetable-oil prices.
Cotton: Technical outlook
Bias: Mildly bearish based on the reported move.
- Downside confirmation: A break below recent support could extend the decline.
- Recovery signal: A sustained move above resistance, supported by improving momentum, would weaken the bearish case.
- Key indicators: Export sales, crop conditions, production forecasts and textile demand.
RSI and MACD can help traders assess momentum, while moving averages may provide additional trend context. Current readings are not available, so no specific overbought, oversold or crossover signals can be confirmed.
Technical conclusion: Rice and palm oil warrant the closest attention because they have recorded the largest declines. Cotton is also weaker, but its smaller move requires further confirmation before concluding that downside momentum is accelerating.
Market Outlook for the Coming Sessions
Agricultural commodity prices are under pressure across rice, palm oil and cotton, but the next move will depend on the individual fundamentals of each market.
Rice is the leading decliner, making export demand, production estimates and policy developments particularly important. Palm oil traders should focus on the balance between output, shipments and inventories. Cotton traders should monitor crop conditions, export sales and the outlook for textile consumption.
The key developments to watch are:
- Whether rice prices stabilise or break below recent support.
- Whether palm oil exports and inventory data confirm or challenge the latest decline.
- Whether cotton export demand improves or deteriorates.
- Whether fresh production estimates change expectations for global supply.
- Whether current chart patterns confirm a continuation of the bearish price action.
Overall outlook: Short-term sentiment is bearish across the three reported agricultural commodities, led by rice and palm oil. A sustained recovery would require stronger evidence from market fundamentals and technical price action, rather than a brief rebound alone.
Currency Hedger View
Agricultural price volatility can affect the procurement costs, inventory values and sales margins of food importers, commodity traders, processors, textile manufacturers and other businesses exposed to agricultural markets.
For businesses purchasing or selling commodities internationally, foreign-exchange movements can create an additional source of uncertainty. A change in the commodity price and an adverse exchange-rate move can combine to alter the final cost of a purchase or the value of expected sales receipts.
Currency Hedger encourages businesses to identify their actual commercial exposure, including commodity type, volume, contract pricing, settlement currency and payment timing. Commodity-price and foreign-exchange risks should be assessed together where relevant, while recognising that they are separate risks and may require different management approaches.
Explore Currency Hedger or open an account to discuss your business’s currency exposure and risk-management requirements.
Disclaimer: This article is for informational and educational purposes only and does not constitute investment advice or a recommendation to buy or sell any financial instrument. Agricultural commodity markets can be volatile and may involve substantial losses. The outlooks described are conditional assessments based on the supplied percentage changes; current prices, technical levels and indicator readings have not been verified against live charts. Any hedging strategy should be assessed against the underlying commercial exposure, financial circumstances and risk tolerance.