S&P 500 — US Large Cap Index
 FTSE 100 — UK Blue Chips
 Euro Stoxx 50 — Eurozone Leaders
 DAX 40 — German Equities
 CAC 40 — French Market Index
 Nikkei 225 — Japan Benchmark
 Hang Seng — Hong Kong Index
 Shanghai Composite — China Mainland
 ASX 200 — Australian Market
 TSX Composite — Canada Index
 Nifty 50 — India Large Cap
 STI Index — Singapore Market
 KOSPI — South Korea Index
 Bovespa — Brazil Equities
 JSE Top 40 — South Africa Index
 IPC Index — Mexico Market

Key takeaways
- US 30-year bond yields reached 5.56%, marking the highest level since 2002.
- Japan’s Nikkei 225 gained over 2%, driven by strong demand for AI-related stocks.
- Crude oil prices eased as Saudi Arabia partially reopened the crucial East-West pipeline.
- Markets await the August PCE data release as the Federal Reserve weighs further policy tightening.
Tuesday’s session brought a further sell-off in the debt market, with the yield on US 30-year bonds reaching its highest level since 2002 (5.56%). Today, on the final day of the quarter, market sentiment is improving noticeably. Asian stock markets are recording their strongest day in three weeks, driven higher by Japan’s Nikkei 225, which has gained over 2% following strong buying in AI and semiconductor shares. The yield on 10-year US Treasuries has pulled back slightly to 5.23%, offering a brief respite to both equities and gold. Attention now turns to today’s publication of August PCE data, the Federal Reserve’s preferred inflation measure.
📈 Equities
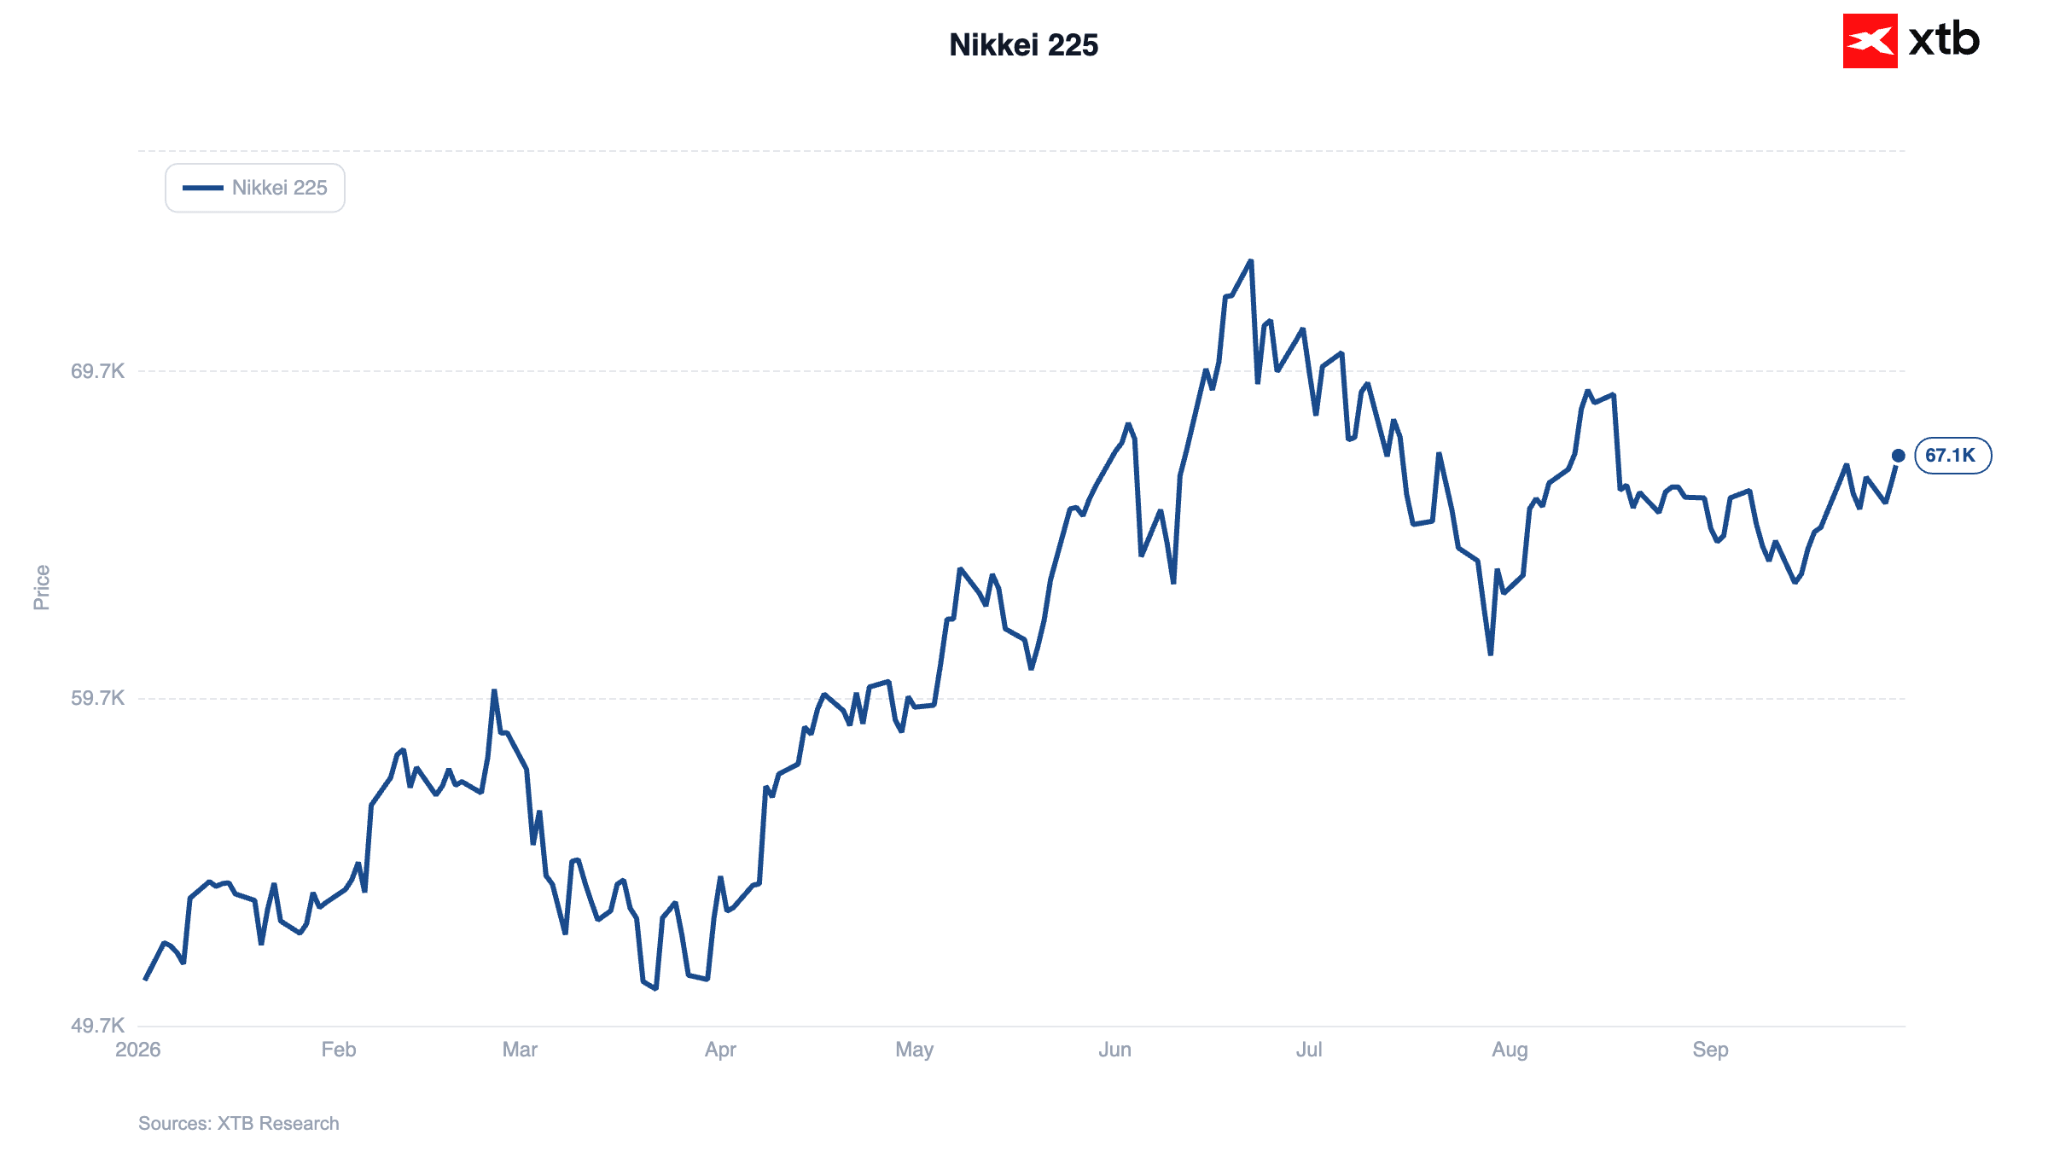
The Tokyo Stock Exchange is enjoying a buoyant session today, with the Nikkei 225 gaining more than 2% and approaching the 67,000 level. Growth is being led by the AI and semiconductor sectors; Tuesday’s gains in the SOXX index spilled over to Tokyo trading, supporting Tokyo Electron (+4.8%), among others. SoftBank Group (+6.4%), an investor in OpenAI, is also advancing strongly. Sentiment has been further bolstered by easing concerns over energy supplies following the restoration of flows through the key Saudi East-West pipeline, leading to a drop in crude oil prices. Figure 1: Nikkei 225 (2026)
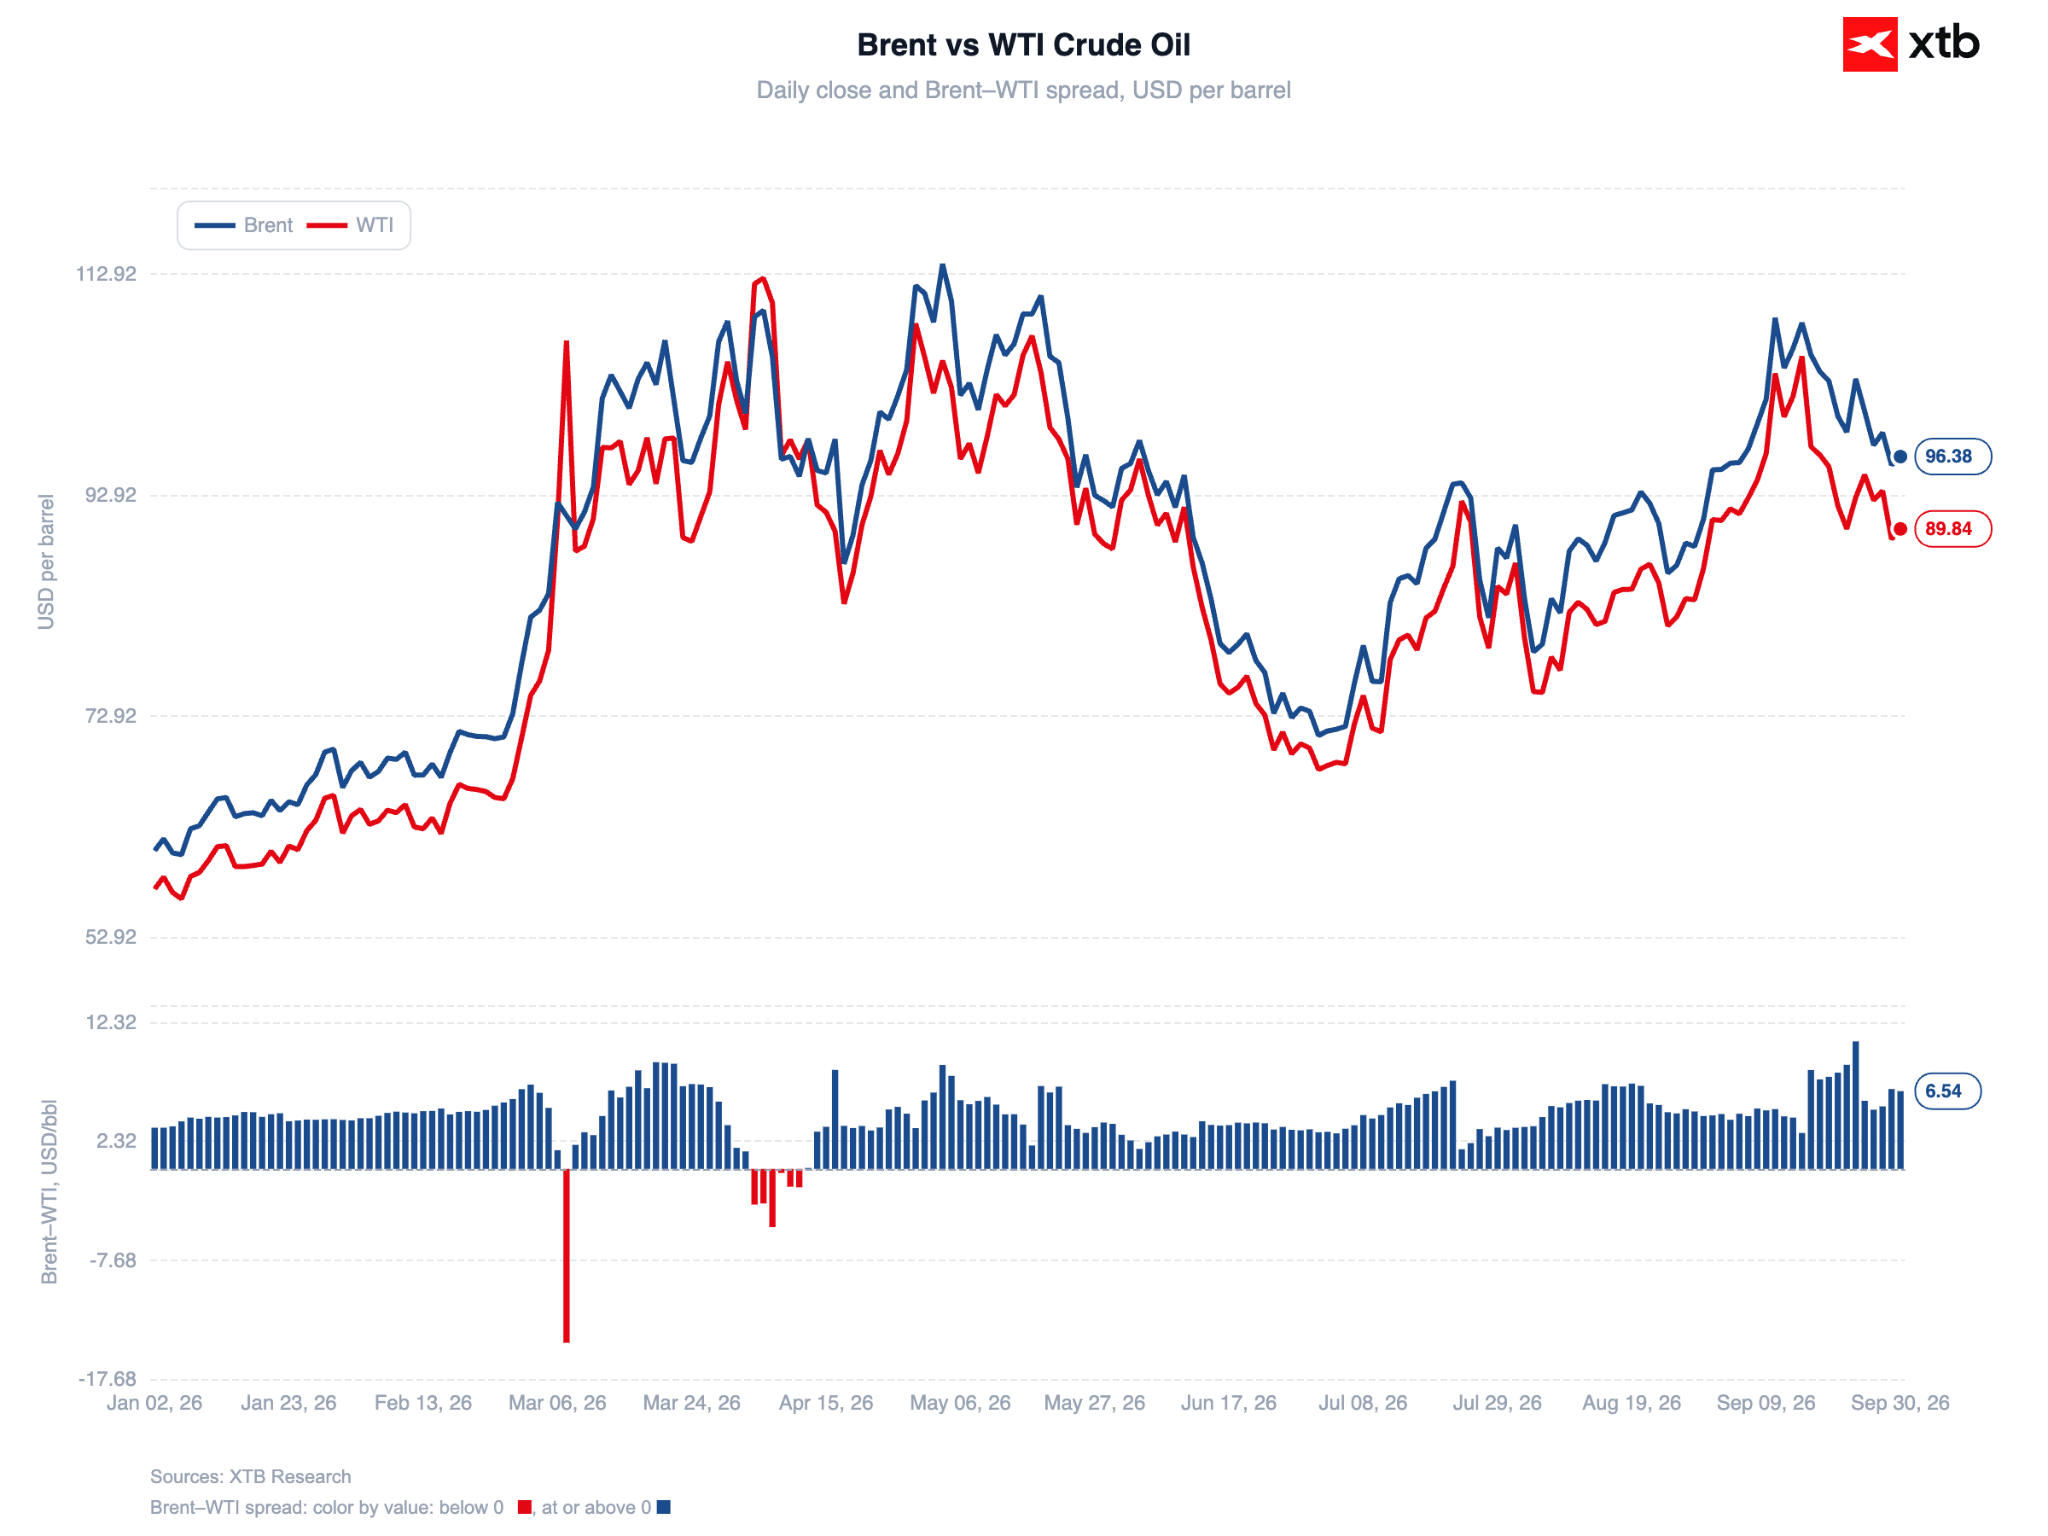
Source: XTB Research, 30.09.2026 Regional optimism has been further enhanced by quarter-end capital flows. Outside Japan, gains were also logged by Taiwan’s Taiex (+1%), Australia’s ASX 200 (+1.1%), and China’s Shanghai SE Composite (+0.5%), the latter supported by solid PMI readings. The Hang Seng remains largely unchanged, whilst South Korea’s Kospi has edged slightly lower (-0.1%). S&P 500 futures are up 0.2%, following Tuesday’s declines triggered by a continued rise in long-term Treasury yields. In corporate news, Anthropic warned in its IPO prospectus that its technology carries “catastrophic or existential risk to humanity”; despite this, the company plans to spend hundreds of billions of dollars on further development. 🛢️ Commodities Crude oil prices are easing following recent gains. Brent is trading at around $96 per barrel, whilst WTI is priced just under $90. Downward pressure followed Saudi Arabia’s partial reopening of the crucial East-West pipeline (restoring roughly half of normal capacity). Separate estimates from JPMorgan and Goldman Sachs suggest Middle Eastern crude exports are returning toward pre-conflict levels, despite ongoing risks to shipping in the region. Nevertheless, Brent remains approximately 70% higher than before the outbreak of the conflict, now in its eighth month. Figure 2: Brent and WTI Crude Oil (2026)
Source: XTB Research, 30.09.2026 Yesterday’s API release indicated a 1m barrel increase in US crude inventories, alongside a build in petrol stocks (+3m barrels) and a draw in distillate supplies (-0.3m barrels).
🪙 Precious Metals
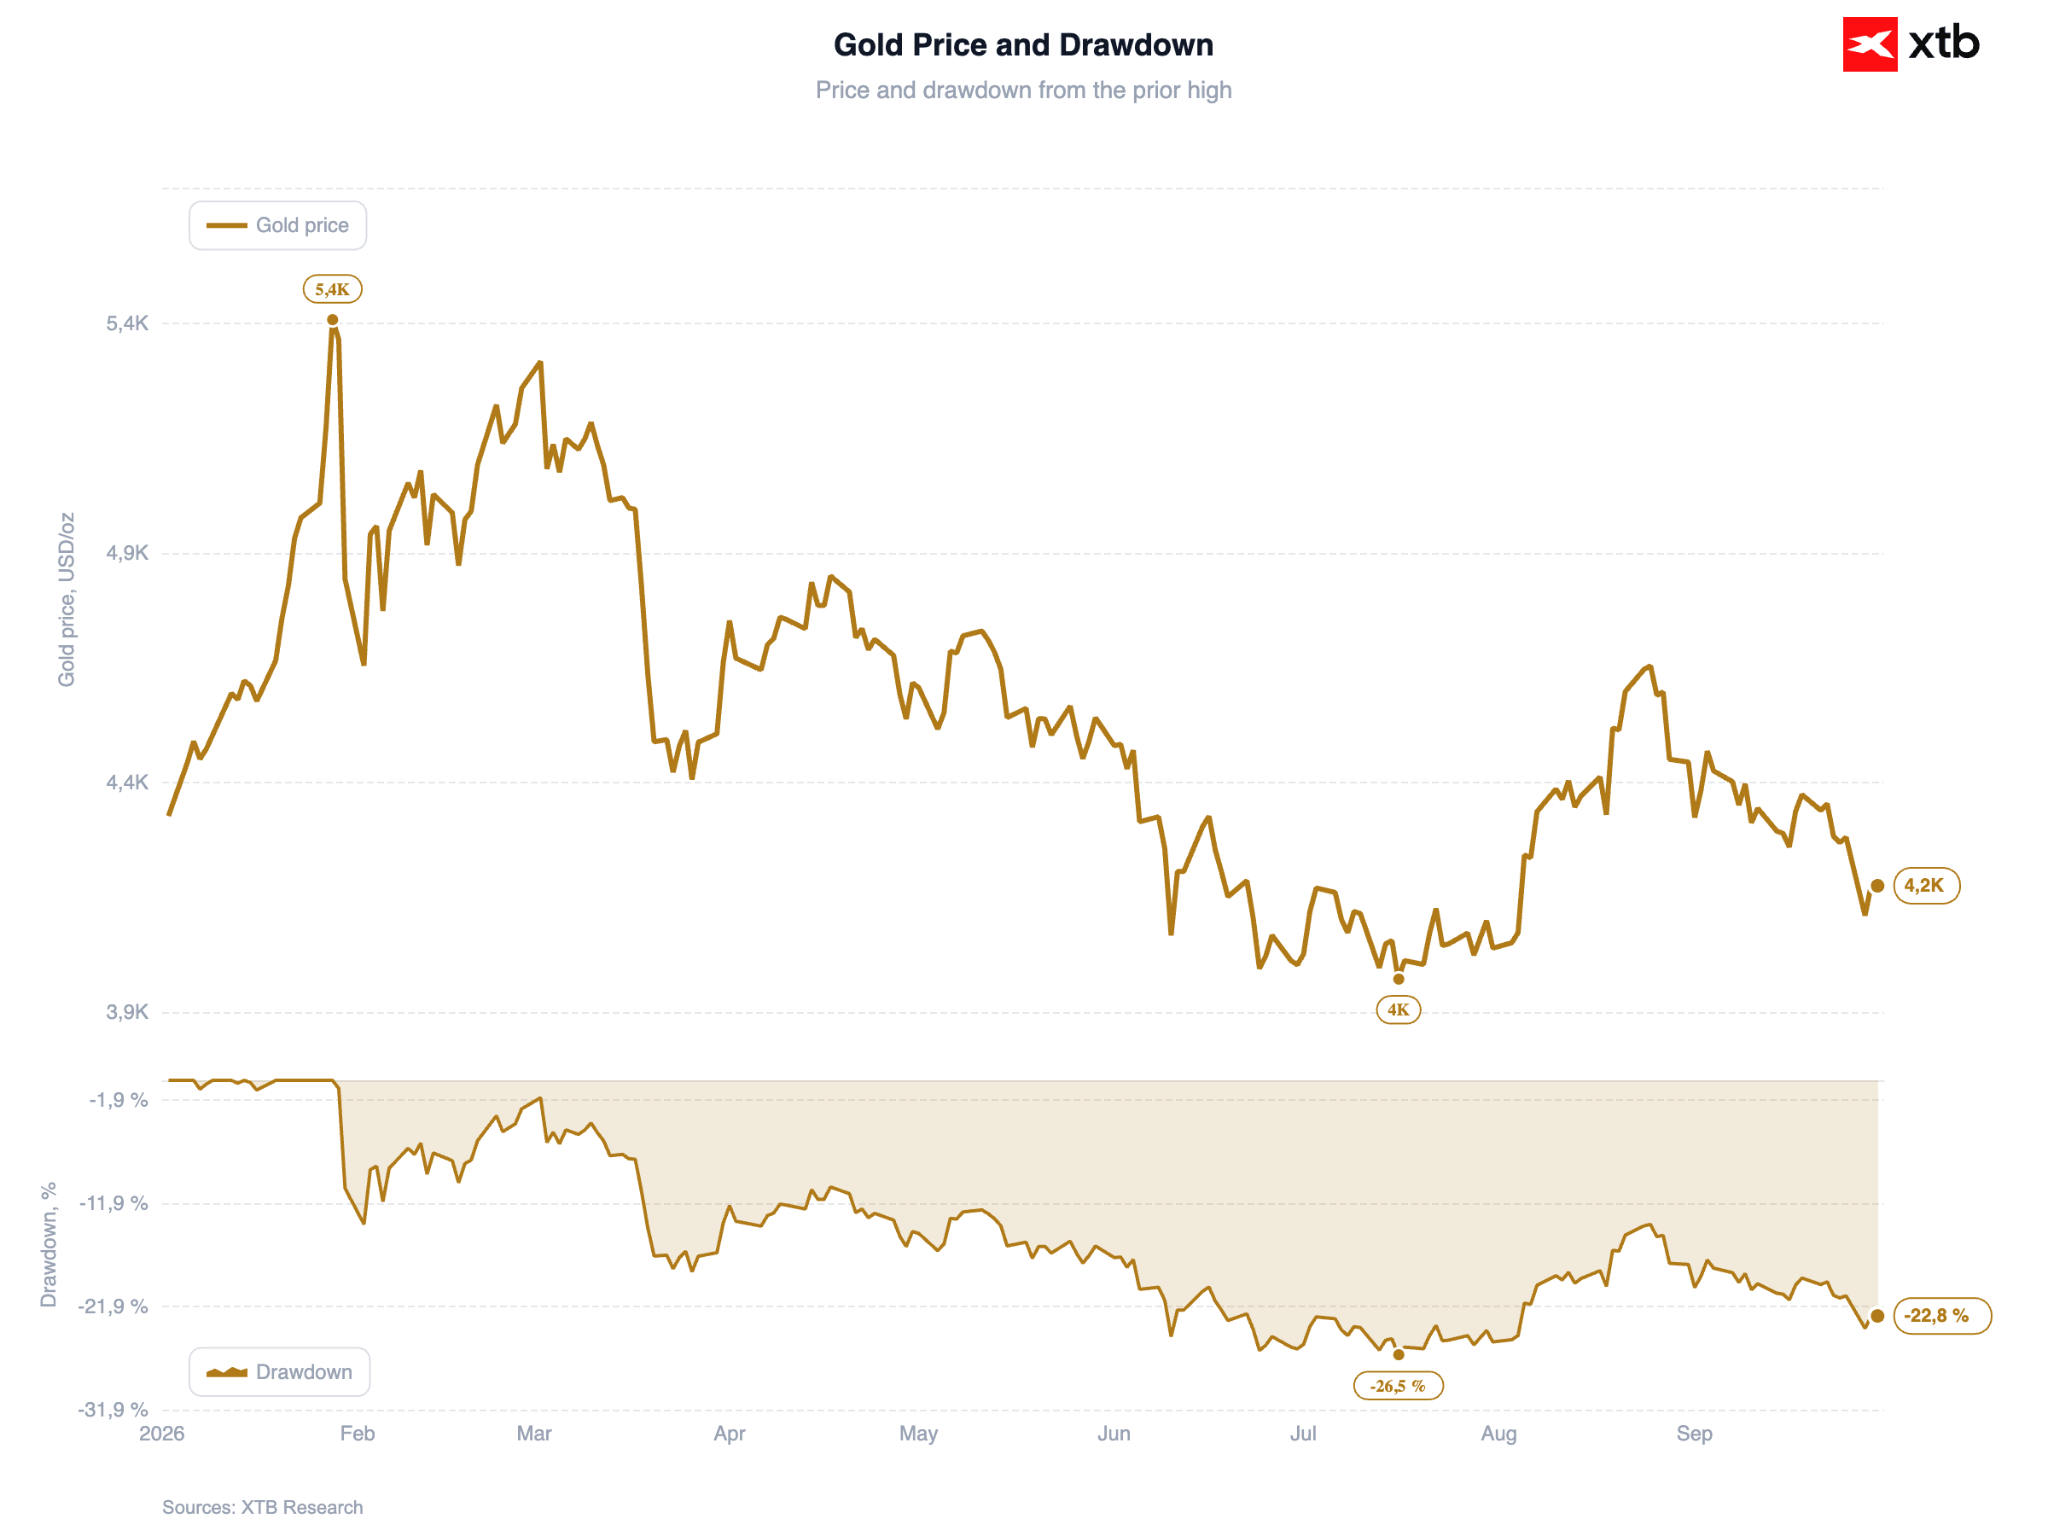
Gold has consolidated around $4,200 per ounce. Modest morning gains were supported by lower oil prices, which alleviated concerns over energy-driven inflation and pulled US bond yields down (30-year yields reached a high of 5.61% yesterday, their highest level since 2002). Figure 3: Gold (2026)
Source: XTB Research, 30.09.2026
📈 Macroeconomic Data and Monetary Policy
Tuesday saw a flurry of speeches from US Federal Reserve officials. The most notable remarks came from John Williams, President of the New York Fed, who suggested another rate hike this year remains probable. Importantly, however, he noted this could happen “later this year”, which, combined with falling oil prices, led markets to scale back bets on an October rate increase (which incidentally occurs just ahead of the US mid-term elections). Figure 4: Market-Implied Policy Path for US Interest Rates (2026 – 2027)
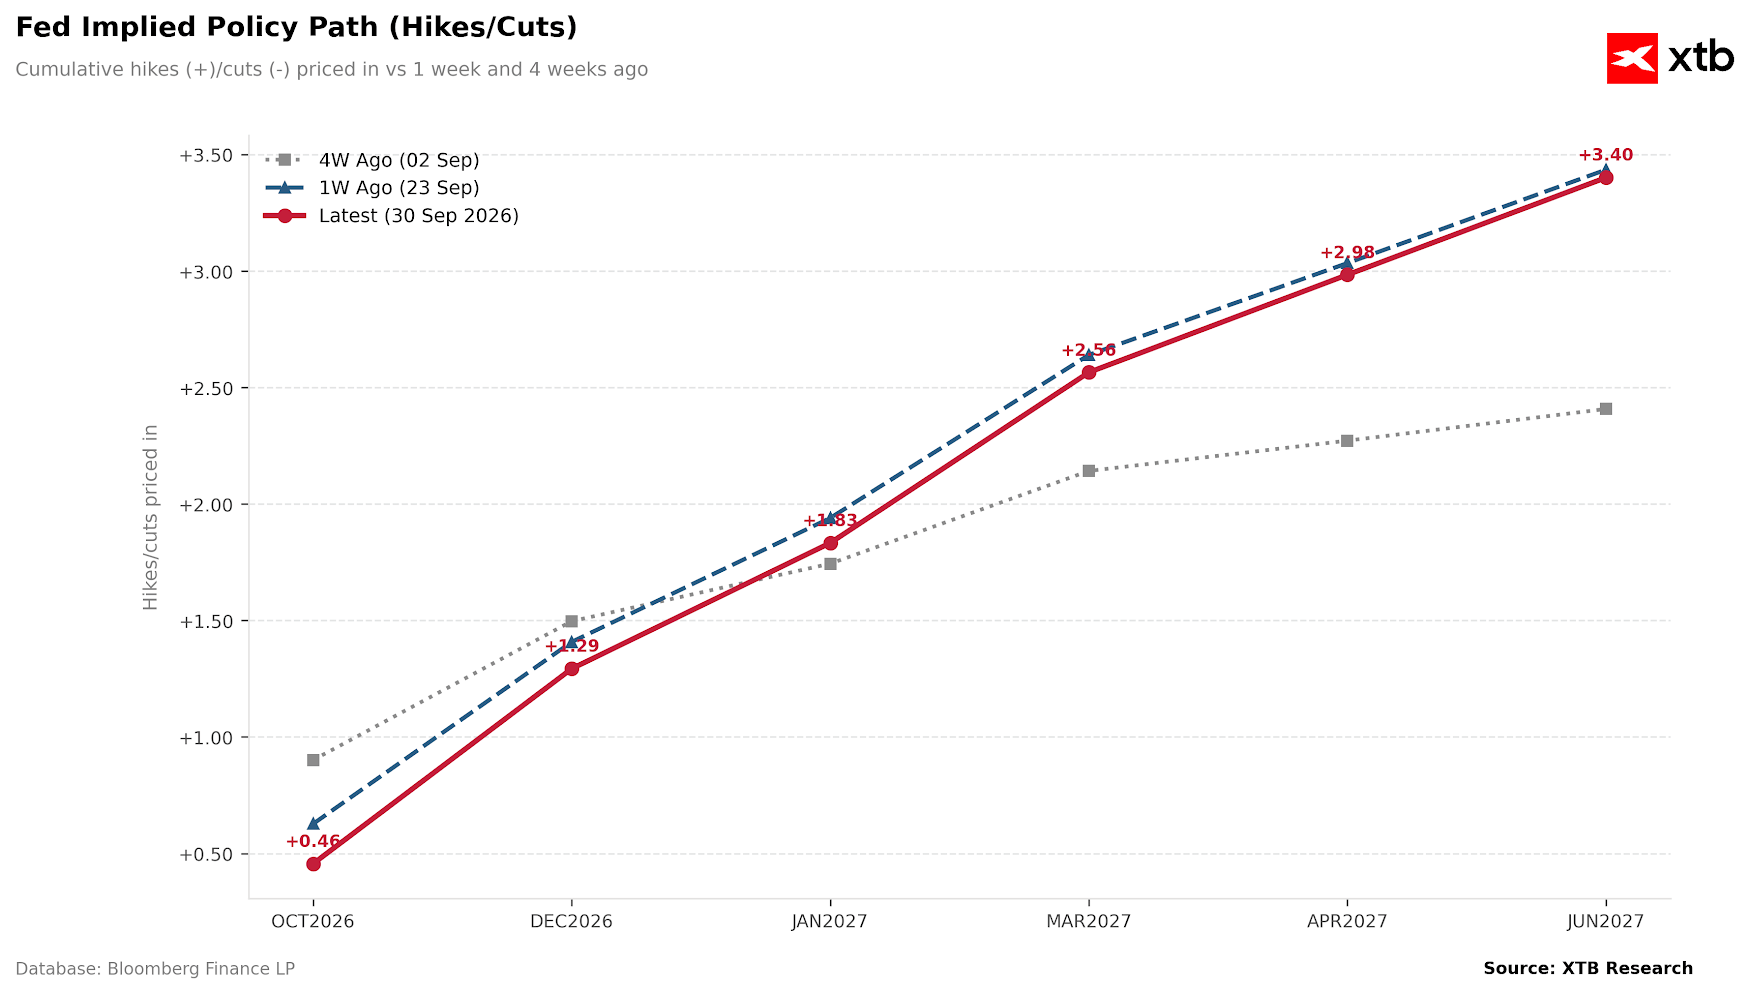
Source: XTB Research, 30.09.2026 NOTE: The trajectory from four weeks ago reflects a lower baseline, i.e. the level prior to the September rate hike. Today’s key focus will be the August US PCE release, the FOMC’s preferred gauge of inflation. Both headline and core readings are expected to accelerate on a monthly basis. An upside surprise would reinforce the Fed’s hawkish stance and bolster the case for further policy tightening. Conversely, a softer reading could undermine the case for a rate hike in October. Looking ahead, Friday brings the crucial NFP US labour market report. Overnight, solid Chinese PMI figures supported the narrative of an economic recovery following earlier government stimulus measures. This stands in contrast to Japan, where industrial production fell for a second consecutive month, reflecting the impact of recent earthquake damage and disruptions linked to the conflict involving Iran. In Australia, September inflation figures surprised to the downside: headline CPI printed at 0.4% m/m (vs 0.5% expected), whilst the RBA’s key trimmed mean core metric slowed to 0.2% m/m from 0.5% previously (vs 0.3% expected). Markets consequently lowered the probability of a November RBA rate hike to around 25%, down from roughly 40% prior to the release. Figure 5: Market-Implied Policy Path for Australian Interest Rates (2026 – 2027)
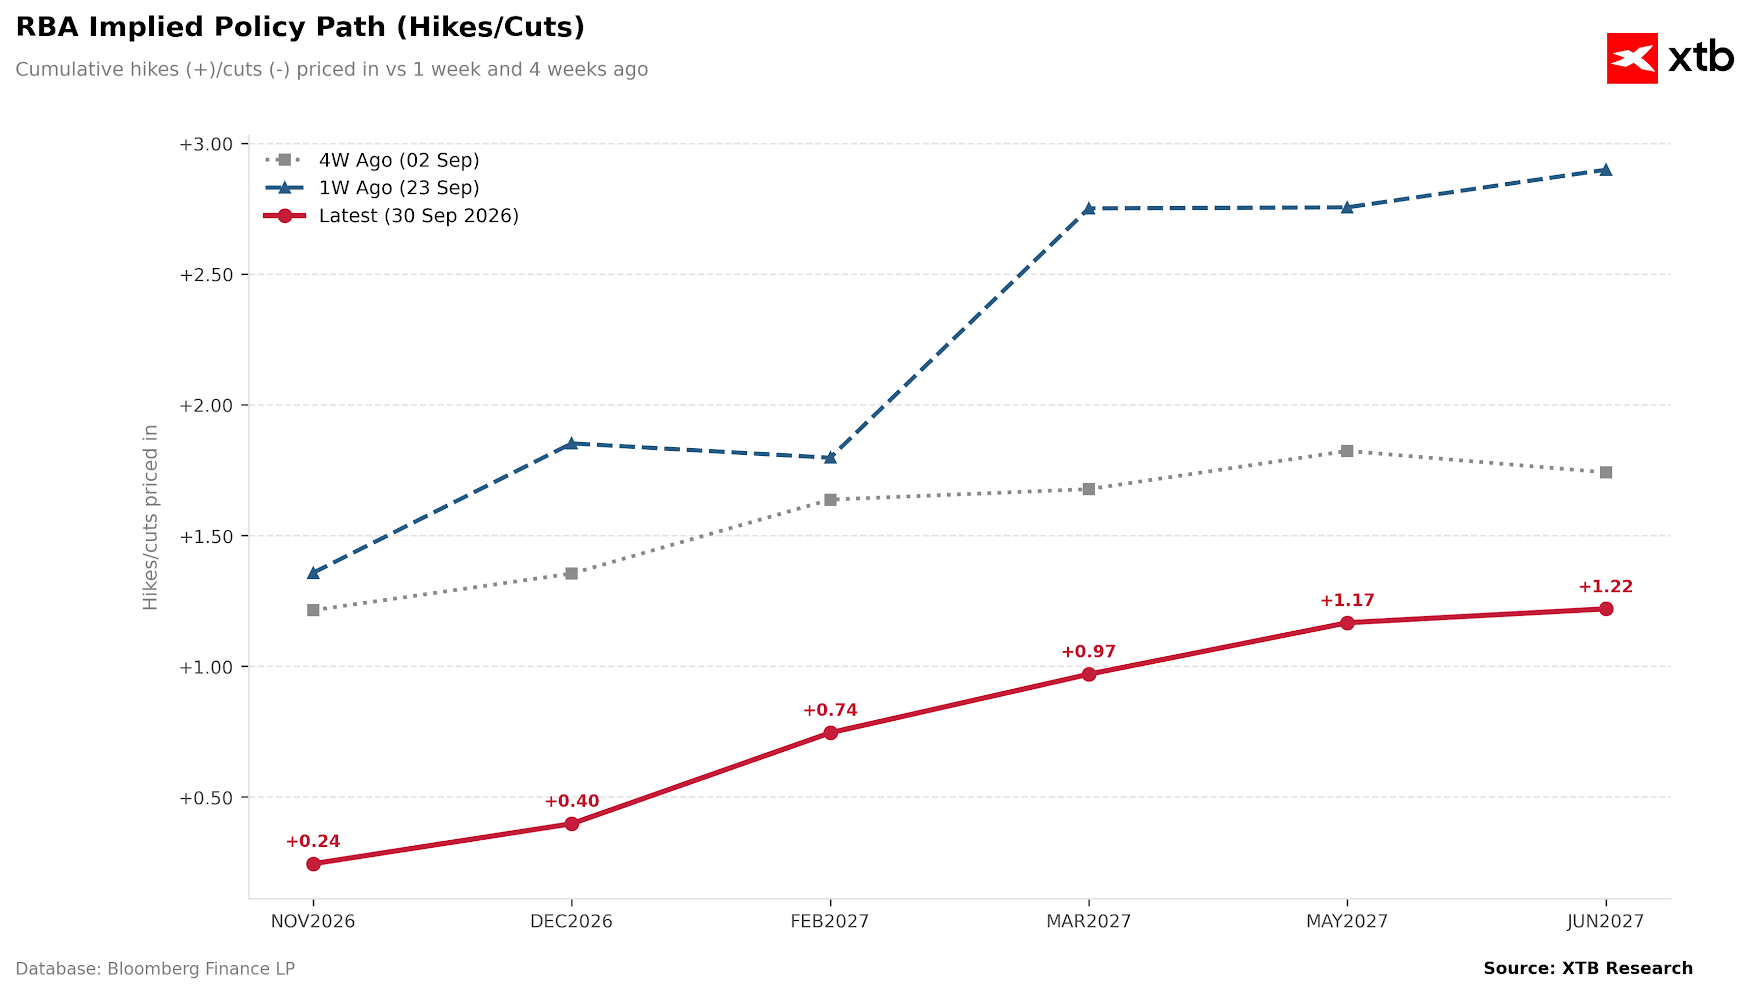
Source: XTB Research, 30.09.2026 NOTE: Trajectories from one week and four weeks ago reflect a lower baseline, i.e. the level prior to the September rate hike.
💱 Currencies
The Japanese yen is strengthening against all G10 peers today, extending gains for a second session, with USD/JPY down 0.3% to 156.8. The movement is largely driven by quarter-end (and Japanese fiscal half-year end) rebalancing flows rather than a shift in fundamentals. Appetite for rebuilding short yen positions was moderated by recent comments from Japanese Finance Minister Katayama, whilst a pullback in US Treasury yields following Williams’ comments provided additional support. Figure 6: Major Currencies Performance vs US Dollar (24.09.2026 – 30.09.2026)
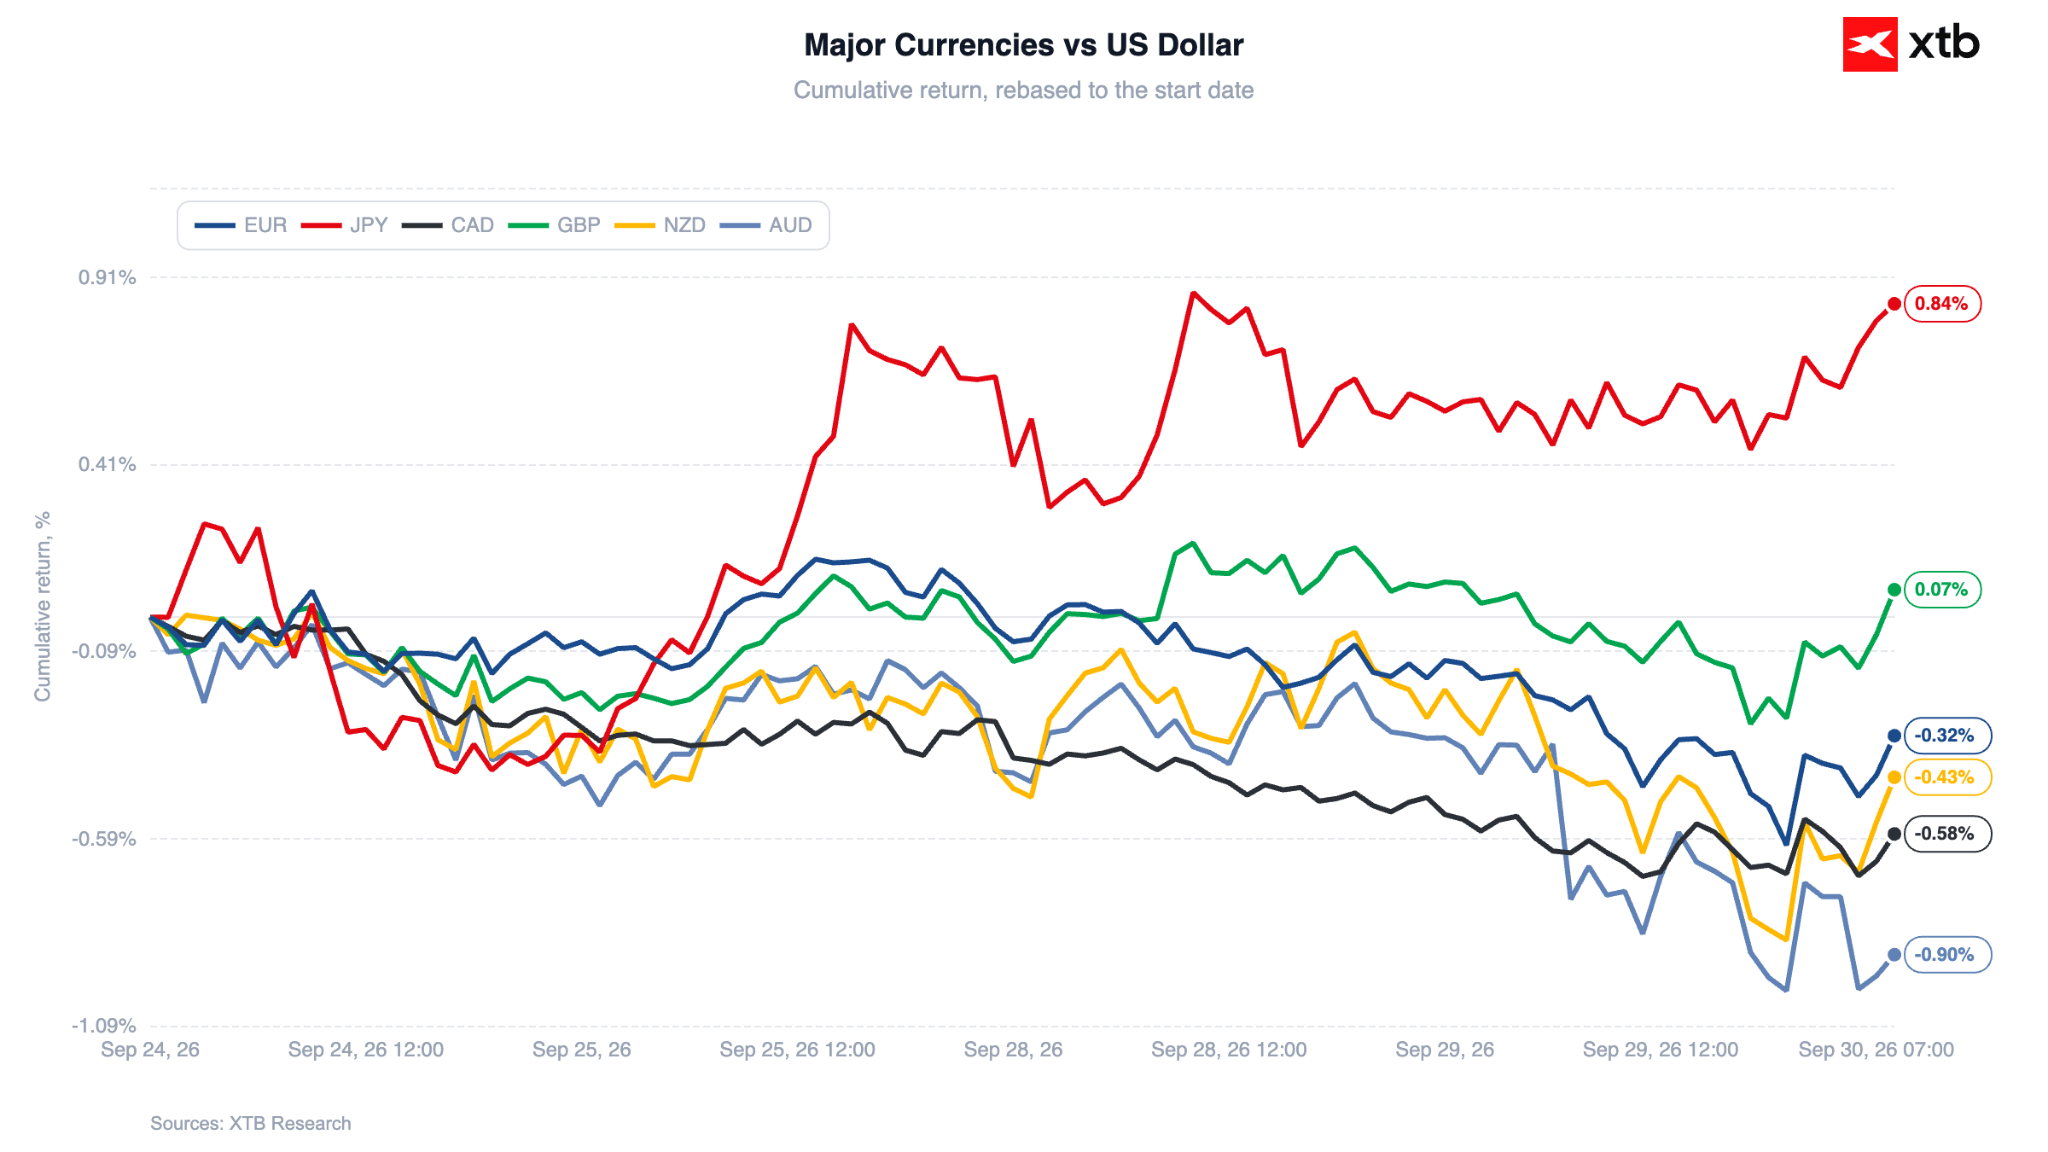
Source: XTB Research, 30.09.2026 Weaker-than-expected Australian inflation data fuelled further selling in the Australian dollar, extending AUD/USD’s three-week decline to over 3%. EUR/USD dipped slightly by 0.1% to 1.133, whilst GBP/USD remains stable near 1.323. Barring any sharp late reversals today, the trade-weighted US Dollar Index is on track to close September with its largest monthly gain since June (+1.6%). ₿ Cryptocurrencies Cryptocurrencies remain under mild pressure. Bitcoin is down 0.5% today to around $83,050, with Ethereum similarly easing to approximately $2,665. Figure 7: Bitcoin (2012 – 2026)
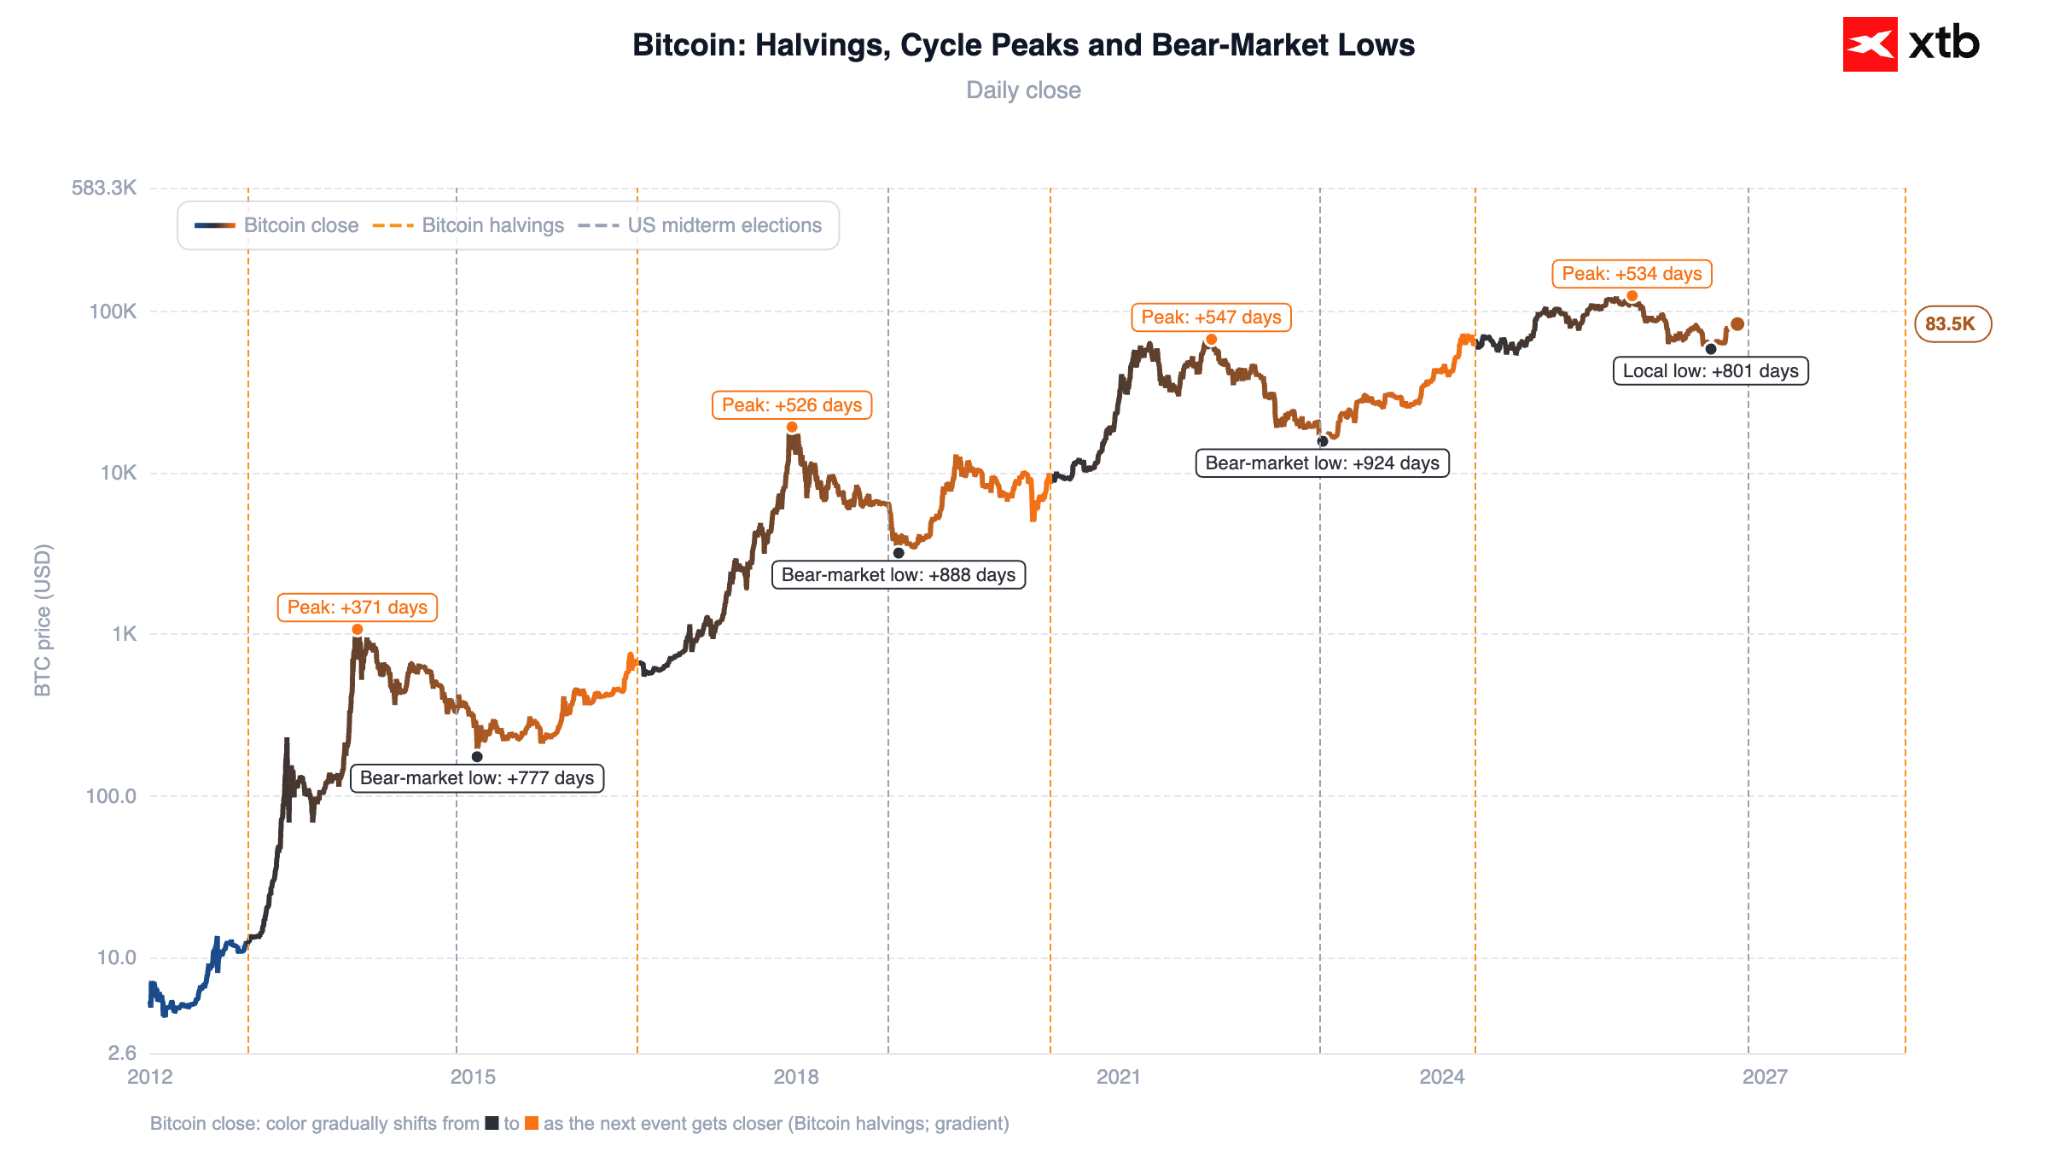
Source: XTB Research, 30.09.2026