S&P 500 — US Large Cap Index
 FTSE 100 — UK Blue Chips
 Euro Stoxx 50 — Eurozone Leaders
 DAX 40 — German Equities
 CAC 40 — French Market Index
 Nikkei 225 — Japan Benchmark
 Hang Seng — Hong Kong Index
 Shanghai Composite — China Mainland
 ASX 200 — Australian Market
 TSX Composite — Canada Index
 Nifty 50 — India Large Cap
 STI Index — Singapore Market
 KOSPI — South Korea Index
 Bovespa — Brazil Equities
 JSE Top 40 — South Africa Index
 IPC Index — Mexico Market


Shares of the Dutch lithography systems manufacturer (ASML) are down more than 6% today, falling to around 1,209 EUR and leading the declines among European companies in the semiconductor and AI sectors. Sentiment is being weighed down today by a global sell-off in tech stocks following Anthropic’s IPO and reports from the U.S. Congress regarding work on the Match Act, which could potentially restrict sales of less advanced lithography machines to China.
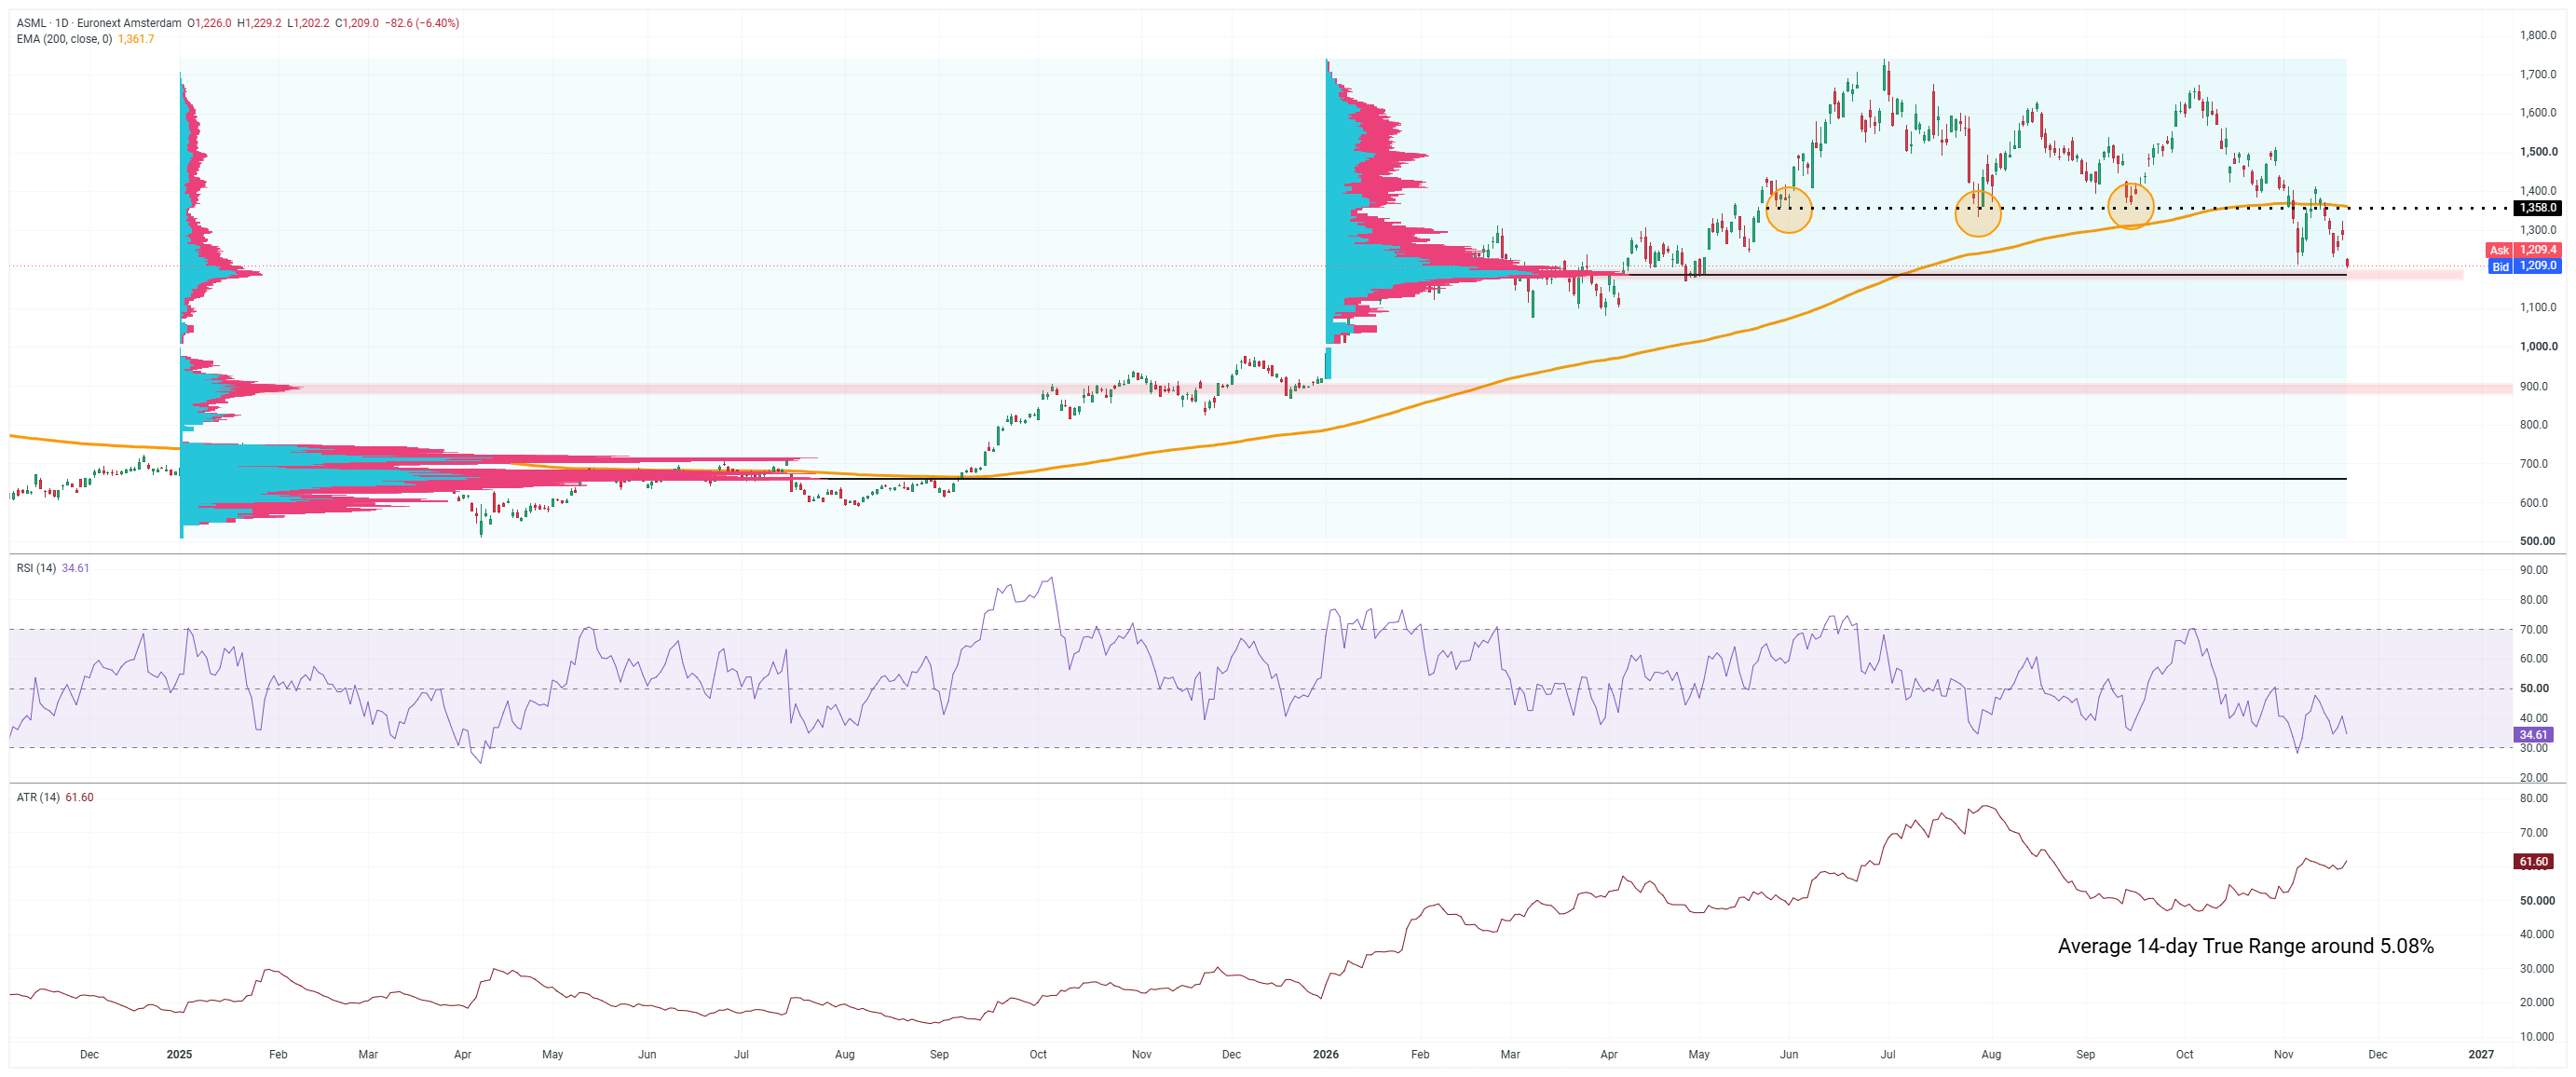
From a technical analysis perspective on the daily (D1) timeframe, the chart pattern has reached a very significant point:
- Breaking Through Resistance: Today’s downward move came immediately after a failed attempt to break back above the key 1356–1362 EUR zone, where the 200-session exponential moving average (EMA 200) converges with a support level that had previously held three times.
- Volume Zone Test: The price has just reached immediate support around 1,180–1,200 EUR , marked by this year’s Point of Control (POC) and the local lows from this spring.
- Momentum and volatility: The RSI (14) indicator fell to 34.6 points , approaching the conventional oversold zone. At the same time, a high ATR (14) of approximately 61.5 EUR (over 5% of daily volatility) indicates heightened nervousness and wide price swings.
Possible technical scenarios:
- Demand scenario: A successful defense of the 1180–1200 EUR volume zone, combined with the RSI indicator nearing oversold territory, could set the stage for a technical rebound. In that case, the first significant resistance level remains the recently broken barrier in the 1356–1362 EUR range (200 EMA).
- Supply-side scenario: A sustained break below the 1,180 EUR level would confirm the sellers’ dominance following the end of several months of consolidation. Given the relatively lower concentration of volume immediately below this level, such a move could accelerate the decline, drawing the market’s attention to a significantly lower support zone around 880–900 EUR (where another volume cluster is visible) and the psychological level of 1,000 EUR .