S&P 500 — US Large Cap Index
 FTSE 100 — UK Blue Chips
 Euro Stoxx 50 — Eurozone Leaders
 DAX 40 — German Equities
 CAC 40 — French Market Index
 Nikkei 225 — Japan Benchmark
 Hang Seng — Hong Kong Index
 Shanghai Composite — China Mainland
 ASX 200 — Australian Market
 TSX Composite — Canada Index
 Nifty 50 — India Large Cap
 STI Index — Singapore Market
 KOSPI — South Korea Index
 Bovespa — Brazil Equities
 JSE Top 40 — South Africa Index
 IPC Index — Mexico Market

Bitcoin, Ethereum, Ripple – BTC rebounds to $82,500 as ETH and XRP hold support


- Bitcoin extends its rebound from the 50-day EMA around $80,607 on Monday, testing a resistance trendline’s breakout near $82,526.
- Ethereum hovers around $2,400, stalling its prevailing decline above the 200-day EMA at around $2,345.
- Ripple hovers around $1.30, below key EMAs, signaling a weak bullish bias.
Bitcoin (BTC), Ethereum (ETH), and Ripple (XRP) show signs of recovery on Monday, following a turbulent week driven by sticky US inflation data and institutional outflows. BTC extends its rebound off the 50-day Exponential Moving Average (EMA) at $80,607, while ETH and XRP test key support levels after a bearish weekly close.
ETF outflows, high US inflation weigh on crypto
The higher-than-expected US Consumer Price Index (CPI) for September came at an annual rise of 3.7% versus market expectations of 3.6%, while the US Producer Price Index (PPI) rose to 6.3% in September, up from the market expectations of 5.3%. Taken together, the data released last week reflect both consumer and producer inflation rising in the US, raising concerns about another rate hike later this year.
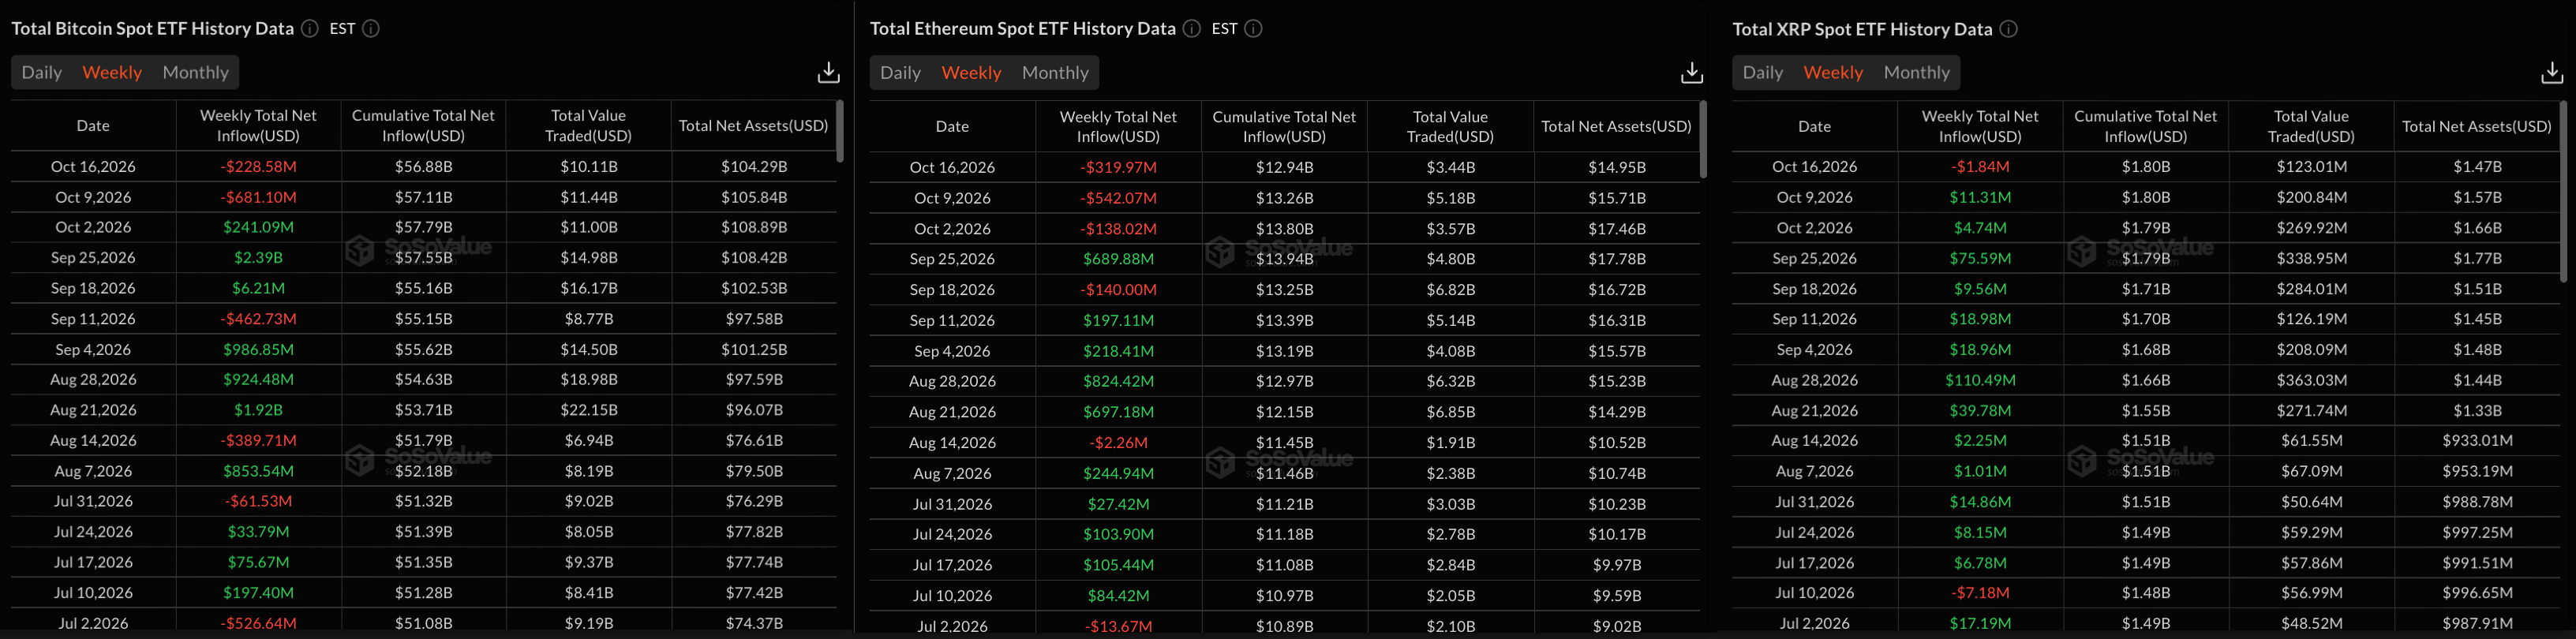
On the other hand, the crypto-focused Exchange Traded Funds (ETFs) witnessed a surge in share redemptions, suggesting increased selling pressure amid elevated inflation risks. Bitcoin ETFs marked their second consecutive weekly outflow of $228 million, down from $681 million, while Ethereum ETFs extended outflows for the third week with $319 million. XRP ETFs broke their 13-week streak of inflows, posting $1.84 million in outflows last week.
Bitcoin lifts off from its 50-day EMA
Bitcoin hovers around $82,488 at press time on Monday, holding above both the 50-day EMA at $80,607 and the 200-day EMA at $76,034, which keeps the broader bias constructive despite nearby overhead levels. The recovery in BTC price is pressing against a downward resistance trend line, with the break level just above at $82,526, while the $85,000 round figure adds to the immediate topside cap.
The Moving Average Convergence Divergence (MACD) remains below its signal line, and the Relative Strength Index (RSI) at 50 is neutral, suggesting a consolidative bullish tone.
A confirmed breakout above the trendline at $82,526 could test the $85,000 mark, which capped bullish attempts last week. An extended recovery above this level could target the previous swing high of $87,395 set on September 21.

On the downside, first support is defined by the 50-day EMA at $80,607, while the 200-day EMA at $76,034 underpins the medium-term trend as long as daily closes remain comfortably above it.
Ethereum holds support near the 200-day EMA
Ethereum holds above $2,400 on Monday, stalling its prevailing corrective phase around its 200-day EMA at $2,345. Still, the price remains capped below the 50-day EMA at $2,483, suggesting a near-term bearish bias within a broader medium-term uptrend.
Momentum on the daily chart suggests sellers have the upper hand in the short run, as the RSI flattens near 40 without entering oversold territory, while the MACD remains negative, reinforcing waning upside pressure.
To reinstate an upward trend, ETH must reclaim its 50-day EMA at $2,483 and the August 21 high at $2,546, which could open the path toward the September 21 peak at $2,807.
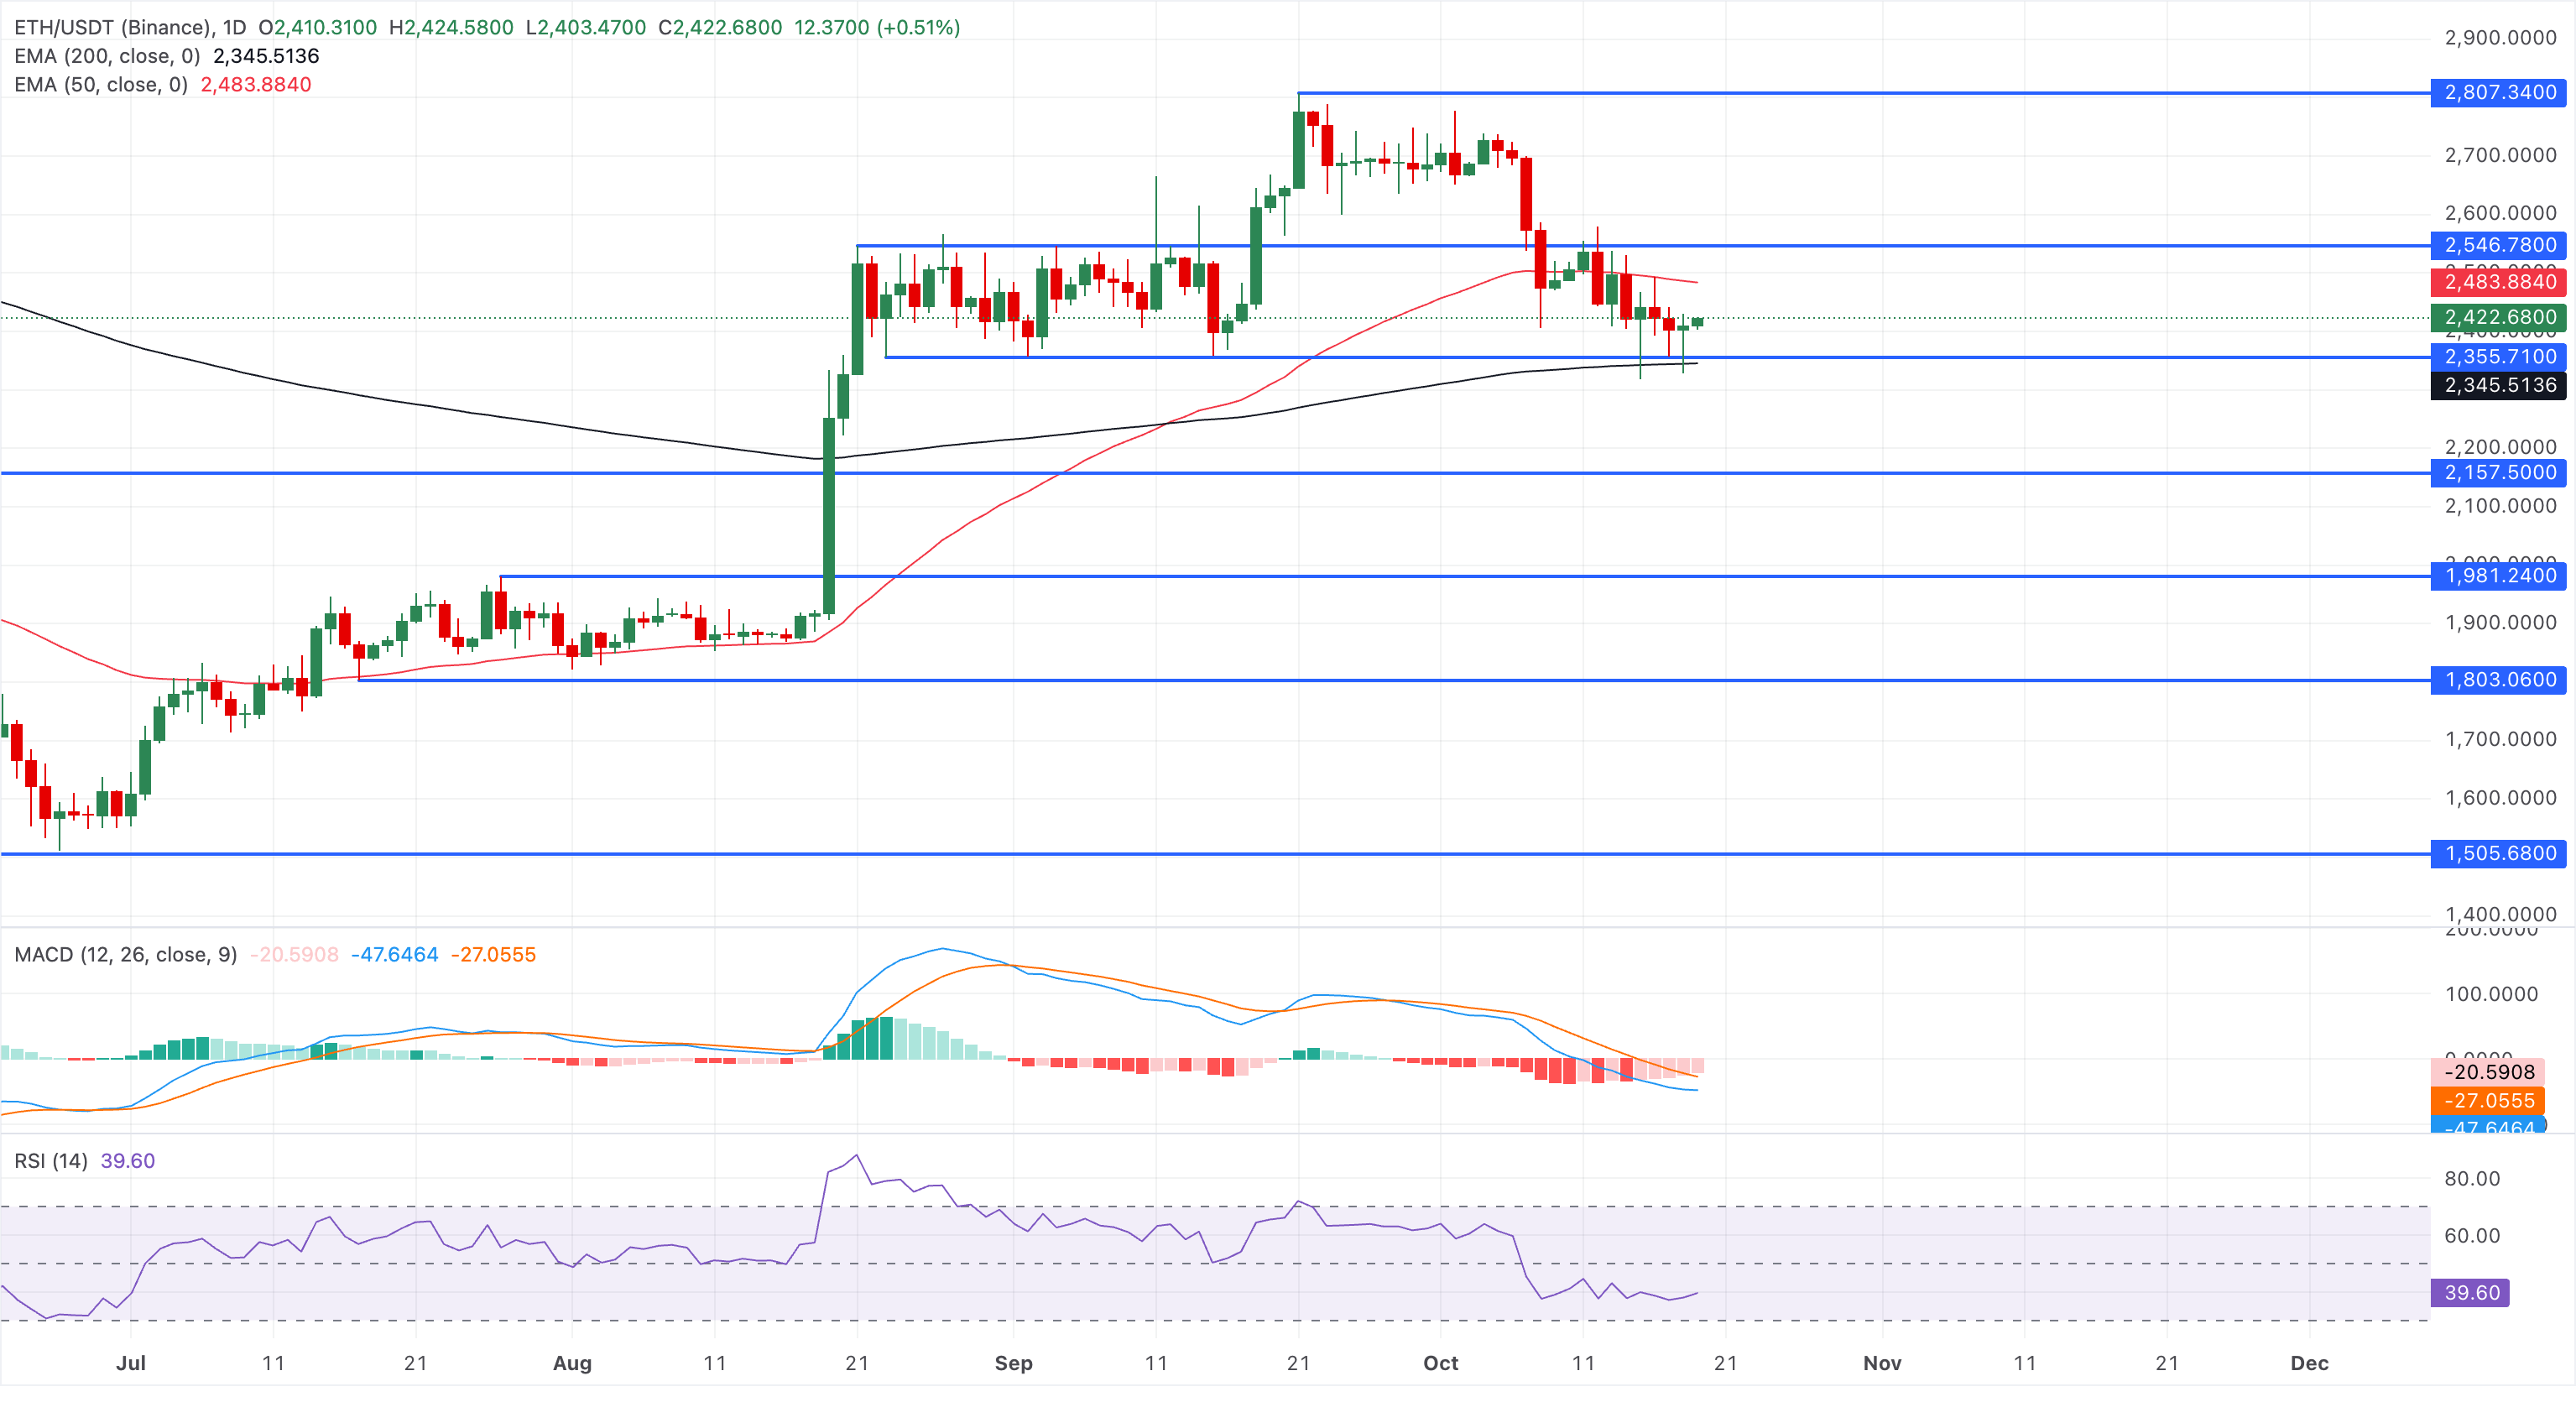
Looking down, the 200-day EMA at $2,345 offers the first significant support zone, and a clear break beneath this level would likely expose the altcoin to the May 21 high at $2,157 and the $2,000 psychological threshold.
XRP stabilizes near key support
Ripple trades at $1.3098 at press time on Monday, extending a bearish near-term tone. The cross-border remittance token holds both the 50-day EMA at $1.3784 and the 200-day EMA at $1.3919.
From a technical perspective, the price has fallen below the former rising trendline of a symmetrical triangle pattern near $1.3528 on the daily chart, suggesting a bearish breakout move. Still, the horizontal support level set by the June 15 high near $1.2941 halted the decline, resulting in Sunday’s rebound. A sustained breakout below $1.2941 could extend the decline toward the June 8 high at $1.1866.
Momentum remains bearish, with the RSI at 37 and the MACD continuing its decline into negative territory.
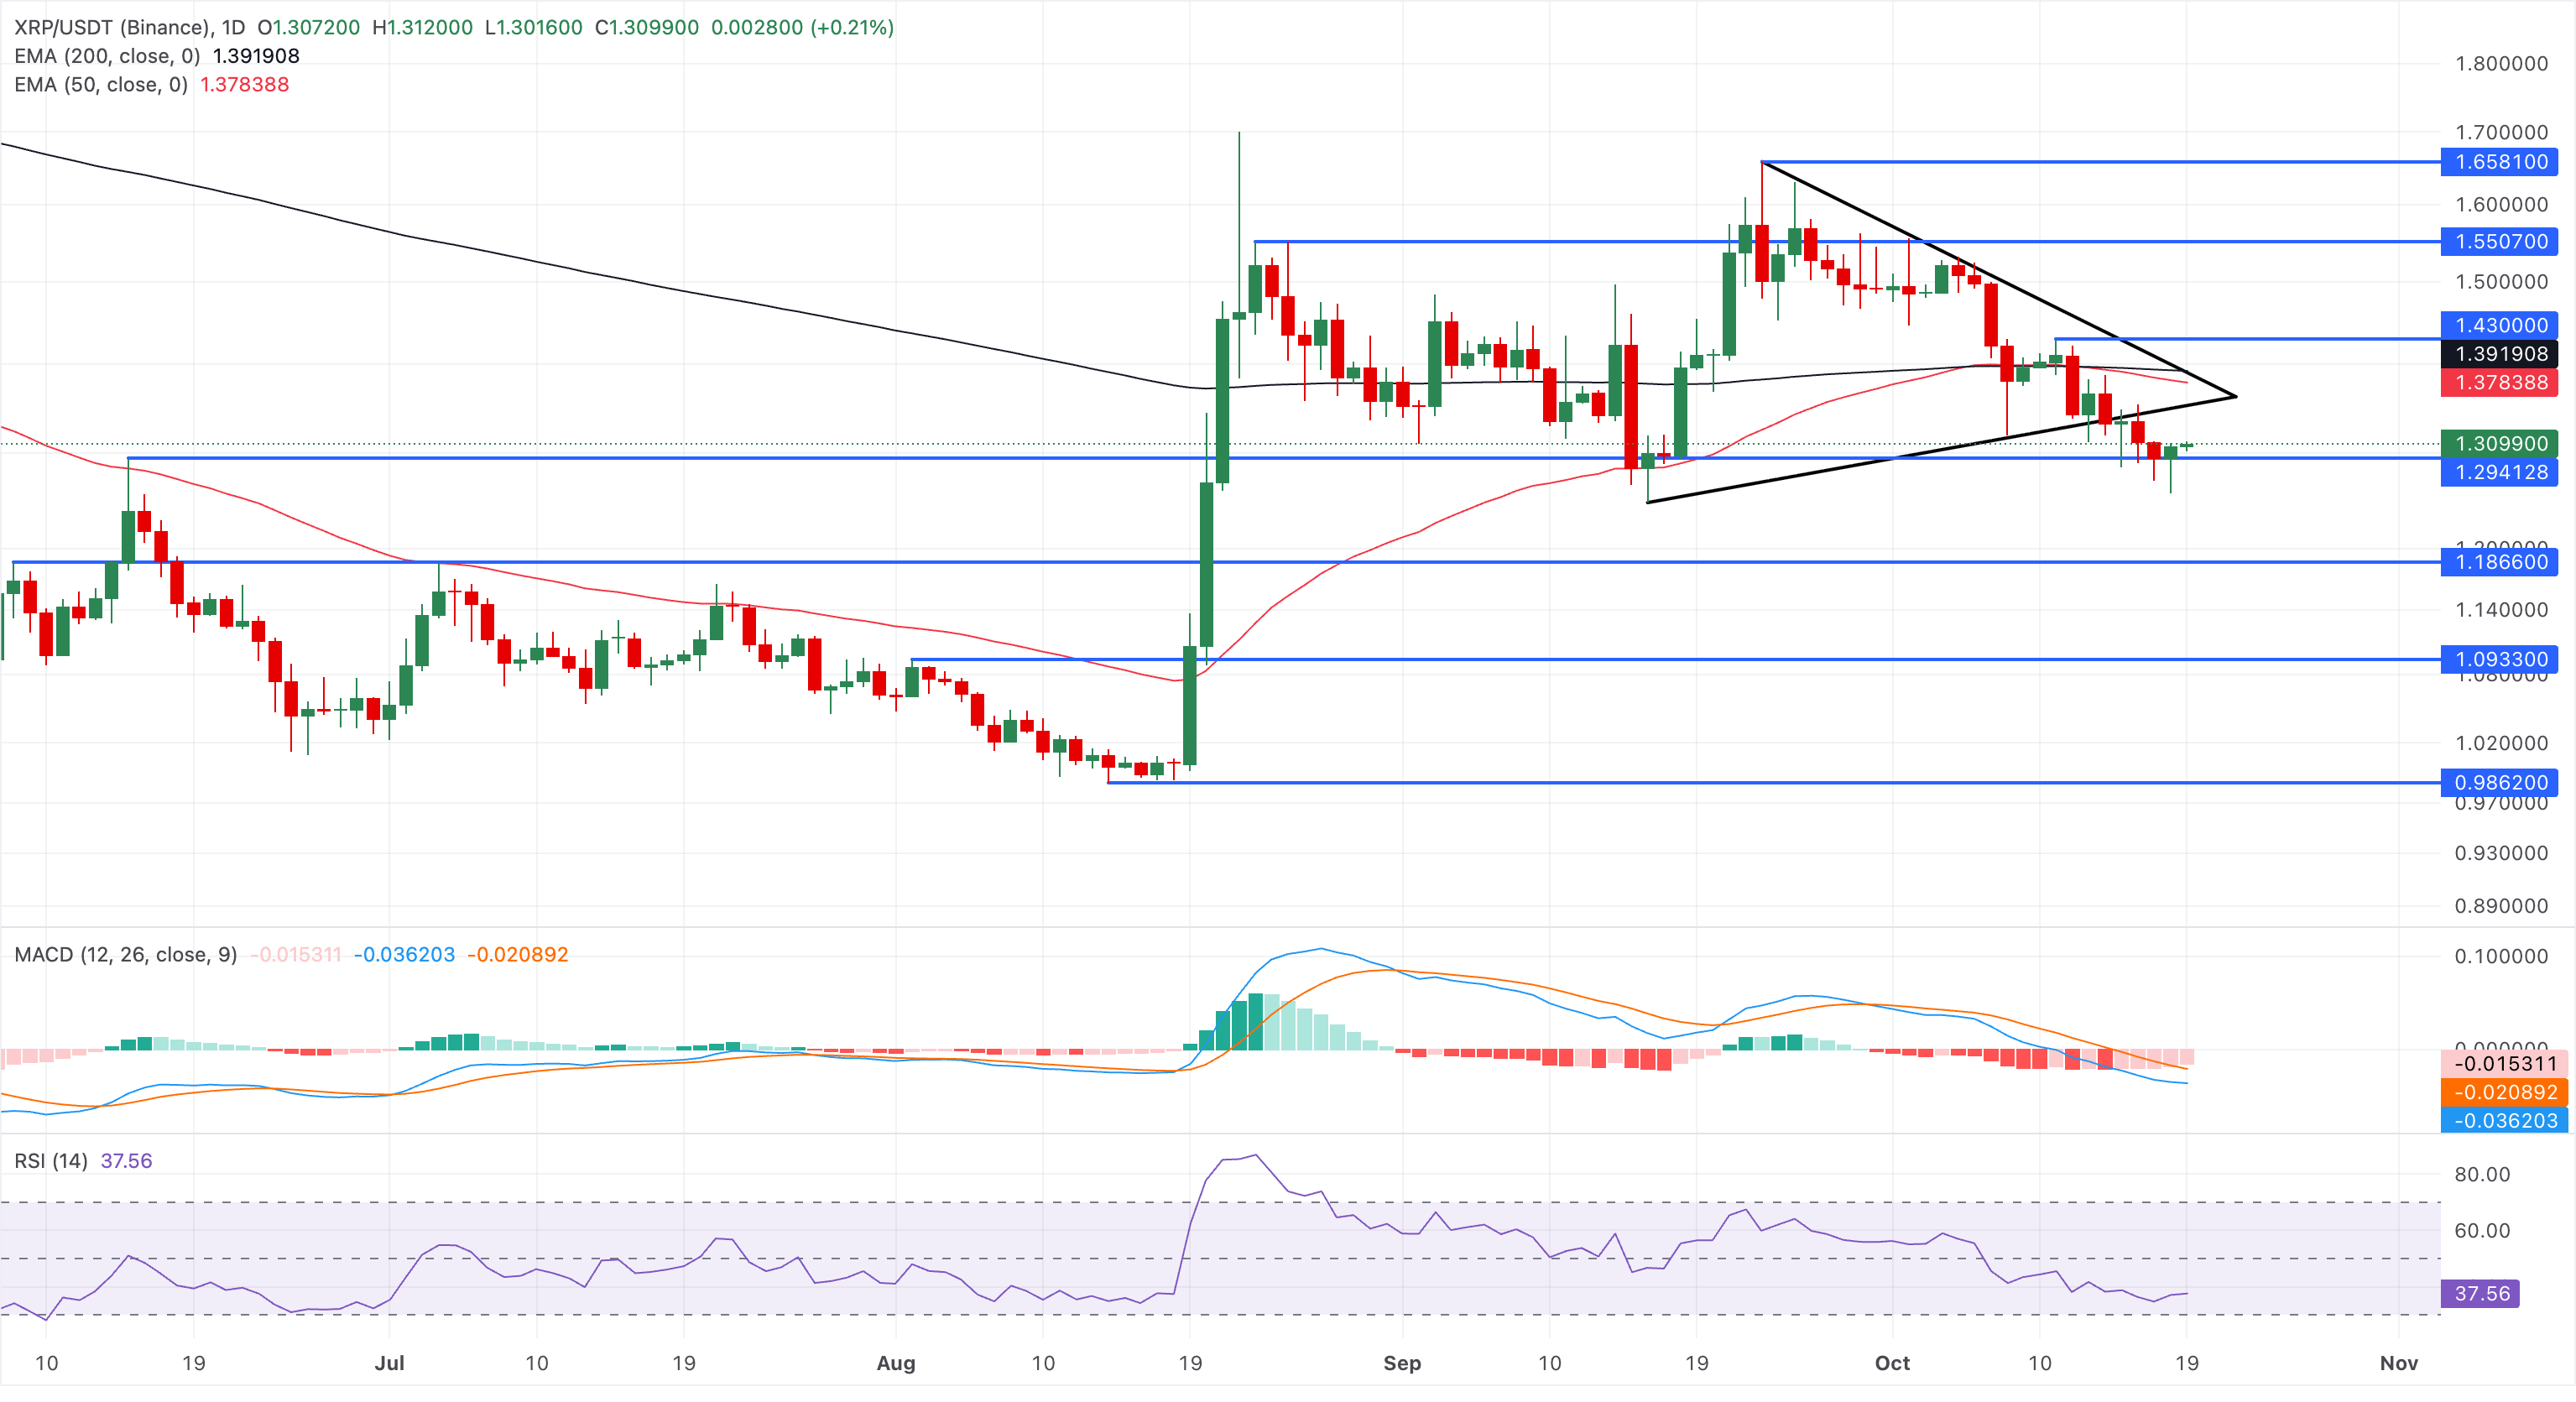
On the topside, initial resistance emerges at the previously broken trendline level near $1.3528, ahead of a tighter supply zone defined by the 50-day EMA at $1.3784 and the 200-day EMA at $1.3919.