BlackRock is selling Bitcoin – BTC falls below $60K. What’s next?

Bitcoin is trading below $60,000 on Monday after losing nearly 6% last week, with the decline driven by weakening market sentiment and a clear withdrawal of institutional capital. U.S. spot Bitcoin ETFs recorded approximately $1.8 billion in net outflows over the past week, leaving cumulative flows for 2026 deeply in negative territory. Particularly heavy redemptions came from BlackRock’s IBIT , a fund previously known for persistent accumulation and minimal selling activity, adding further supply pressure to the market. Until ETF flows stabilize and institutional accumulation resumes, a meaningful recovery in Bitcoin demand may remain difficult. Key takeaways
- Strategy significantly reduced the pace of its Bitcoin purchases, acquiring only around 3,600 BTC during June. The slowdown by one of the largest corporate Bitcoin holders may reflect a more cautious institutional stance.
- Risk reduction continues across the derivatives market. Open interest in Bitcoin futures fell by nearly 2.7% , with the overwhelming majority of liquidated positions being longs , suggesting that excessive bullish positioning is being unwound.
- The Crypto Fear & Greed Index has dropped to 17 , placing it firmly in “Extreme Fear” territory. Historically, readings this low have often accompanied periods of elevated risk aversion, although they have not consistently marked final market bottoms.
- On-chain indicators remain mixed. Large whale wallets have increased accumulation during the recent decline, while some long-term holders have begun realizing losses.
- Bitcoin continues to be heavily influenced by macroeconomic conditions. A stronger U.S. dollar and expectations that interest rates will remain elevated continue to weigh on demand for risk assets.
- From a technical perspective, $60,000 remains the key support level. A sustained recovery above this threshold could improve short-term sentiment, while the next major support sits near $58,000 .
Demand remains the missing ingredient
Broad-based capital has yet to return to the market. The clearest feature of the current environment is the contrast between selective accumulation and the absence of widespread buying interest. While some investors—particularly in the U.S.—have started buying the dip, institutional investors remain cautious, and short-term holders continue to create a significant supply zone between $67,000 and $71,000 . Until Bitcoin reclaims that range, any rally is more likely to be viewed as a technical rebound than the beginning of a sustained trend reversal. The options market paints a similarly cautious picture. Traders have increasingly shifted toward selling option premium instead of purchasing downside protection, suggesting expectations for relatively subdued volatility. Meanwhile, market makers continue to hold significant long gamma exposure between $60,000 and $64,000 , a positioning that tends to dampen volatility around current prices. However, it has not prevented Bitcoin from slipping below $60,000, and if that level is not quickly reclaimed, downside momentum could accelerate.
Macro events remain the key catalyst
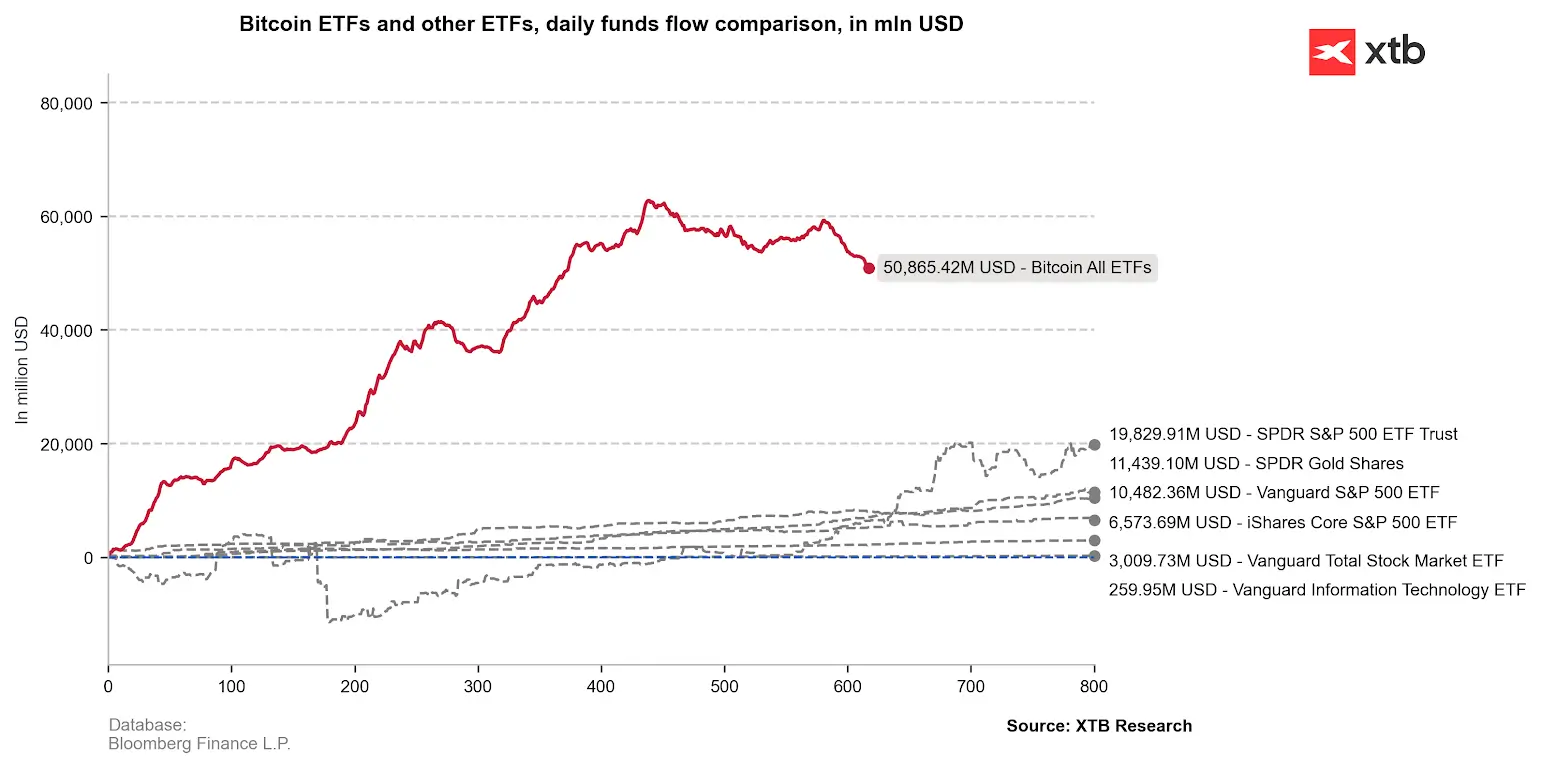
This week, Bitcoin is likely to react not only to incoming U.S. economic data but also to Kevin Warsh’s speech at the ECB’s annual forum in Sintra, Portugal , where markets will once again assess how hawkish or dovish the Federal Reserve’s policy outlook may become. Meanwhile, cumulative net inflows into U.S. spot Bitcoin ETFs have declined to just under $51 billion , down from roughly $62 billion during the peak of the 2025 bull market. Bitcoin has entered a phase where an increasing number of valuation indicators suggest more attractive pricing. However, cheap valuations alone are not enough to reverse the prevailing trend. The market continues to struggle with loss realization, persistent ETF outflows, and defensive positioning in the options market.
Source: XTB Research, Bloomberg Finance L.P.
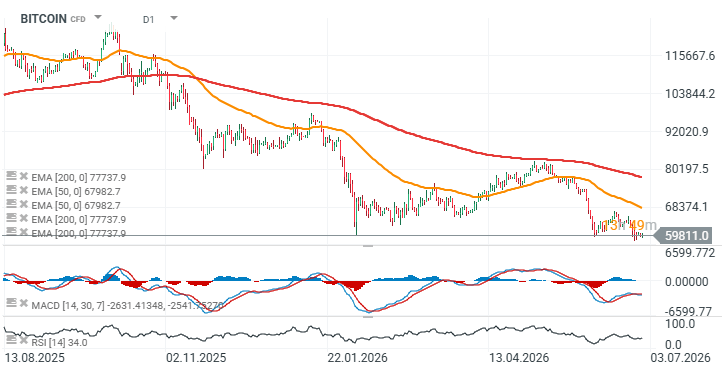
Bitcoin technical outlook (Daily chart) Bitcoin is currently trading nearly 30% below its 200-day exponential moving average (EMA200) , represented by the red line on the chart. The Relative Strength Index (RSI) is approaching oversold territory, although it does not yet indicate a full market capitulation. If another wave of heavy selling develops, Bitcoin could decline toward the $45,000 area. On the upside, a recovery above $68,000 , where the 50-day EMA (EMA50) currently sits, could signal renewed buying momentum. The next major resistance zone is located between $77,000 and $80,000 , reinforced by both the EMA200 and previous price reactions.
Source: xStation5
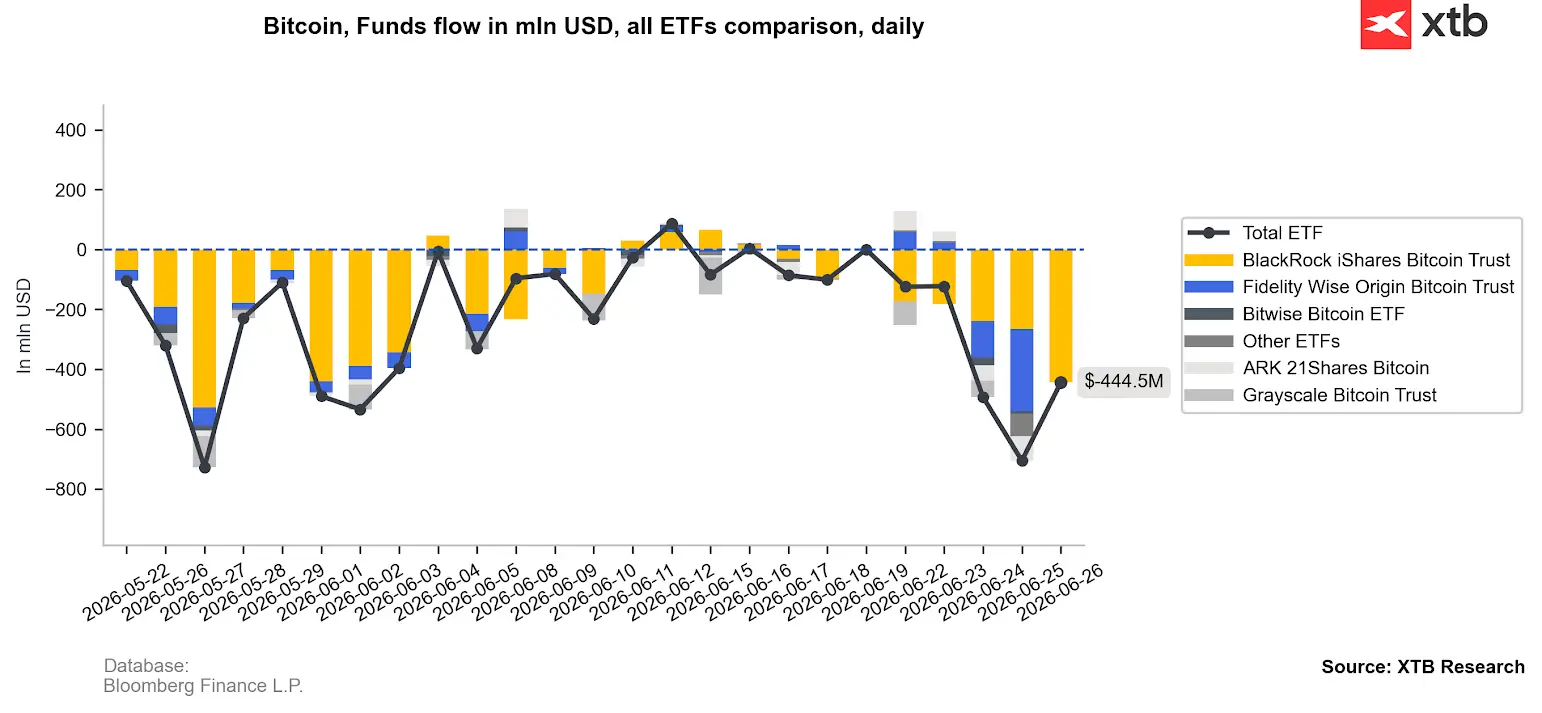
ETF selling remains the market’s biggest concern Selling by spot Bitcoin ETFs has become one of the cryptocurrency market’s most significant headwinds. BlackRock sold approximately $444 million worth of Bitcoin on Friday , while Fidelity Investments has also contributed to the recent wave of selling pressure. Investors continue to price in the risk of tighter U.S. monetary policy. Combined with the ongoing rally in AI-related equities and the substantial amount of retail liquidity absorbed by the SpaceX IPO , the result is an environment characterized by limited demand and weaker speculative interest in Bitcoin.
Source: XTB Research, Bloomberg Finance L.P.
Source: XTB Research

الربح
الجميع يسارعون إلى خفض التكاليف. أما نحن، فنسرع نحو تحقيق الأرباح.
ابدأ البيع من خلال تقديم الخدمات