S&P 500 — US Large Cap Index
 FTSE 100 — UK Blue Chips
 Euro Stoxx 50 — Eurozone Leaders
 DAX 40 — German Equities
 CAC 40 — French Market Index
 Nikkei 225 — Japan Benchmark
 Hang Seng — Hong Kong Index
 Shanghai Composite — China Mainland
 ASX 200 — Australian Market
 TSX Composite — Canada Index
 Nifty 50 — India Large Cap
 STI Index — Singapore Market
 KOSPI — South Korea Index
 Bovespa — Brazil Equities
 JSE Top 40 — South Africa Index
 IPC Index — Mexico Market

- XRP holds $1.35 support, reflecting a cautious outlook among investors as US “self-defense” strikes on Iran threaten a potential peace deal.
- XRP faces cooling derivatives demand, with futures Open Interest averaging $2.85 billion.
- The SuperTrend indicator reinforces dynamic support at $1.33, but XRP’s upside remains capped below major moving averages.
Ripple (XRP) rebounds above $1.35 at the time of writing on Tuesday, as crypto prices broadly struggle to stabilize amid volatility driven by spillover pressure from escalating Middle East tensions.
US-Iran peace negotiations face headwinds
The United States (US) military launched strikes on Southern Iran around the Strait of Hormuz on Monday, with officials describing the attacks as “self-defense,” designed to protect troops from threats posed by Iranian forces.
US Centcom spokesperson Captain Tim Hawkins said in a statement that the strikes were meant to “defend our forces while using restraint during the ongoing ceasefire.”
Meanwhile, Iran’s Islamic Revolutionary Guard Corps (IRGC) said in a statement on Tuesday that the country has a “legitimate and definite” right to defend itself against US ceasefire violations.
The attacks occurred ahead of the planned talks between Iran’s negotiators, Foreign Minister Abbas Araghchi and Qatar’s Prime Minister in Doha on Tuesday to finalize the memorandum of understanding (MoU) between the US and Iran.
Despite the strikes, US Secretary of State Marco Rubio told reporters during his visit to India that a peace deal was still possible, according to a BBC report.
“We’ll see if we can make progress. I think it’s a lot of talking back and forth going on about specific language in the initial document, so it’ll take a few days,” Rubio said.
XRP retail demand cools
Interest in risk assets, including XRP, has softened as hopes for an imminent US-Iran peace deal shrink. CoinGlass data shows the futures Open Interest (OI) averaging $2.85 billion on Tuesday, up slightly from $2.83 billion the previous day.
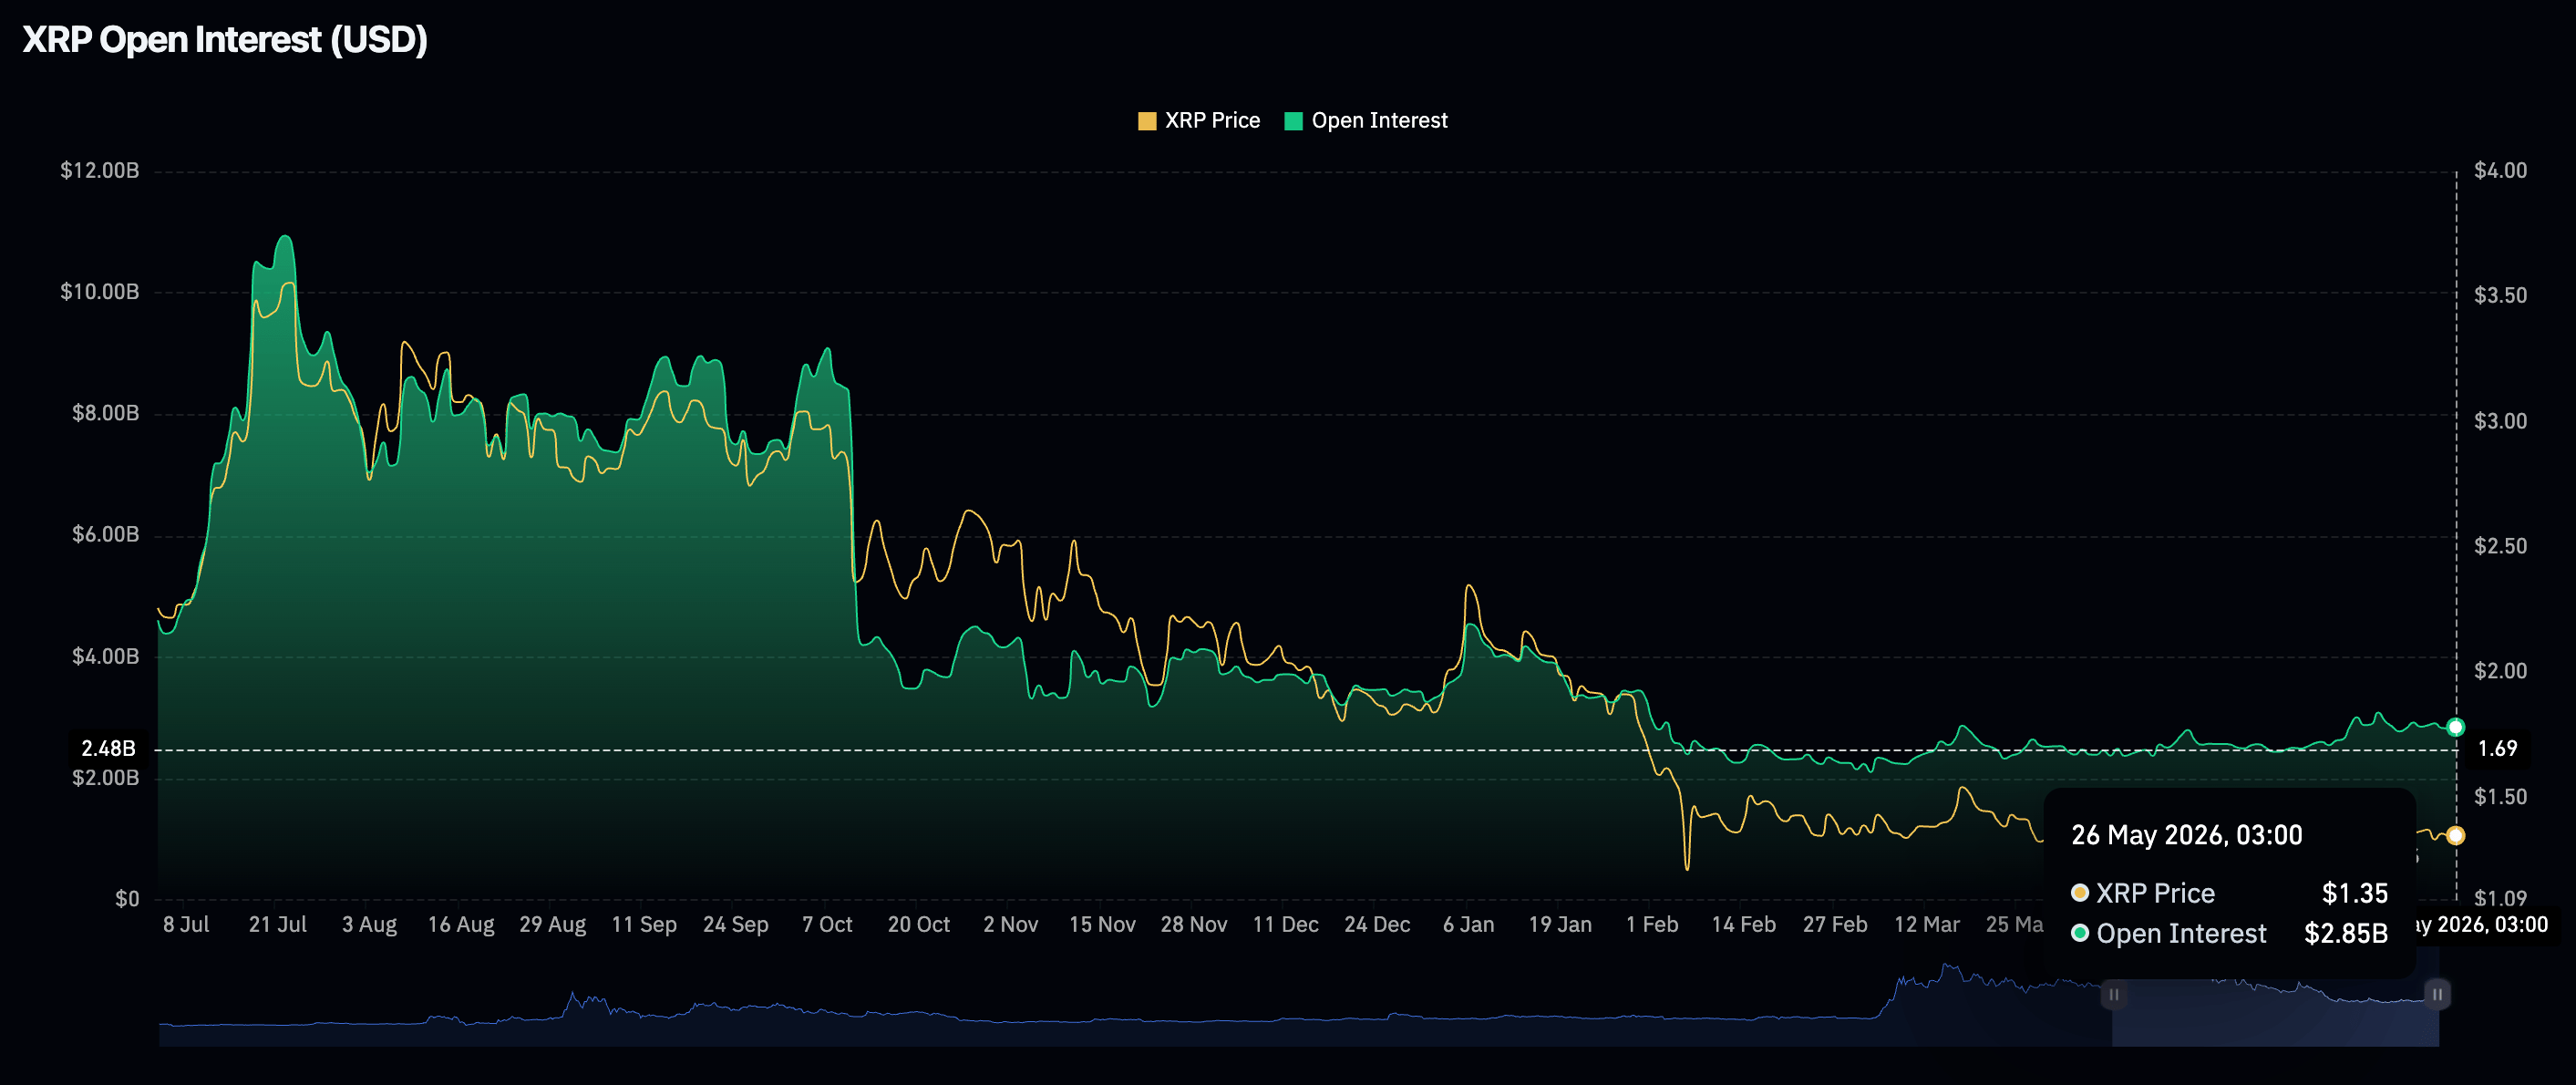
The OI remains relatively subdued, following the brief spike above $3 billion in mid-May and the record high of $10.94 billion in July. This indicates that investors are not confident in XRP’s short-term bullish outlook and are unwilling to open new positions, leaving the token vulnerable to broader crypto market volatility.
Price analysis: XRP tests key support
Bitcoin trades above $1.35, holding a bearish near-term bias as price consolidates below a stack of key Exponential Moving Averages (EMAs), with the 50-day EMA at $1.40, the 100-day EMA at $1.47 and the 200-day EMA at $1.68 all acting as overhead supply.
Momentum readings are subdued, with the Relative Strength Index (RSI) hovering around 43 on the daily chart, while the negative Moving Average Convergence Divergence (MACD) contracting downside histogram hint that bearish pressure persists but is not accelerating.
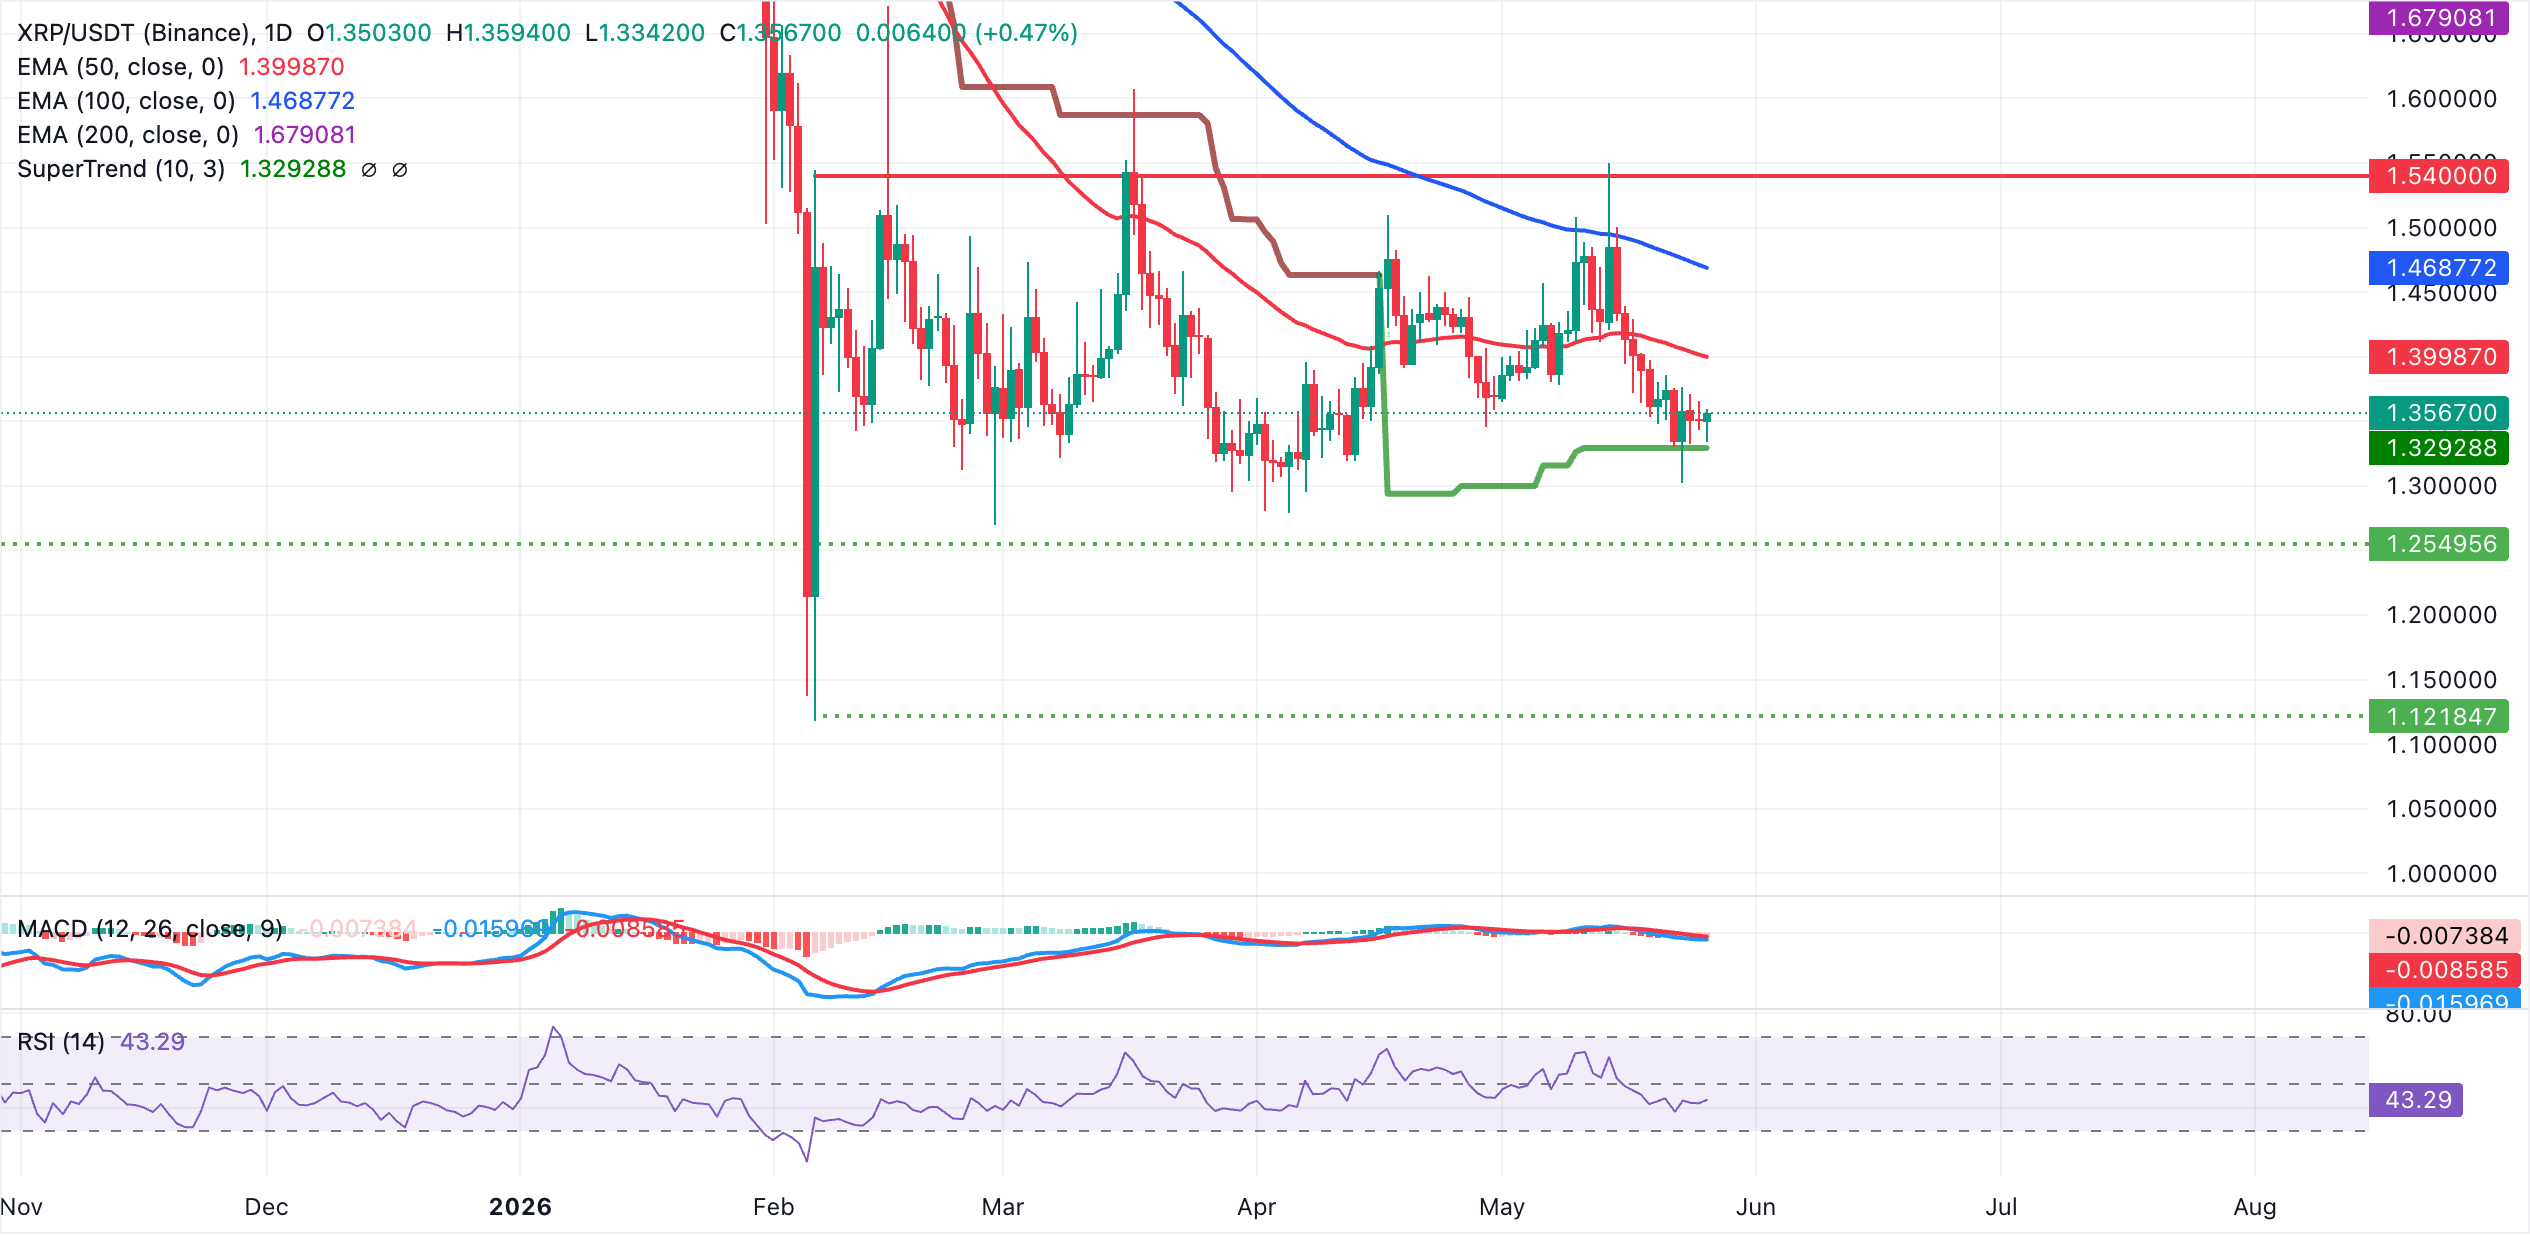
On the topside, initial resistance is aligned with the 50-day EMA at $1.40 and a daily close above this level would be needed to ease immediate downside pressure, exposing the 100-day EMA at $1.47ahead of the 200-day EMA near $1.68. On the downside, the SuperTrend indicator at $1.33 provides the first notable layer of support. A break beneath this zone would reinforce the prevailing bearish structure and open the door to deeper losses.