S&P 500 — US Large Cap Index
 FTSE 100 — UK Blue Chips
 Euro Stoxx 50 — Eurozone Leaders
 DAX 40 — German Equities
 CAC 40 — French Market Index
 Nikkei 225 — Japan Benchmark
 Hang Seng — Hong Kong Index
 Shanghai Composite — China Mainland
 ASX 200 — Australian Market
 TSX Composite — Canada Index
 Nifty 50 — India Large Cap
 STI Index — Singapore Market
 KOSPI — South Korea Index
 Bovespa — Brazil Equities
 JSE Top 40 — South Africa Index
 IPC Index — Mexico Market

Key takeaways
- Donald Trump warned of further attacks on Iran, but oil prices are edging lower today, falling to $92.5 per barrel.
- Investors are closely watching the conflict’s trajectory in the context of the US midterm elections scheduled for this autumn.
Brent crude oil (OIL) futures are edging lower today but continue to trade near $92.5 per barrel , after surging roughly 35% since the beginning of the month . Yesterday, Donald Trump warned that he is considering a larger military strike against Iran than ever before and said he is close to making a final decision. While this does not necessarily mean military action is imminent, it underscores the exceptionally high level of tensions between the two countries, with neither side currently appearing to view de-escalation as the most likely outcome.
- On the other hand, the White House is increasingly mindful of the U.S. midterm elections scheduled for this autumn. Political considerations could reduce the administration’s willingness to sustain a prolonged conflict later in the year, potentially compressing the decision-making window for any escalation into the coming weeks, before the election campaign intensifies.
- If a major escalation ultimately fails to materialize, investors may increasingly price in a return to diplomatic negotiations as the most probable scenario. In that case, keeping oil prices sustainably above $100 per barrel could prove difficult over the coming months, despite the currently tight physical market.
- Meanwhile, continued Houthi attacks on commercial shipping in the Red Sea and the possibility of broader U.S. military action against Iran are keeping supply risks elevated. Investors also worry that relatively low global oil inventories could amplify any supply shock if transportation routes or production are disrupted further.
- Higher oil prices are once again increasing the risk of persistent inflation, supporting government bond yields and potentially encouraging central banks to keep interest rates elevated for longer. At the same time, more expensive energy weighs on the global economic outlook by increasing transportation, manufacturing, and electricity costs while reducing households’ real purchasing power.
OIL technical analysis (D1)
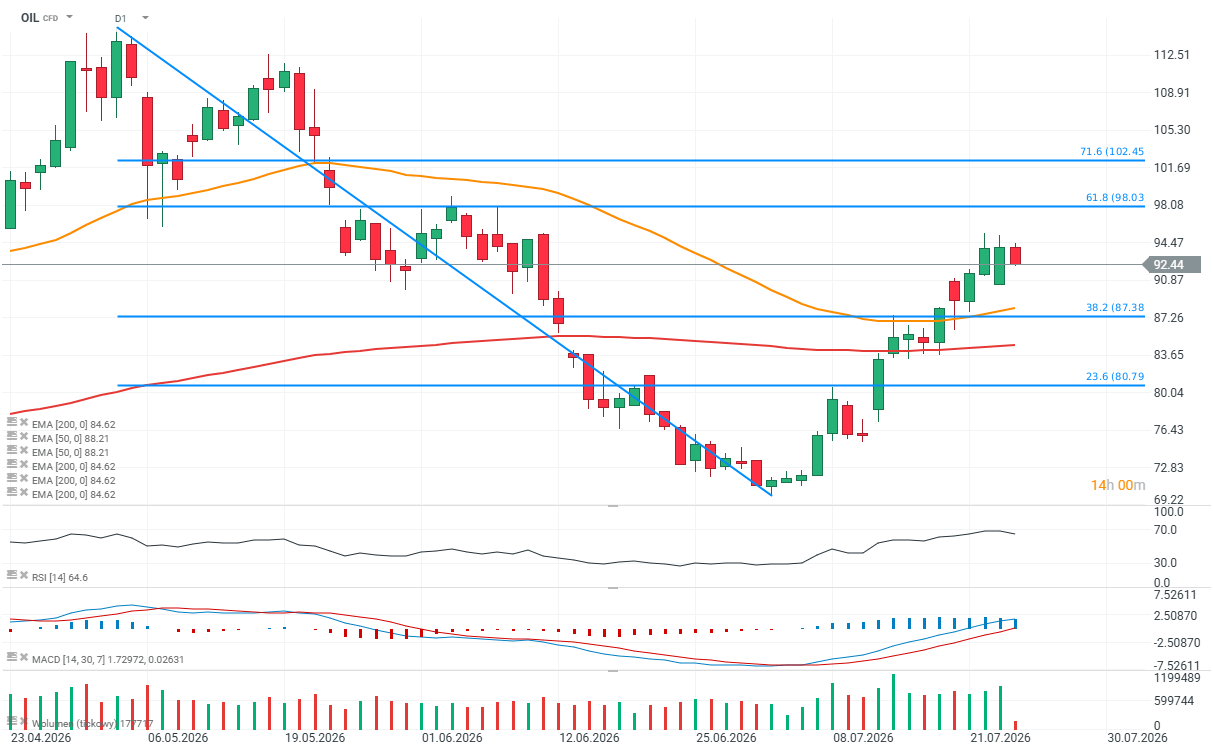
On the daily chart, Brent crude is trading between the 38.2% and 61.8% Fibonacci retracement levels of the previous downward move. The $98 per barrel area (61.8% Fibonacci) and $102.5 per barrel (71.6% Fibonacci) currently represent the key resistance levels to watch. On the downside, important support levels are located near $87 and $81 per barrel , corresponding to the 38.2% and 23.6% Fibonacci retracement levels, respectively.
Source: xStation5