S&P 500 — US Large Cap Index
 FTSE 100 — UK Blue Chips
 Euro Stoxx 50 — Eurozone Leaders
 DAX 40 — German Equities
 CAC 40 — French Market Index
 Nikkei 225 — Japan Benchmark
 Hang Seng — Hong Kong Index
 Shanghai Composite — China Mainland
 ASX 200 — Australian Market
 TSX Composite — Canada Index
 Nifty 50 — India Large Cap
 STI Index — Singapore Market
 KOSPI — South Korea Index
 Bovespa — Brazil Equities
 JSE Top 40 — South Africa Index
 IPC Index — Mexico Market
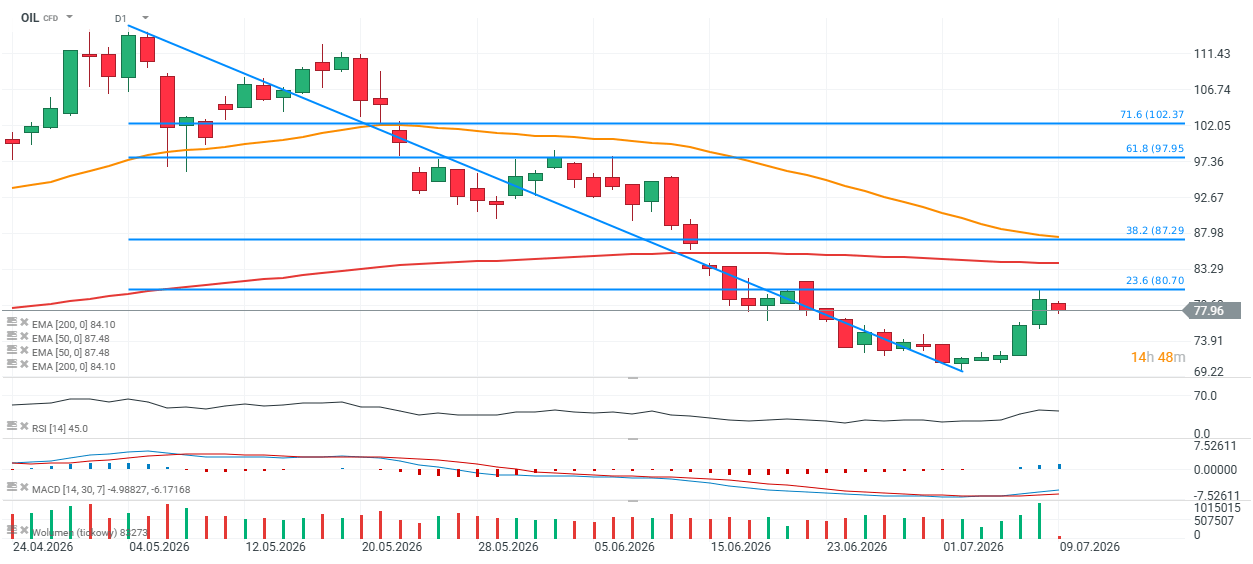
Chart of The Day – Oil slides from $80 despite USA – Iran tensions. What’s next?


Brent crude (OIL) rallied on the back of the latest escalation in the Middle East, but despite strikes on Iranian military facilities and Tehran’s retaliation against U.S. bases in the region, the oil market has remained relatively calm. The contract has rebounded more than 10% from its recent low, but the advance stalled almost precisely at the 23.6% Fibonacci retracement of this year’s May decline, around USD 80.7 per barrel. From a technical perspective, this level could trigger another downward move, with the USD 73–75 area emerging as the next key support zone. On the other hand, a decisive breakout higher would increase the probability of a move toward USD 84–87 per barrel, where the 200-day exponential moving average (EMA200) and the 38.2% Fibonacci retracement converge.
OIL (D1 chart)
Source: xStation 5
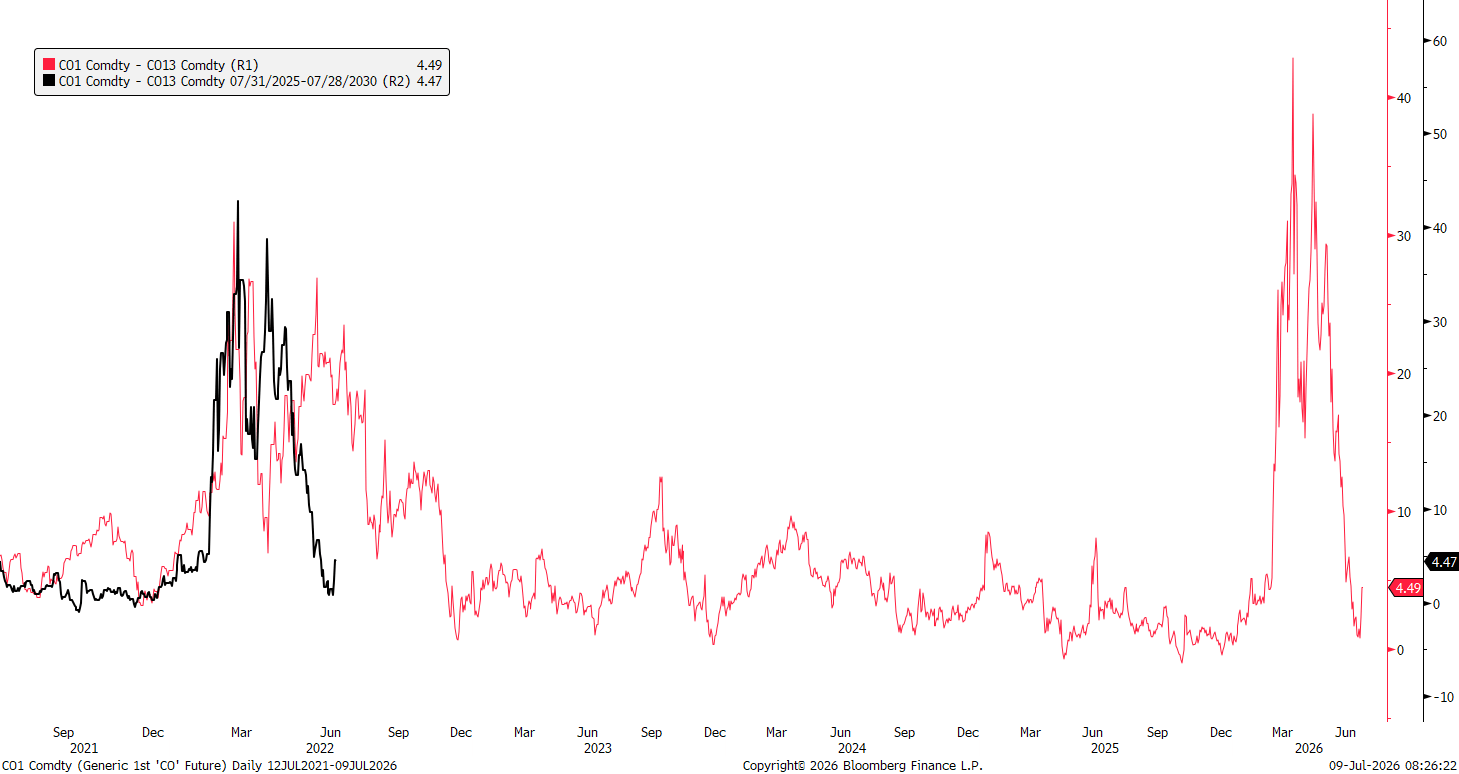
The chart below illustrates the Brent crude oil futures term structure, specifically the spread between the front-month futures contract (C01) and a much longer-dated contract (C013). The current spread of around USD 4.5 per barrel suggests that, despite a sharp decline from this year’s highs, the market is still pricing in meaningful short-term supply tightness. The red line represents the price difference between the front-month futures contract and the longer-dated contract. The current spread stands at approximately USD 4.49 per barrel. A positive spread means the front-month contract trades above the deferred contract, indicating a market in backwardation.
This typically reflects tight physical supply or exceptionally strong near-term demand for crude oil. The wider the spread, the larger the premium traders are willing to pay for immediate delivery. This explains the sharp spikes seen after Russia’s invasion of Ukraine in 2022 and again during the escalation of geopolitical tensions involving Iran in 2026. When the spread falls to zero or turns negative, the market shifts into contango, meaning longer-dated contracts trade above the front-month contract. Such a structure usually signals comfortable supply conditions, elevated inventories, or expectations of weaker demand. That is not the case at present.
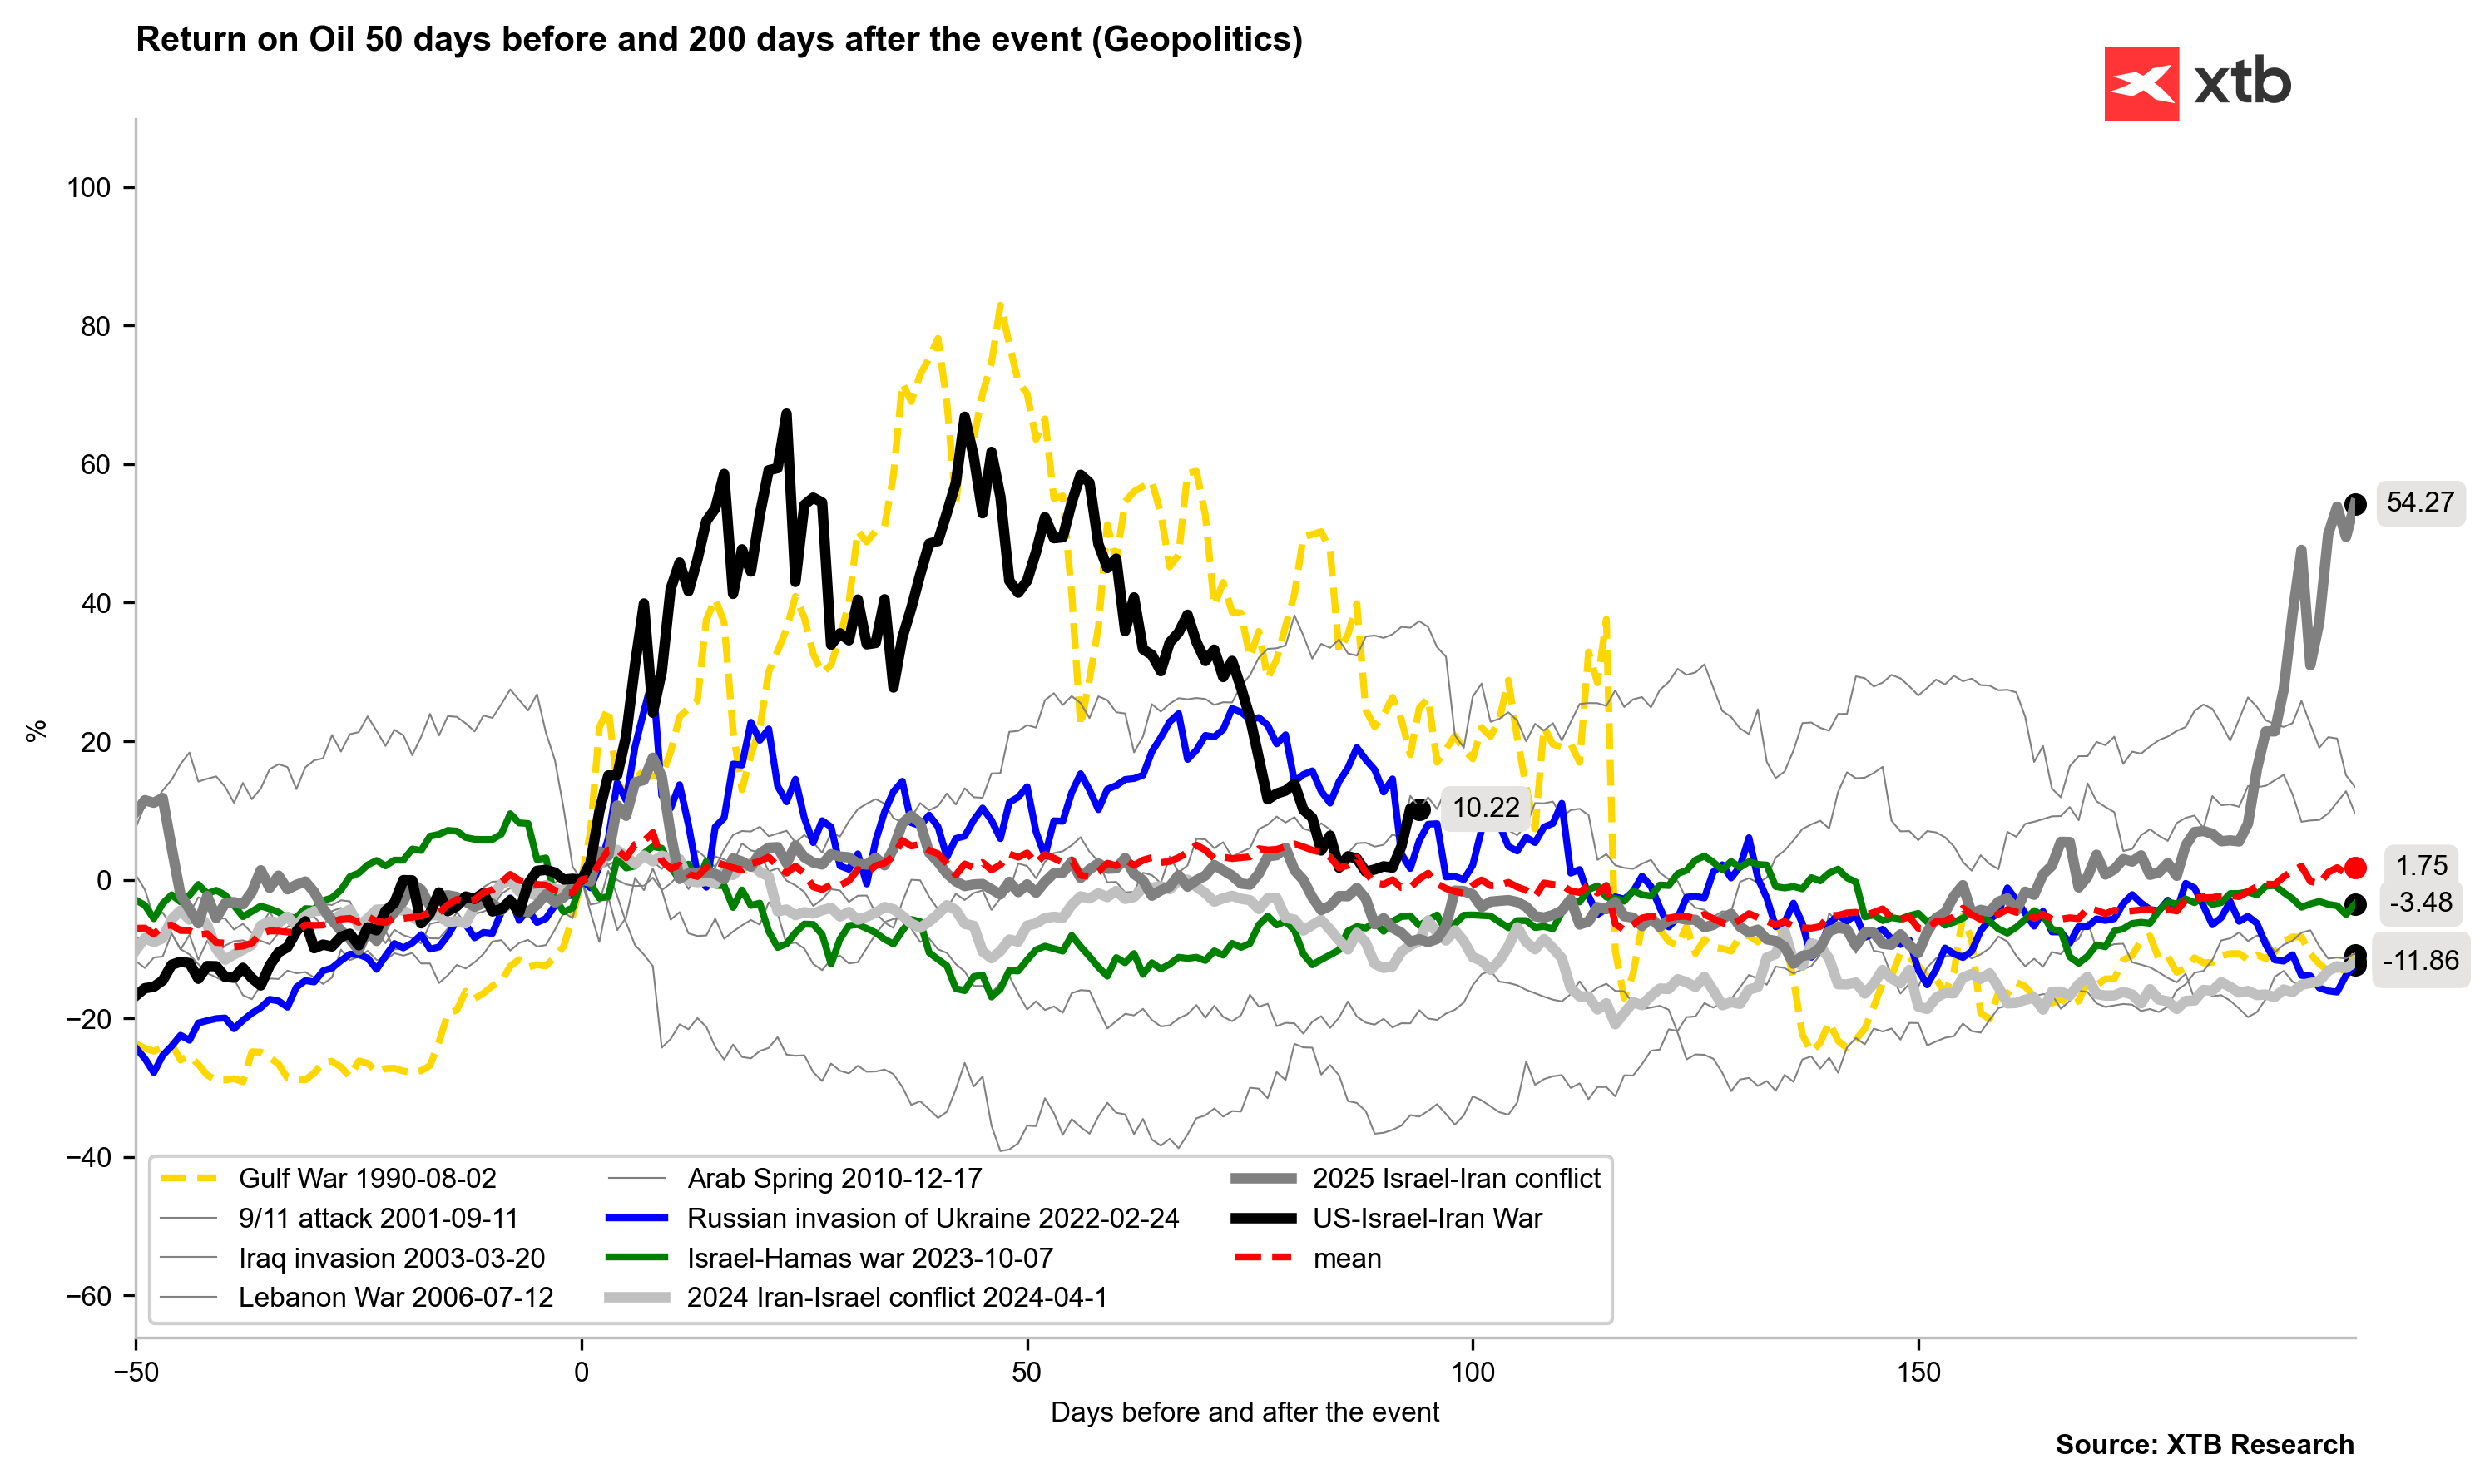
Source: Bloomberg Finance L.P. The chart compares Brent crude oil performance across major geopolitical events, showing returns from 50 days before to 200 days after each event. While some conflicts, such as the Gulf War and Russia’s invasion of Ukraine, triggered prolonged oil rallies, many others resulted in only temporary price spikes that faded over time. The current Israel-Iran conflict has so far produced a moderate increase compared with previous major geopolitical shocks. On average, geopolitical events have generated only limited long-term gains in oil prices, as illustrated by the relatively flat mean return. This suggests that unless supply disruptions become prolonged, geopolitical risk alone is often insufficient to sustain a lasting bull market in crude oil.
Source: Bloomberg Finance L.P., XTB Research