S&P 500 — US Large Cap Index
 FTSE 100 — UK Blue Chips
 Euro Stoxx 50 — Eurozone Leaders
 DAX 40 — German Equities
 CAC 40 — French Market Index
 Nikkei 225 — Japan Benchmark
 Hang Seng — Hong Kong Index
 Shanghai Composite — China Mainland
 ASX 200 — Australian Market
 TSX Composite — Canada Index
 Nifty 50 — India Large Cap
 STI Index — Singapore Market
 KOSPI — South Korea Index
 Bovespa — Brazil Equities
 JSE Top 40 — South Africa Index
 IPC Index — Mexico Market
Chart of The Day – USD/JPY Falls Ahead of a Key Test for the Yen


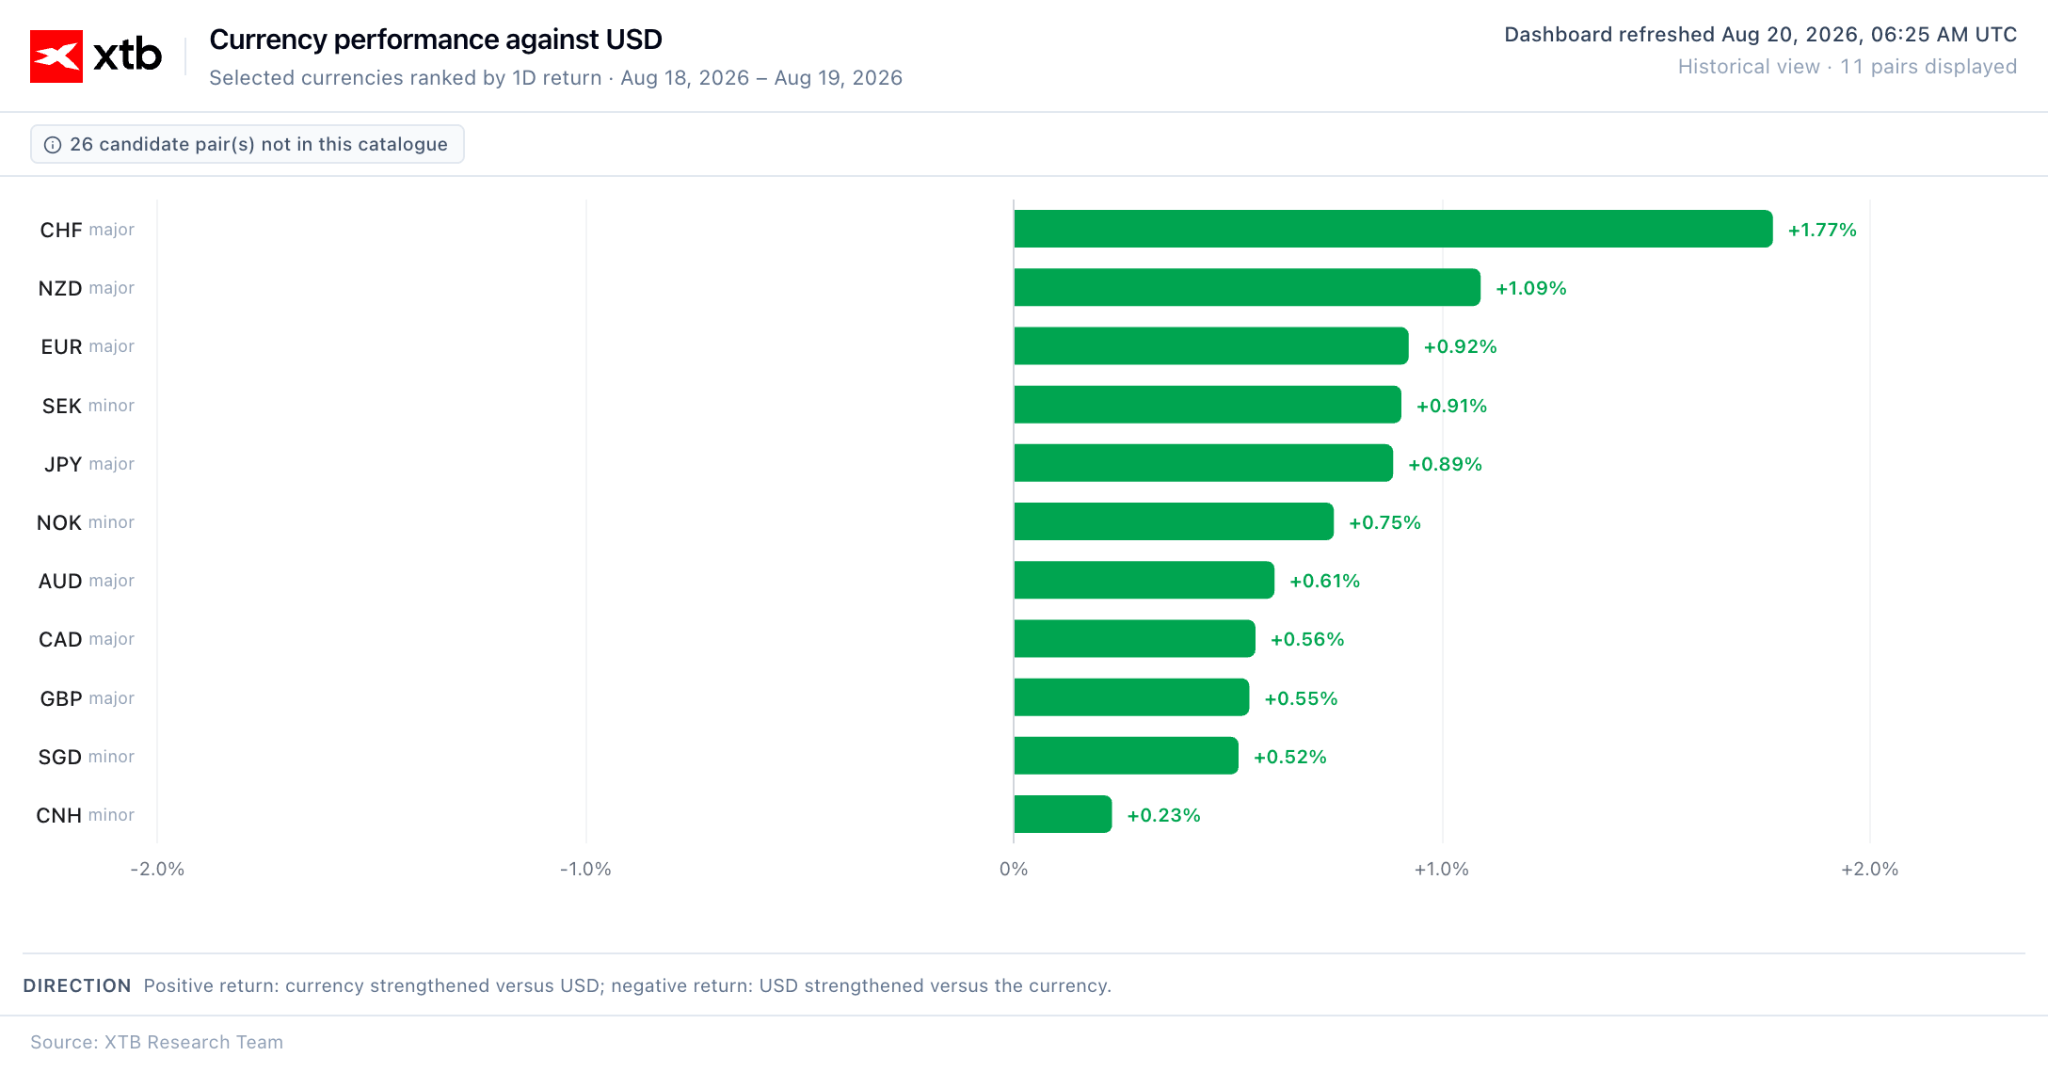
The USDJPY pair weakened by over 0.9% yesterday, significantly moving away from the key psychological barrier at the 160 level. Currently, the rate is oscillating around 158.5, awaiting the release of key data for the Japanese currency.
Department of the Treasury Intervention
Crucial for yesterday’s move were, of course, the words of Scott Bessent, the US Secretary of the Treasury, who announced plans yesterday to double the purchase of long-term US bonds. The program is scheduled to take effect on September 9 and run at least until November 4, when the Department of the Treasury will release new quarterly plans. The focus will be mainly on the long end of the curve, i.e., the purchase of Treasury bonds with long maturities. The decision means an increased supply of dollars on the market, which naturally led to a depreciation of the US currency. The yen was among the biggest beneficiaries. Figure 1: Performance of Selected Currencies (19.08.2026)
Source: XTB Research, 20.08.2026
Inflation Data
July inflation data from Japan is scheduled for release on Friday. The reading is expected at 12:30 AM. An hour later, we will receive the August PMI data. Figure 2: Japan CPI Inflation (2010 – 2026)
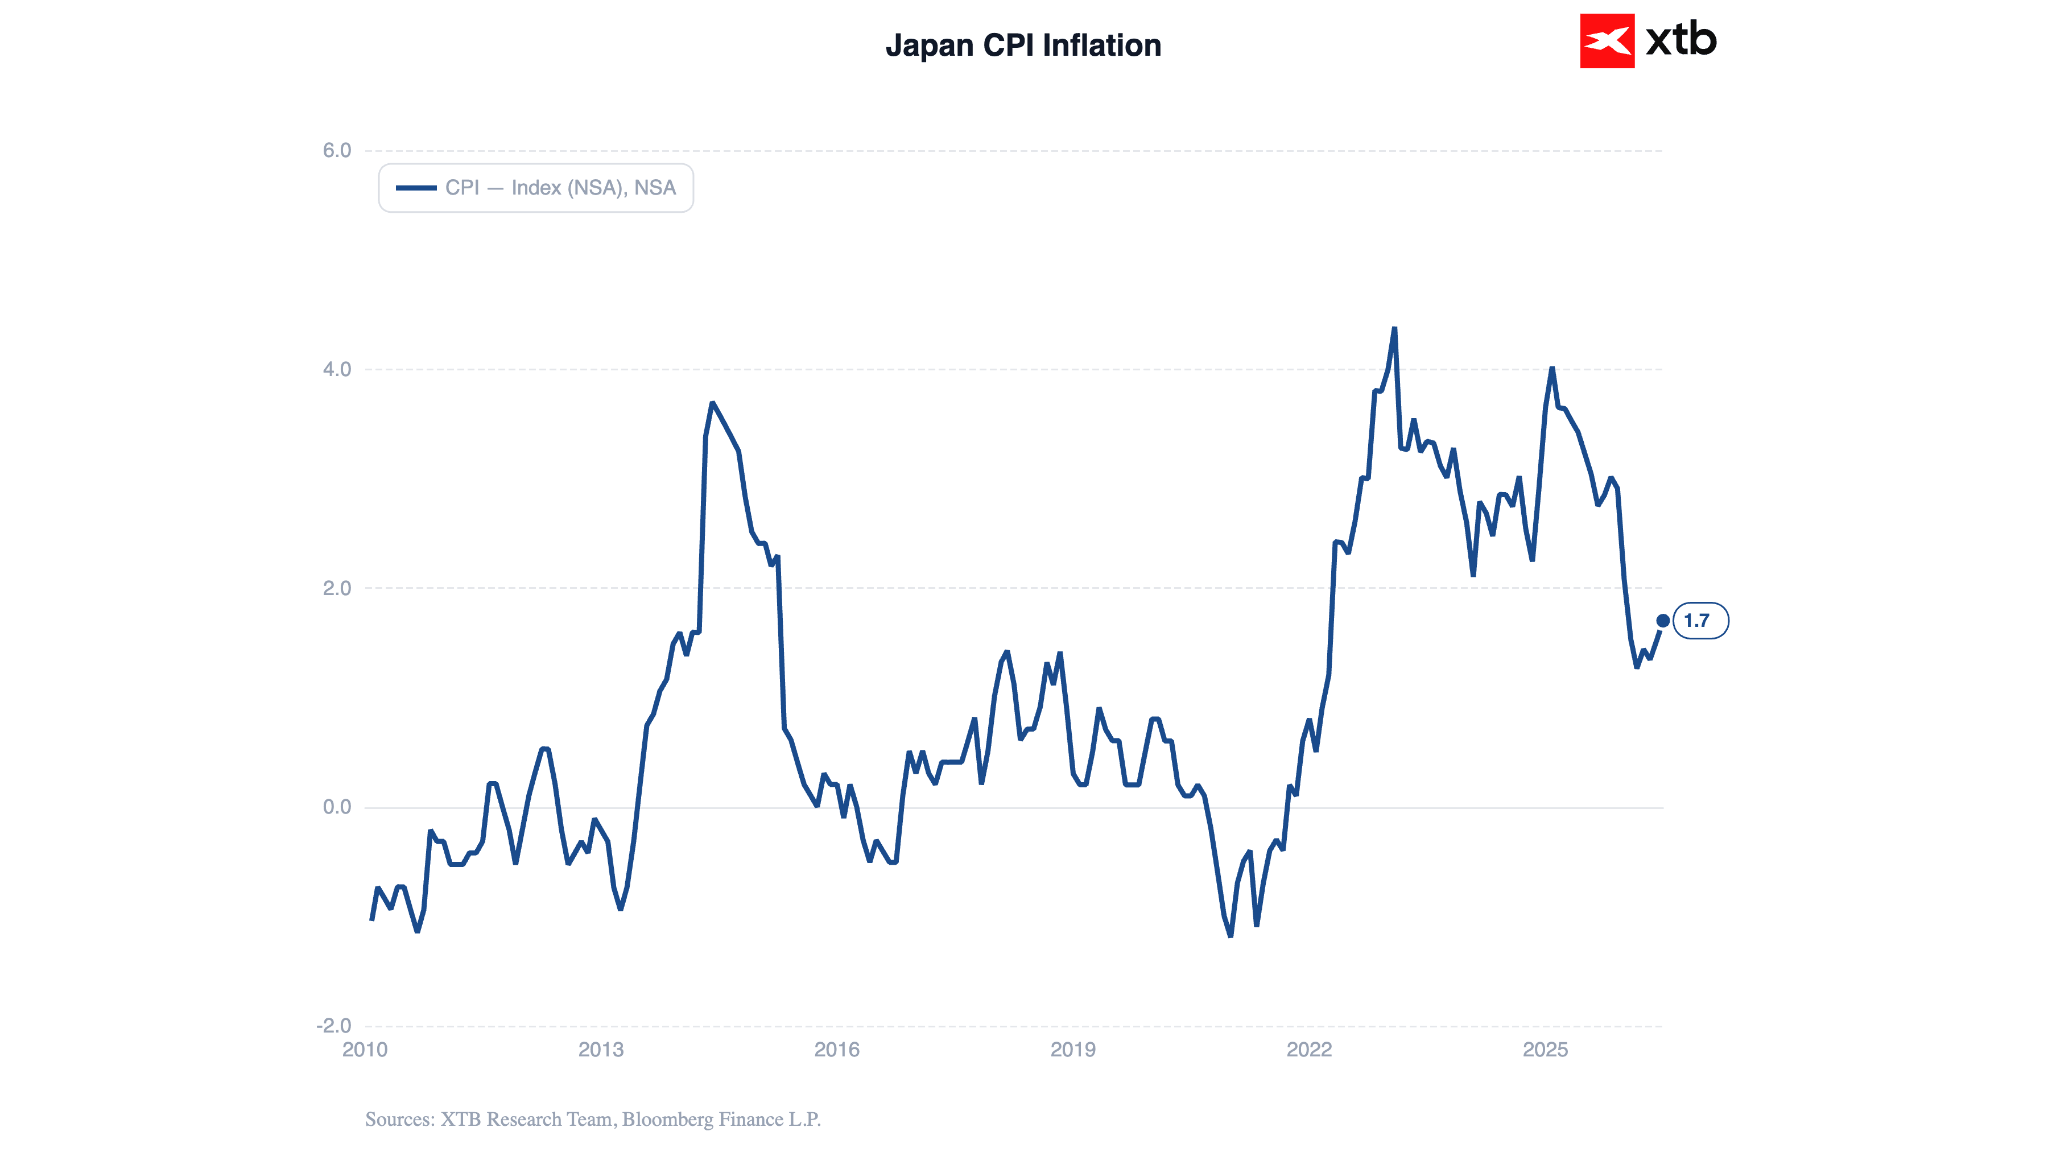
Source: XTB Research, 20.08.2026 Appetite for a hawkish surprise was whetted by the leading indicator for Tokyo published at the end of July. Core inflation in the Japanese capital unexpectedly accelerated from 1.6% to 1.9% y/y, beating the market consensus (1.7%). If Friday’s reading confirms this trend and shows rising price pressure, the Bank of Japan will gain further arguments for maintaining a restrictive monetary policy course. The next meeting is in less than a month, on September 18. Let us recall that in July, the BoJ kept interest rates unchanged (1%). A decision to hike could be a significant declaration for the market, leading to an increase in bets on further upward moves in the coming months.
Technical Analysis
Figure 3: USDJPY [D1] (18.12.2025 – 07.08.2026)
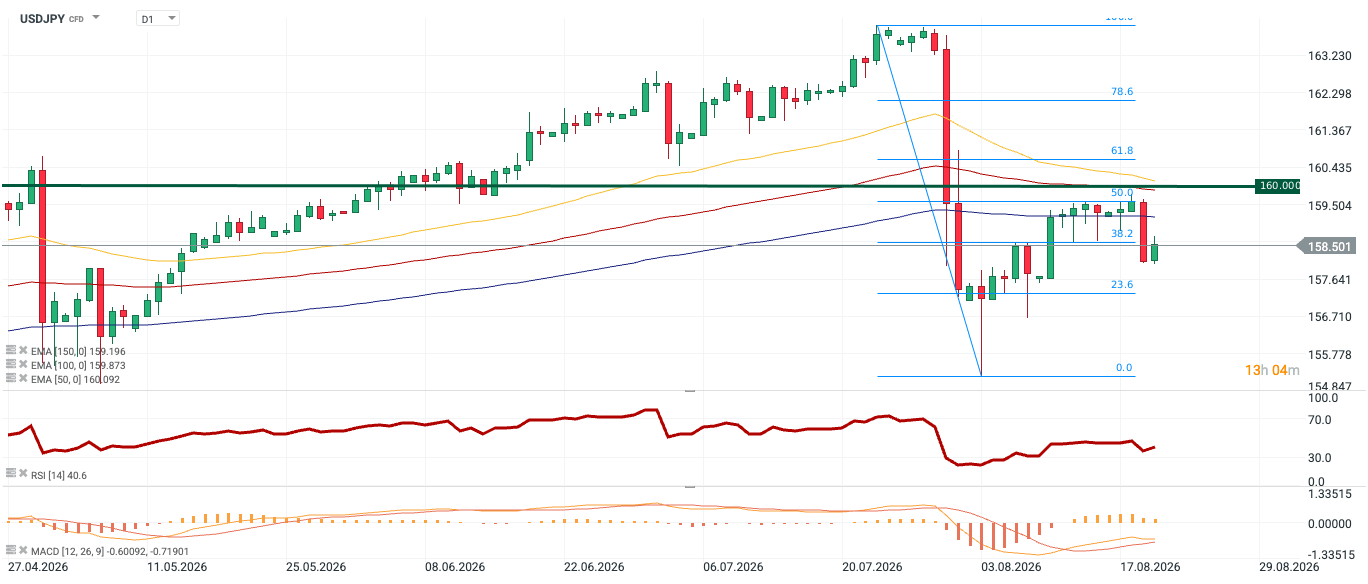
Source: xStation, 20.08.2026 Since April 2025, the USDJPY pair has been in a clear, stable uptrend. After setting a local peak around the 164 level, the market entered a phase of a very dynamic, deep downward correction. The current price is oscillating around 158.5, and the market is clearly looking for a solid bottom from which it could stage a more lasting rebound. The key barrier for the demand side currently remains the strategic resistance zone located around the psychological level of 160 (marked with a thick green line). This is a point of dual technical significance, as it almost coincides with the 100-period moving average. In recent days, buyers attempted to initiate an uptrend, but after reaching the vicinity of the 50% Fibo retracement and testing the long-term 150-period moving average (blue line, level around 159.2), they ran out of steam. The price fell below the key moving averages (EMA 50 and EMA 100). The RSI indicator, after a previous strong plunge, managed to rebound, but is currently sliding back to the 40.6 level. The positive bars of the MACD histogram are also shrinking.