S&P 500 — US Large Cap Index
 FTSE 100 — UK Blue Chips
 Euro Stoxx 50 — Eurozone Leaders
 DAX 40 — German Equities
 CAC 40 — French Market Index
 Nikkei 225 — Japan Benchmark
 Hang Seng — Hong Kong Index
 Shanghai Composite — China Mainland
 ASX 200 — Australian Market
 TSX Composite — Canada Index
 Nifty 50 — India Large Cap
 STI Index — Singapore Market
 KOSPI — South Korea Index
 Bovespa — Brazil Equities
 JSE Top 40 — South Africa Index
 IPC Index — Mexico Market
- EUR/JPY trades around the 164.00 zone after a modest pullback in Friday’s session.
- Broader bias remains bullish, with supportive trend indicators offsetting mixed momentum signals.
- Key support levels sit just below, while resistance aligns near recent highs.
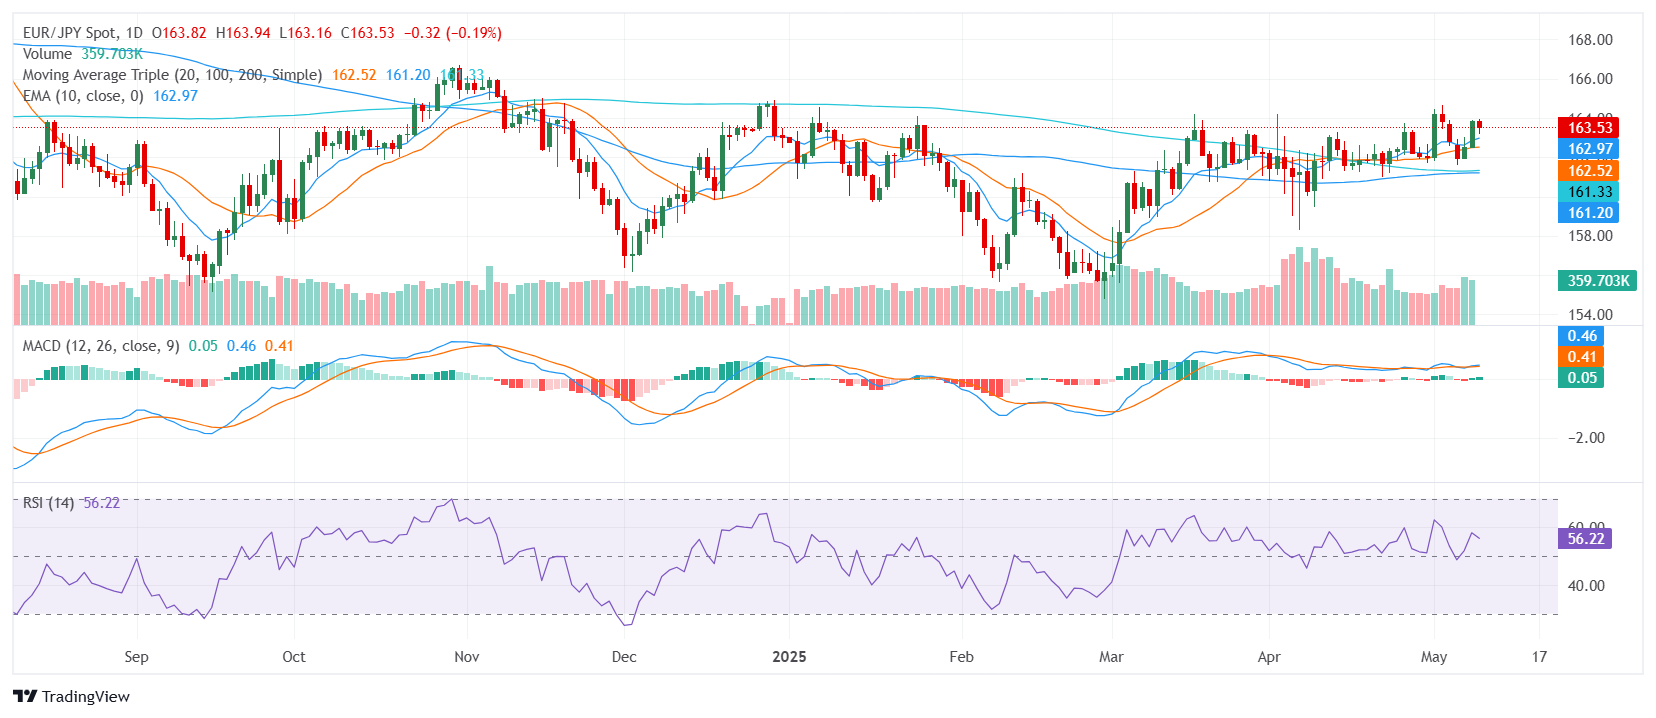
The EUR/JPY pair eased slightly on Friday, trading near the 164.00 zone after the European session, reflecting a modest pullback from recent gains. Despite the minor dip, the broader outlook remains positive, supported by a cluster of rising moving averages that continue to provide a strong technical base. Short-term momentum is mixed, but the overall structure remains clearly bullish.
Technically, the pair is flashing a bullish overall signal. The Relative Strength Index is neutral around 56, indicating balanced momentum without immediate overbought pressure. The Moving Average Convergence Divergence confirms the broader uptrend with a buy signal, reinforcing the bullish tone. Meanwhile, the Williams Percent Range and Bull Bear Power remain neutral, suggesting that while momentum has slowed, it has not yet reversed.
The bullish structure is clearly defined by the positioning of key moving averages. The 20-day, 100-day, and 200-day Simple Moving Averages all lie below current levels and maintain upward slopes, offering strong underlying support. The 10-day Exponential and Simple Moving Averages also sit just under the market, reinforcing the positive outlook as the pair approaches the Asian session.
Support levels are identified at 163.07, 162.94, and 162.87. Resistance is seen at 163.94, 164.00, and 164.10. A sustained push above the immediate resistance zone could confirm a broader breakout, while a break below support would likely trigger a short-term correction without significantly altering the overall trend.
Daily Chart