S&P 500 — US Large Cap Index
 FTSE 100 — UK Blue Chips
 Euro Stoxx 50 — Eurozone Leaders
 DAX 40 — German Equities
 CAC 40 — French Market Index
 Nikkei 225 — Japan Benchmark
 Hang Seng — Hong Kong Index
 Shanghai Composite — China Mainland
 ASX 200 — Australian Market
 TSX Composite — Canada Index
 Nifty 50 — India Large Cap
 STI Index — Singapore Market
 KOSPI — South Korea Index
 Bovespa — Brazil Equities
 JSE Top 40 — South Africa Index
 IPC Index — Mexico Market


- GBP/USD trades firmly near the monthly high around 1.3410.
- Hawkish BoE expectations have strengthened the British Pound.
- Investors await the UK Retail Sales and the flash UK-US PMI data.
The British Pound (GBP) reflects strength against the US Dollar (USD) on Thursday, trading firmly near the monthly high at around 1.3410 in the European trade. The GBP/USD pair strengthens as hot United Kingdom (UK) Consumer Price Index (CPI) data for September has boosted hawkish Bank of England (BoE) expectations.
UK inflation surprise keeps BoE tightening bias in focus
Analysts at Nomura highlight that the latest UK inflation release showed renewed upside pressure, with “both headline and services inflation” in the September report coming in “above consensus expectations.” They note that the BoE’s core gauge of underlying price pressures remains stubborn, stressing that “the BoE’s core measure service prices momentum has been sticky over the past few months.”
Nomura also points to pipeline pressures, observing that “upstream prices also surprised on the upside.” While they judge that wholesale goods price rises were “dominated by a rise in energy costs,” they add that “core prices rose at a more modest pace.” At the same time, they warn that “upstream service prices are signalling a further increase in consumer prices,” underscoring the risk of renewed pass-through to households.
Against this backdrop, Nomura argues that “a combination of sticky inflation, a resilient labour market, strong economic growth and persistently elevated energy prices has led us to change our view on the BoE.” The bank now expects additional tightening, stating: “We now see rate hikes in November and February, which is still a more dovish outcome than markets are pricing.”
Going forward, investors will focus on the UK Retail Sales data for September and the preliminary Uk-United States (US) S&P Global PMI data for October, which are scheduled for Friday.
GBP/USD Technical Analysis
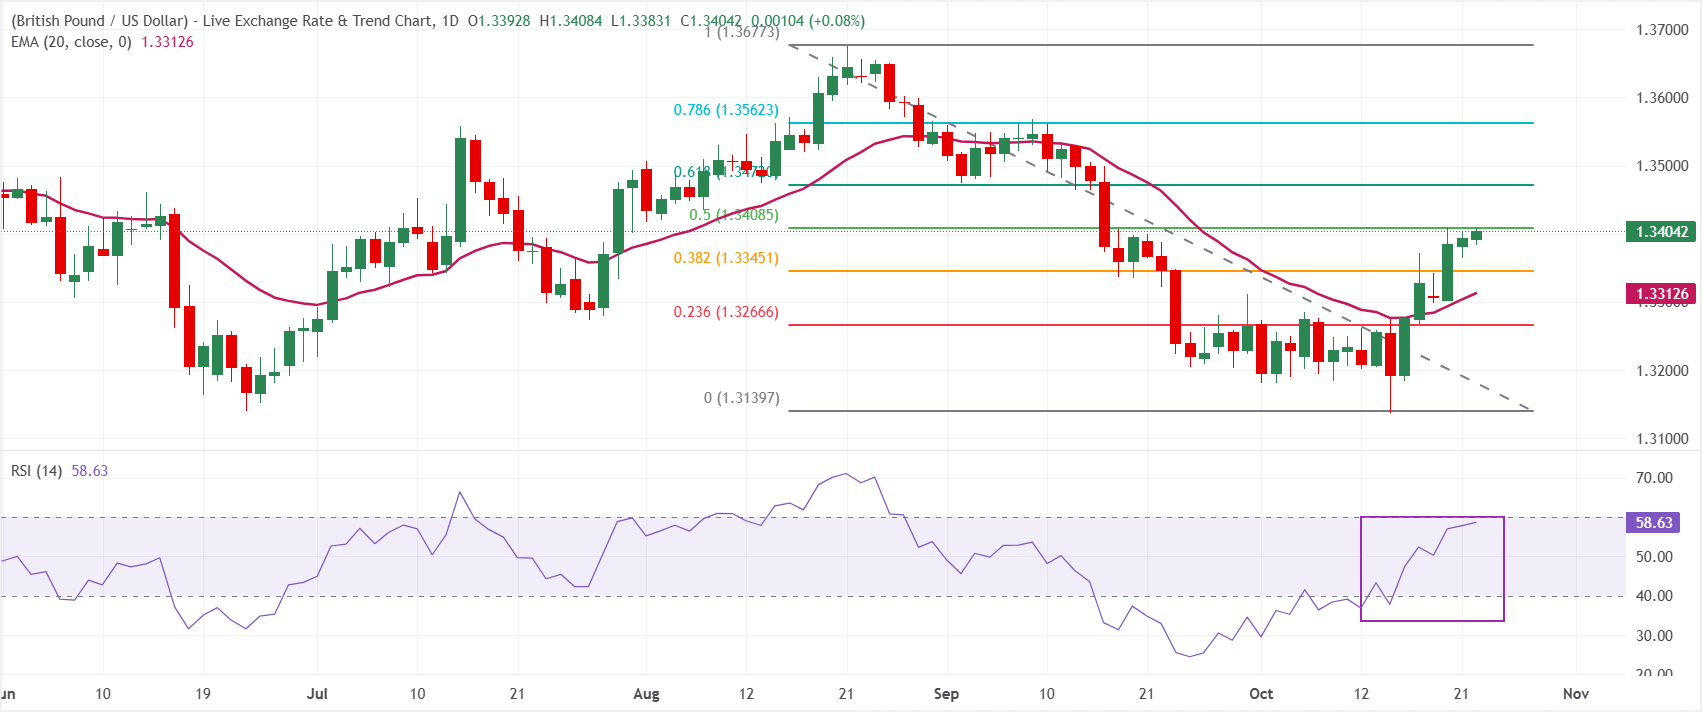
In the daily chart, GBP/USD trades at 1.3404. The pair has reclaimed a near-term bullish tone as price holds above the 20-day Exponential Moving Average (EMA) at 1.3313 and sits between the 38.2% and 50.0% Fibonacci retracements of the recent downswing, with the latter just overhead at 1.3409. The Relative Strength Index (RSI) at 58.6 is edging into positive territory, which suggests recovering upside momentum while the pair tests this key retracement cap.
On the topside, immediate resistance is located at the 50.0% Fibonacci retracement at 1.3409, followed by the 61.8% level near 1.3472 and the 78.6% retracement around 1.3562, with the recent swing high at 1.3677 acting as a more distant barrier. On the downside, initial support is seen at the 38.2% Fibonacci retracement at 1.3345, ahead of the 23.6% level around 1.3267, while a deeper pullback would expose the structural floor near 1.3140.