S&P 500 — US Large Cap Index
 FTSE 100 — UK Blue Chips
 Euro Stoxx 50 — Eurozone Leaders
 DAX 40 — German Equities
 CAC 40 — French Market Index
 Nikkei 225 — Japan Benchmark
 Hang Seng — Hong Kong Index
 Shanghai Composite — China Mainland
 ASX 200 — Australian Market
 TSX Composite — Canada Index
 Nifty 50 — India Large Cap
 STI Index — Singapore Market
 KOSPI — South Korea Index
 Bovespa — Brazil Equities
 JSE Top 40 — South Africa Index
 IPC Index — Mexico Market

Gold price rebounds as falling US yields weigh on US Dollar
- Gold hits consolidates above $4,000 as Treasury yields extend decline.
- Sticky Core PCE keeps Fed rate-hike expectations alive.
- Warsh testimony, NFP and ISM data shape the next catalyst.
Gold (XAU/USD) price recovers some ground on Friday, hitting a two-day high of $4,096 as the Greenback edges lower alongside Treasury yields after investors trimmed hawkish bets on the Federal Reserve (Fed). The XAU/USD pair trades at $4,076, up 1.24%.
XAU/USD rises as traders trim Fed hawkish bets
The yellow metal has failed to gain meaningful traction over the last few days, even though the US 10-year Treasury yield has fallen nearly 14 basis points since Wednesday, to 4.374%.eExpectations that prices would fall after the resolution of the US-Iran conflict and the reopening of the Strait of Hormuz sent Oil prices tumbling, along with US yields.
The US Dollar Index (DXY), which measures the buck’s performance against six peers, is down 0.10% at 101.33, a tailwind for bullion prices.
Meanwhile, the latest US inflation report, the Core Personal Consumption Expenditures (PCE) Price Index, which is the Federal Reserve’s favorite inflation gauge, rose by 3.4% YoY as expected in May, up from April’s 3.3% and well above the US central bank’s goal of 2%.
The backdrop justifies Fed hawks seeking further tightening, led by Minneapolis Fed President Neel Kashkari, who penciled in one rate hike in 2026, and told Bloomberg that “widespread inflation” suggests that raising rates is needed.
On Thursday, Chicago Fed President Austan Goolsbee said core inflation remains too high and is trending in the wrong direction. New York Fed John Williams added that inflation is still too high, though he revealed that policy is “well-positioned.”
Recently, US data showed that the University of Michigan Consumer Sentiment for June improved from 48.9 to 49.5 on its final reading, exceeding forecasts and May’s print of 44.8. Further data showed that inflation expectations for one year were unchanged at 4.6% and for five years at 3.3%, down from 3.4% in the previous reading.
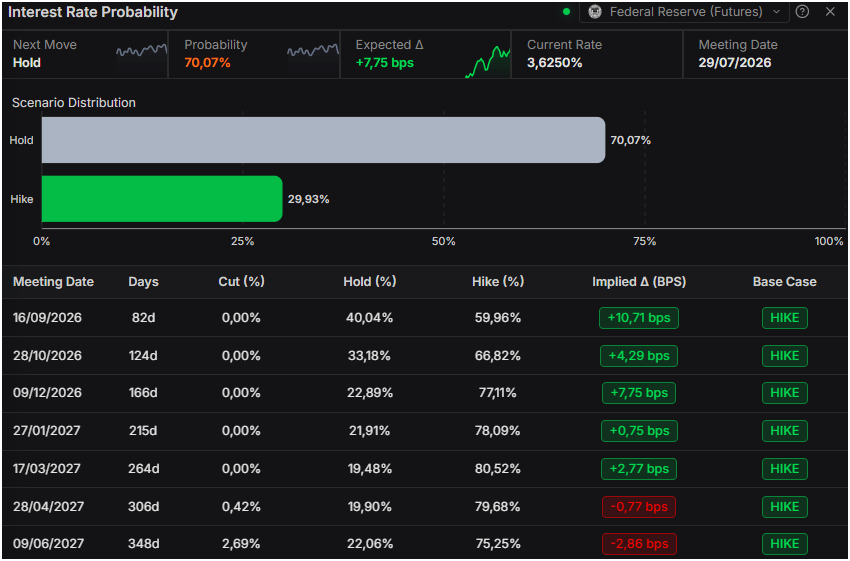
All in all, traders are expecting the Fed to raise interest rates. Prime Terminal data shows that for the September meeting, odds of a rate hike are 73%, with Fed funds futures implying 18.46 basis points of tightening.
Next week, the US economic docket will feature Fed Chair Kevin Warsh’s appearance before US Congress, the crucial June Nonfarm Payrolls, and the release of the ISM Manufacturing PMI for June.
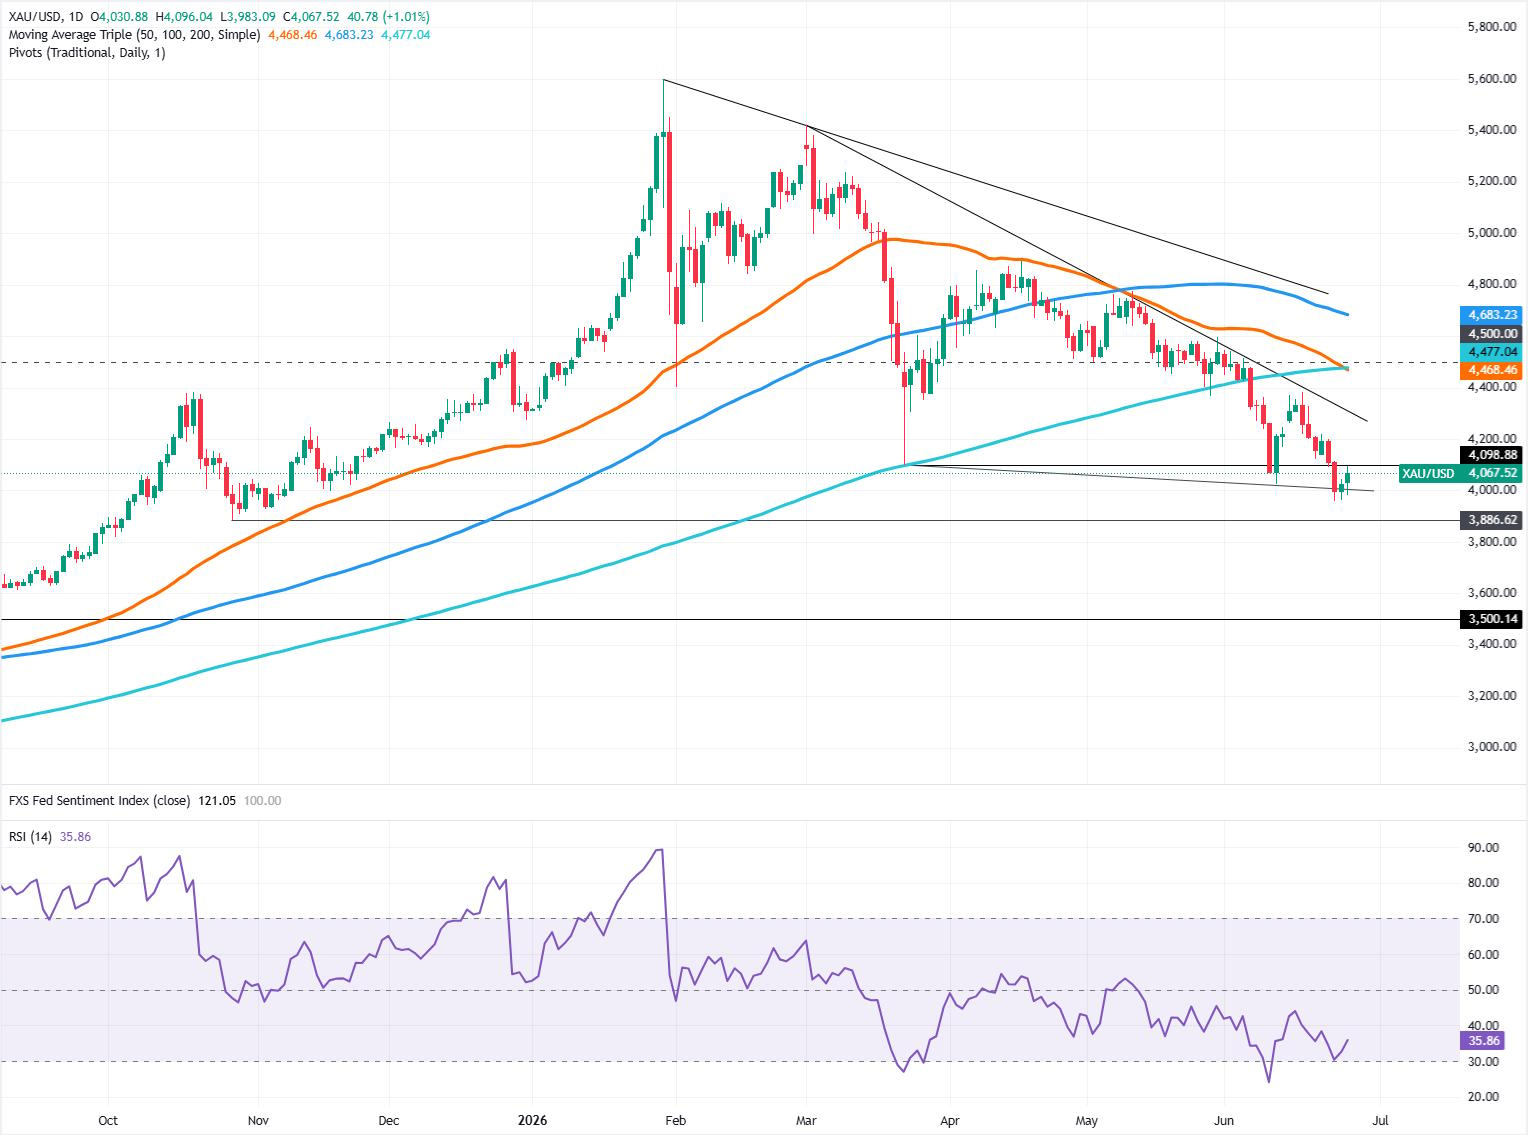
XAU/USD price forecast: Gold rebounds, yet faces strong resistance at $4,100
Price action shows that Gold is still downward-biased unless buyers clear key technical resistance levels, such as the March 23 daily low-turned-resistance at $4,098, ahead of the $4,100 round level.
Momentum, as measured by the Relative Strength Index (RSI), is aiming towards its neutral level; yet it remains bearish. However, traders must be aware that the RSI formed a positive divergence, indicating that momentum is tilted upwards, while XAU/USD price action signals the opposite, registering lower lows. Therefore, further upside is expected in the short term, but some resistance levels need to be broken for it to materialise.
If XAU/USD clears $4,098, the next resistance would be the psychological $4,100, followed by key psychological levels $4,150 and $4,200. Up next lies a downslope resistance level near the $4,280- $4,300 range.
Downwards and the path of least resistance, the first XAU/USD support would be $4,050, followed by $4,000. Below this level is the year-to-date (YTD) low of $3,959.