S&P 500 — US Large Cap Index
 FTSE 100 — UK Blue Chips
 Euro Stoxx 50 — Eurozone Leaders
 DAX 40 — German Equities
 CAC 40 — French Market Index
 Nikkei 225 — Japan Benchmark
 Hang Seng — Hong Kong Index
 Shanghai Composite — China Mainland
 ASX 200 — Australian Market
 TSX Composite — Canada Index
 Nifty 50 — India Large Cap
 STI Index — Singapore Market
 KOSPI — South Korea Index
 Bovespa — Brazil Equities
 JSE Top 40 — South Africa Index
 IPC Index — Mexico Market
First Weekly Decline Since August
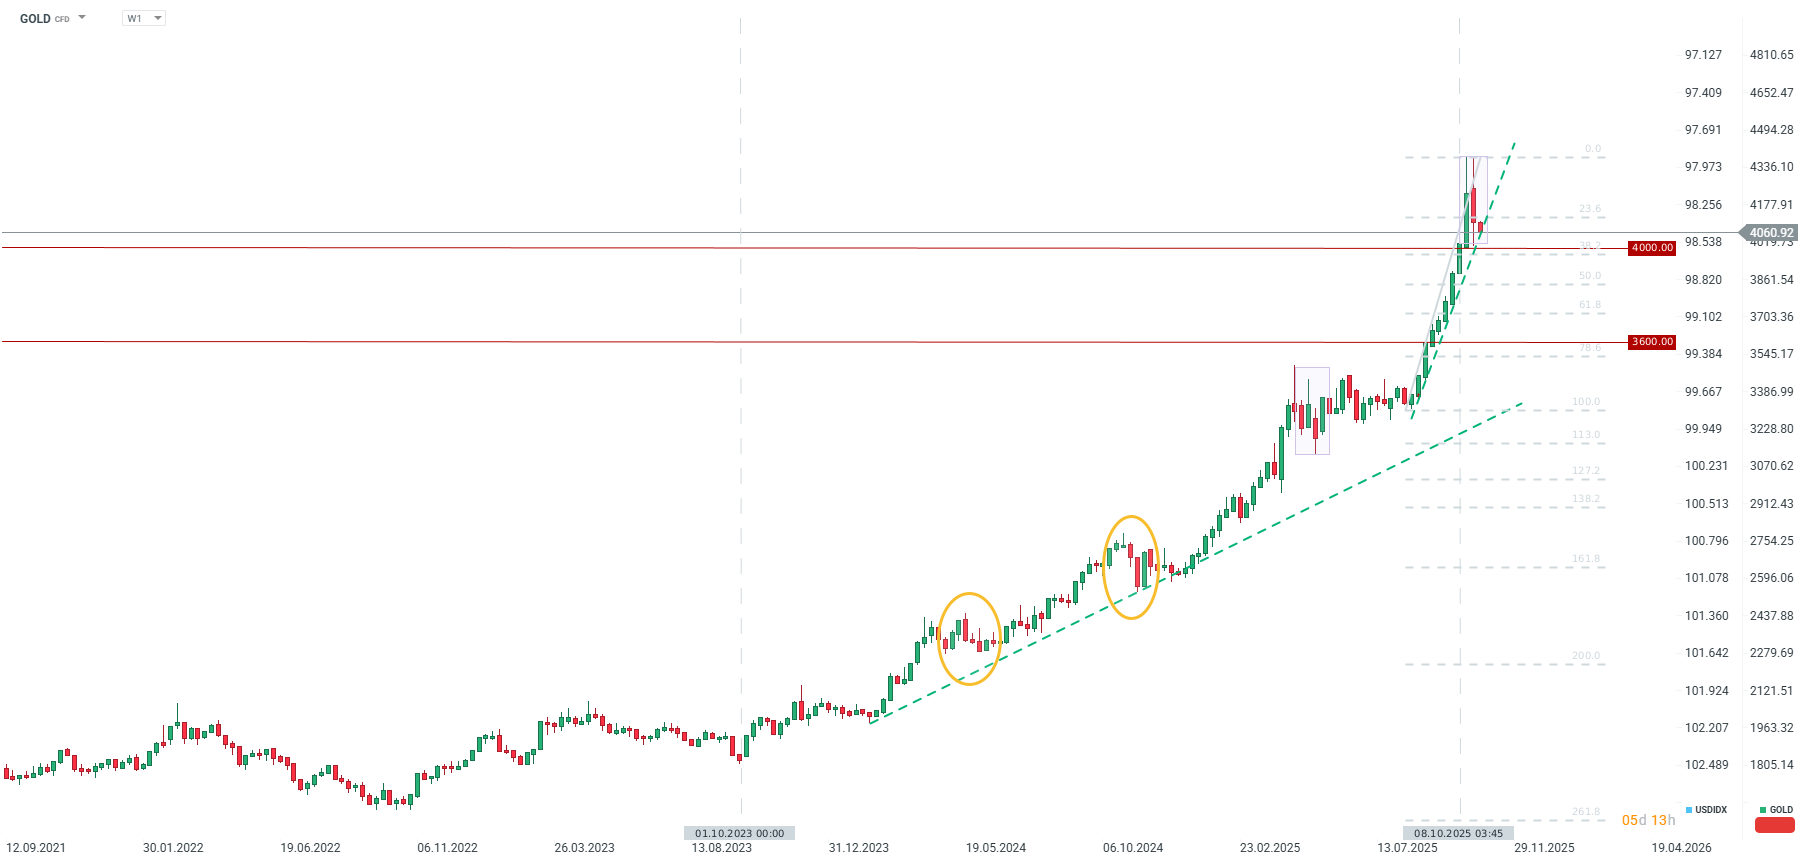
Gold is trading lower at the start of this week. Last week marked the first weekly decline since the second week of August. Should this week also end in a loss, it would be the first such instance since June. Furthermore, we have not seen gold fall for more than two consecutive weeks this year, and the current correction remains within the scope of the April and May corrections, provided the $4,000 per ounce level remains unbroken. In the current uptrend that began at the end of 2023, there were only two instances where declines lasted three weeks. Longer corrections were observed in 2022 and early 2023, a period characterised by interest rate hikes and high inflation.
Source: xStation5
ETFs Begin Moderate Sell-Off
One of the driving forces in the gold market this year has been the influx of capital into Exchange Traded Funds (ETFs), which purchased physical gold as a hedge. ETFs started the year holding approximately 85 million ounces, a figure that has now risen to 98 million ounces. Nevertheless, historical peaks for the amount of gold held by ETFs stand at 110 million ounces, set in 2020. This indicates that there remains potential for further demand from this source, although, naturally, purchasing gold now is twice as expensive as it was then.
The reduction in ETF gold holdings is slight. However, focusing on the world’s largest fund of this type, SPDR Gold Shares (GLD.US), reveals significant reductions executed on October 22nd and 24th. These were the largest liquidations since May and April, and they followed three days of substantial inflows. While this does not yet signal a complete reversal in the gold market, further monitoring of cash flows within this fund is warranted. It is worth noting that ETFs are invested in not only by retail clients but primarily by institutions such as pension funds. Although changes in their assets are typically infrequent, a significant withdrawal of capital could trigger a snowball effect, as was observed in 2020 and 2022.
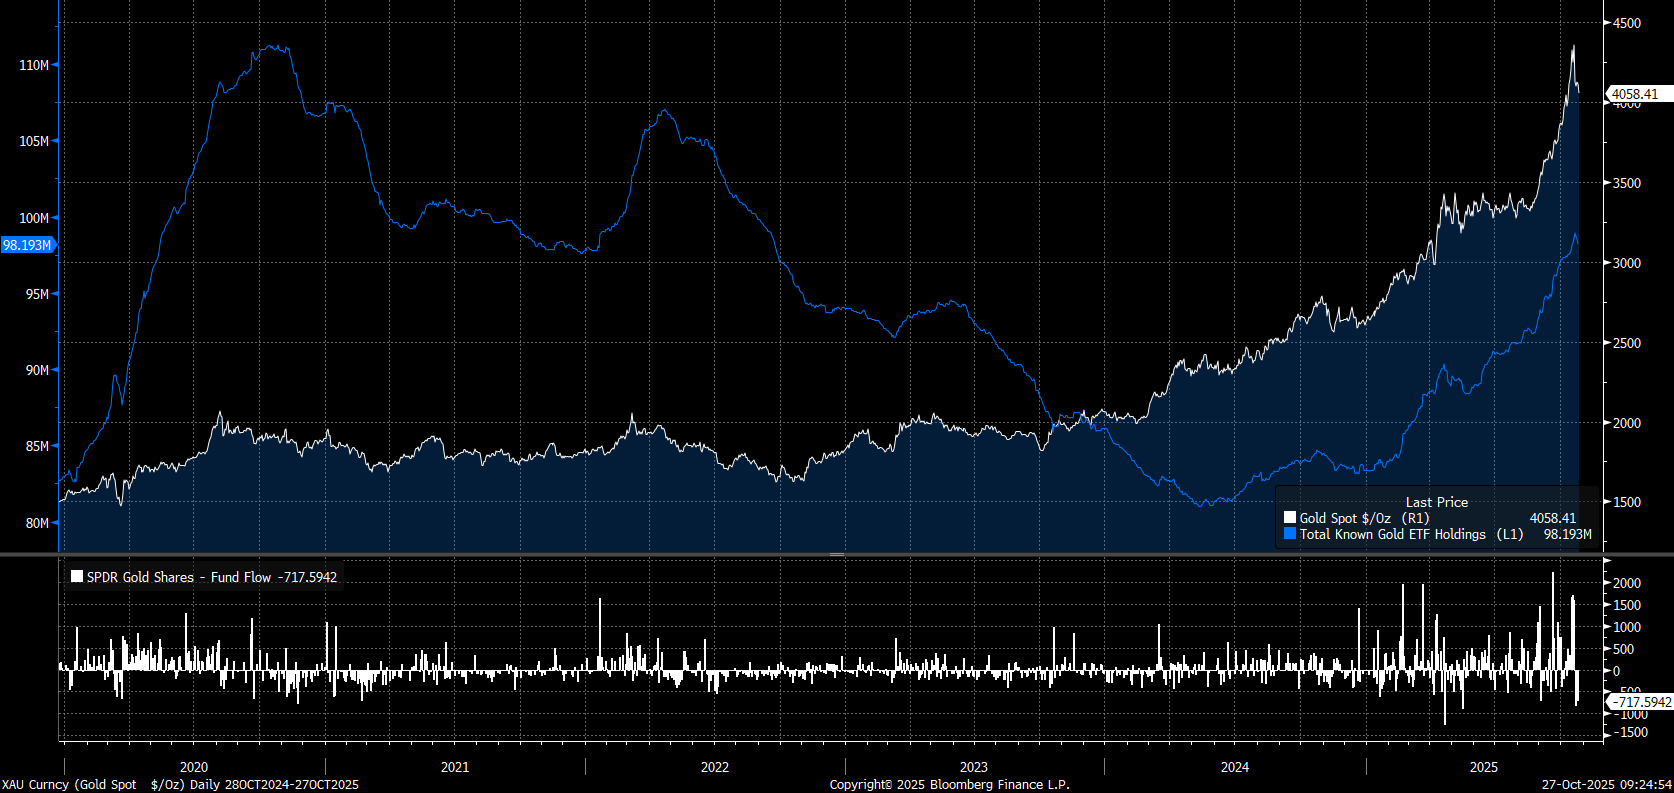
The top chart shows gold prices alongside the quantity of gold held by ETFs. The bottom chart shows daily cash flows in the largest US ETF, SPDR Gold Shares (GLD.US). Source: xStation5
Technical Outlook
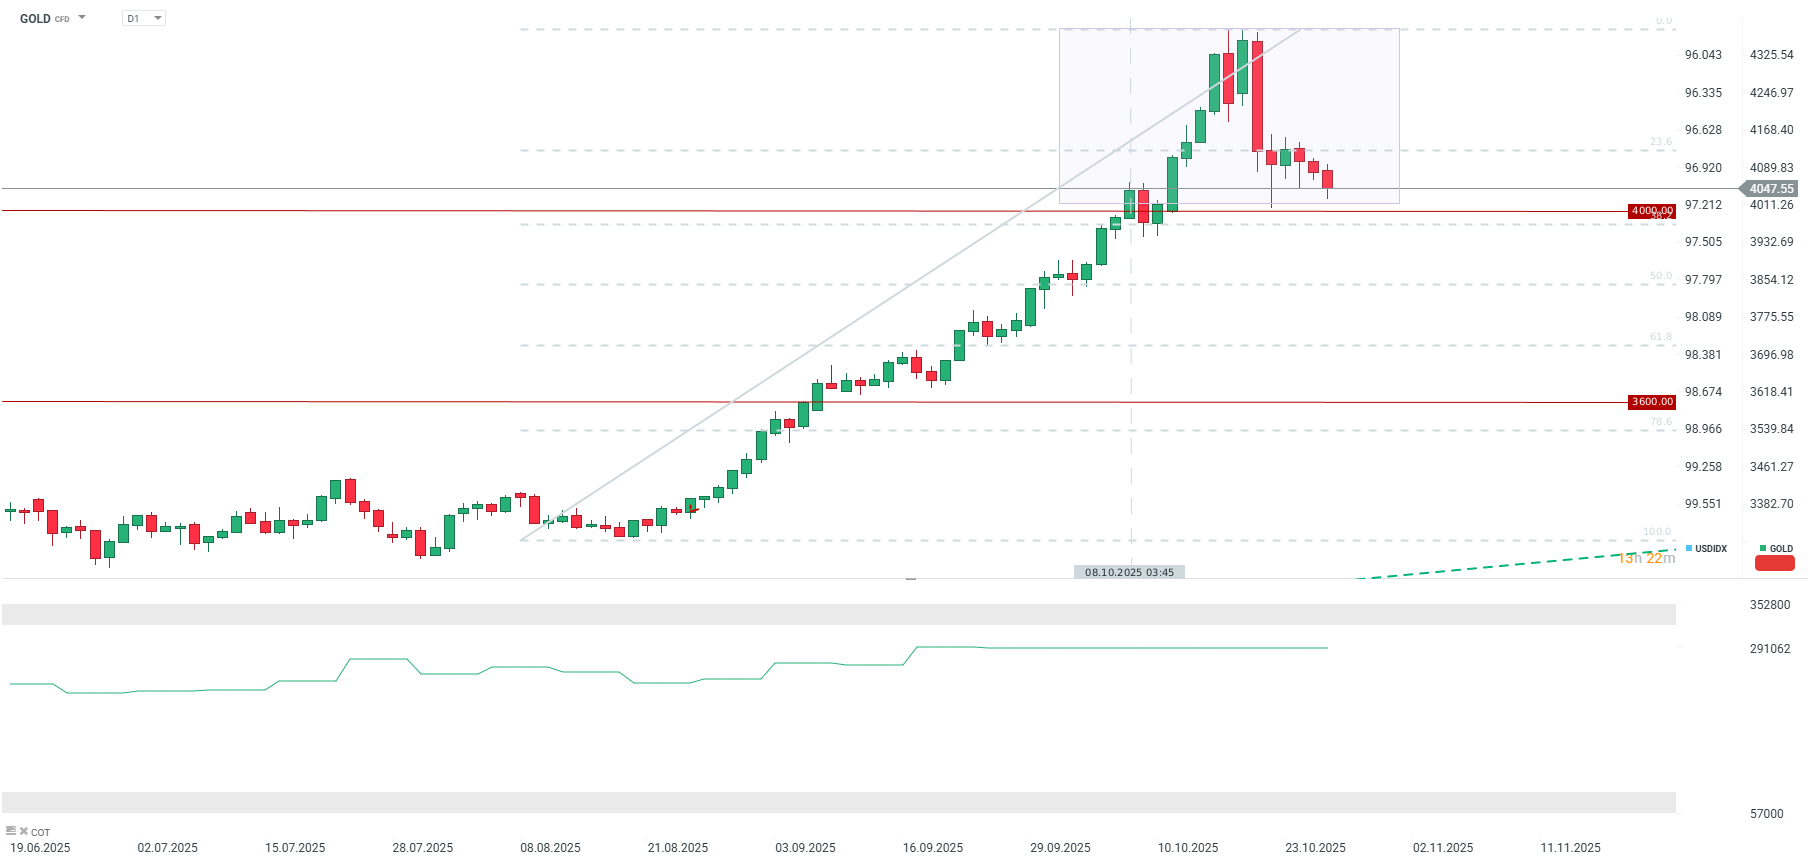
Gold’s decline at the start of the week may be related to anticipation ahead of the Fed decision, which is expected to bring an interest rate cut. However, the market remains uncertain whether the Fed will signal a willingness for further moves. Concurrently, initial reports suggest some positive developments at the working level ahead of the meeting between Trump and Xi this Thursday. Consequently, Wednesday and Thursday will be a crucial period for gold. If gold were to trade below $4,000 following the Trump-Xi meeting on Thursday, we might experience a more substantial correction, potentially targeting the area around the 50.0% Fibonacci retracement. Such a correction from the all-time high would reach approximately -12%. This level would simultaneously preserve the 50-period moving average, which was key during the initial phase of the rally earlier this year. However, if gold holds the $4,000 support and ETFs cease selling, we will consider a scenario of a limited correction with the prospect of gold rising to the $4,400-$4,500 range.
The material on this page does not constitute financial advice and does not take into account your level of understanding, investment objectives, financial situation or any other specific needs. All information provided, including opinions, market research, mathematical results and technical analyzes published on the Website or transmitted To you by other means, it is provided for information purposes only and should in no way be construed as an offer or solicitation for a transaction in any financial instrument, nor should the information provided be construed as advice of a legal or financial nature on which any investment decisions you make should be based exclusively To your level of understanding, investment objectives, financial situation, or other specific needs, any decision to act on the information published on the Website or sent to you by other means is entirely at your own risk if you In doubt or unsure about your understanding of a particular product, instrument, service or transaction, you should seek professional or legal advice before trading. Investing in CFDs carries a high level of risk, as they are leveraged products and have small movements Often the market can result in much larger movements in the value of your investment, and this can work against you or in your favor. Please ensure you fully understand the risks involved, taking into account investments objectives and level of experience, before trading and, if necessary, seek independent advice.