S&P 500 — US Large Cap Index
 FTSE 100 — UK Blue Chips
 Euro Stoxx 50 — Eurozone Leaders
 DAX 40 — German Equities
 CAC 40 — French Market Index
 Nikkei 225 — Japan Benchmark
 Hang Seng — Hong Kong Index
 Shanghai Composite — China Mainland
 ASX 200 — Australian Market
 TSX Composite — Canada Index
 Nifty 50 — India Large Cap
 STI Index — Singapore Market
 KOSPI — South Korea Index
 Bovespa — Brazil Equities
 JSE Top 40 — South Africa Index
 IPC Index — Mexico Market
Nasdaq 100 rebounds as earnings and lower yields restore risk appetite – 4 interesting charts

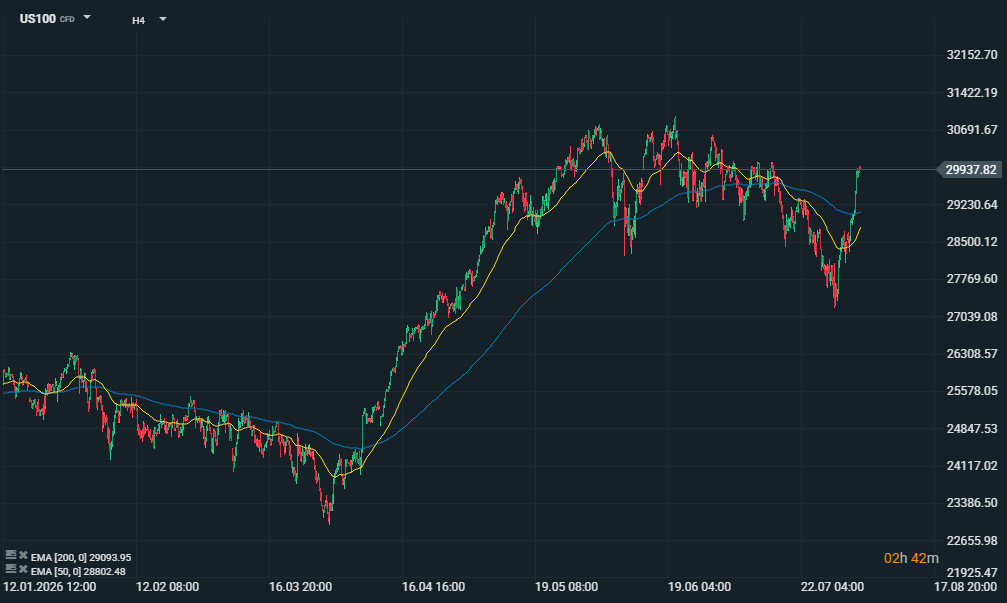
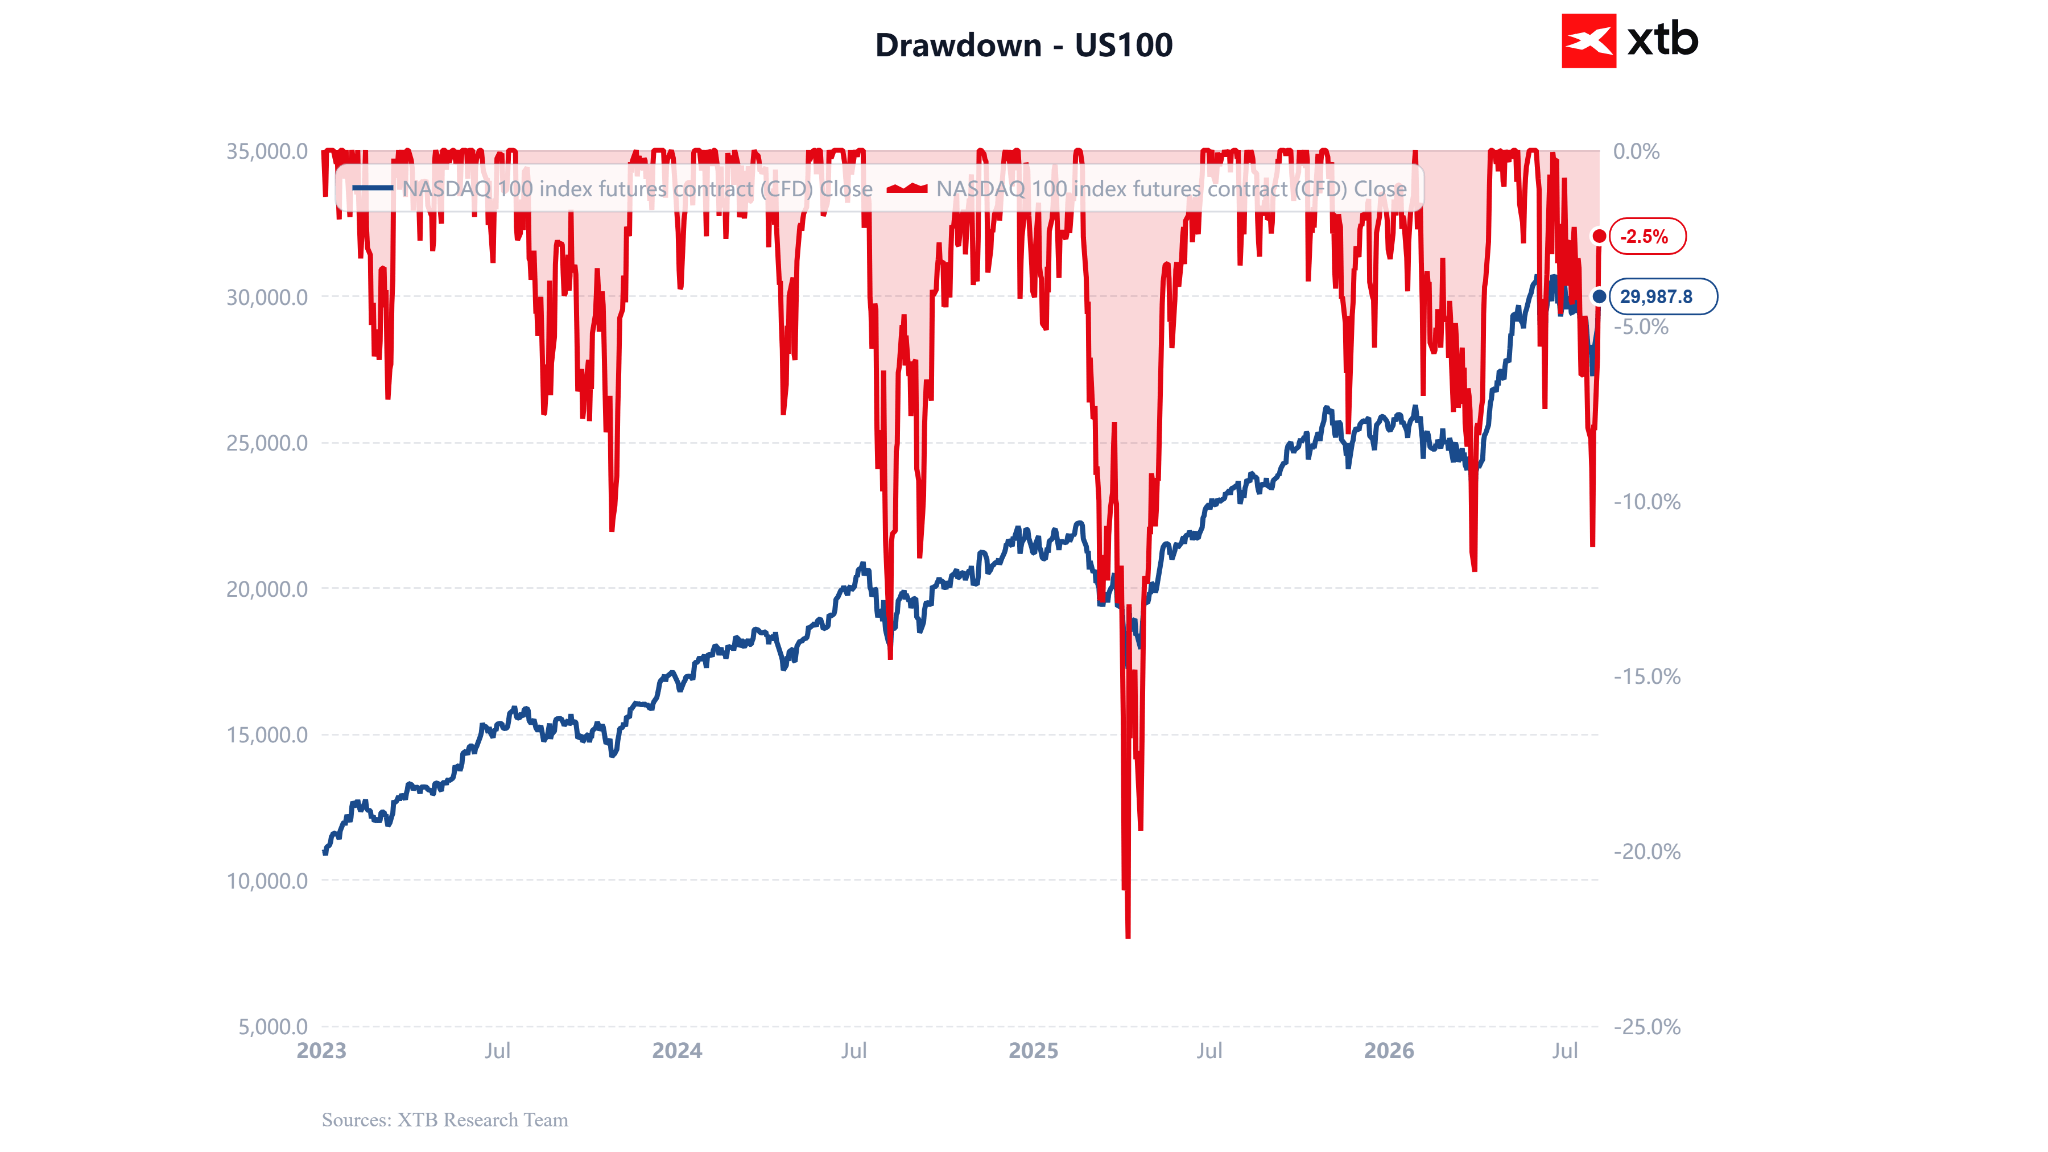
The Nasdaq 100 has staged a strong rebound after entering correction territory at the end of July. The technology-heavy index fell from its record high of 30,740 points, reached on June 2 , to 27,257 on July 29 , before recovering to nearly 30,000 by August 5 . The recovery followed an 11.3% decline from the all-time high, which helped ease stretched valuations and reduce some of the excessive positioning that had built up in AI and semiconductor stocks.
Nasdaq 100 Drawdown
Strong earnings results and upgraded guidance from companies such as Palantir , Amazon , and the leading cloud service providers reassured investors that AI-related spending continues to translate into higher revenues, stronger demand for cloud services, and ongoing data center expansion. Palantir’s strong outlook, together with improving demand driven by data center projects, also helped broaden the recovery beyond the traditional semiconductor names. AI-related earnings and improved corporate guidance have been among the key drivers behind the recent rebound in the technology sector.
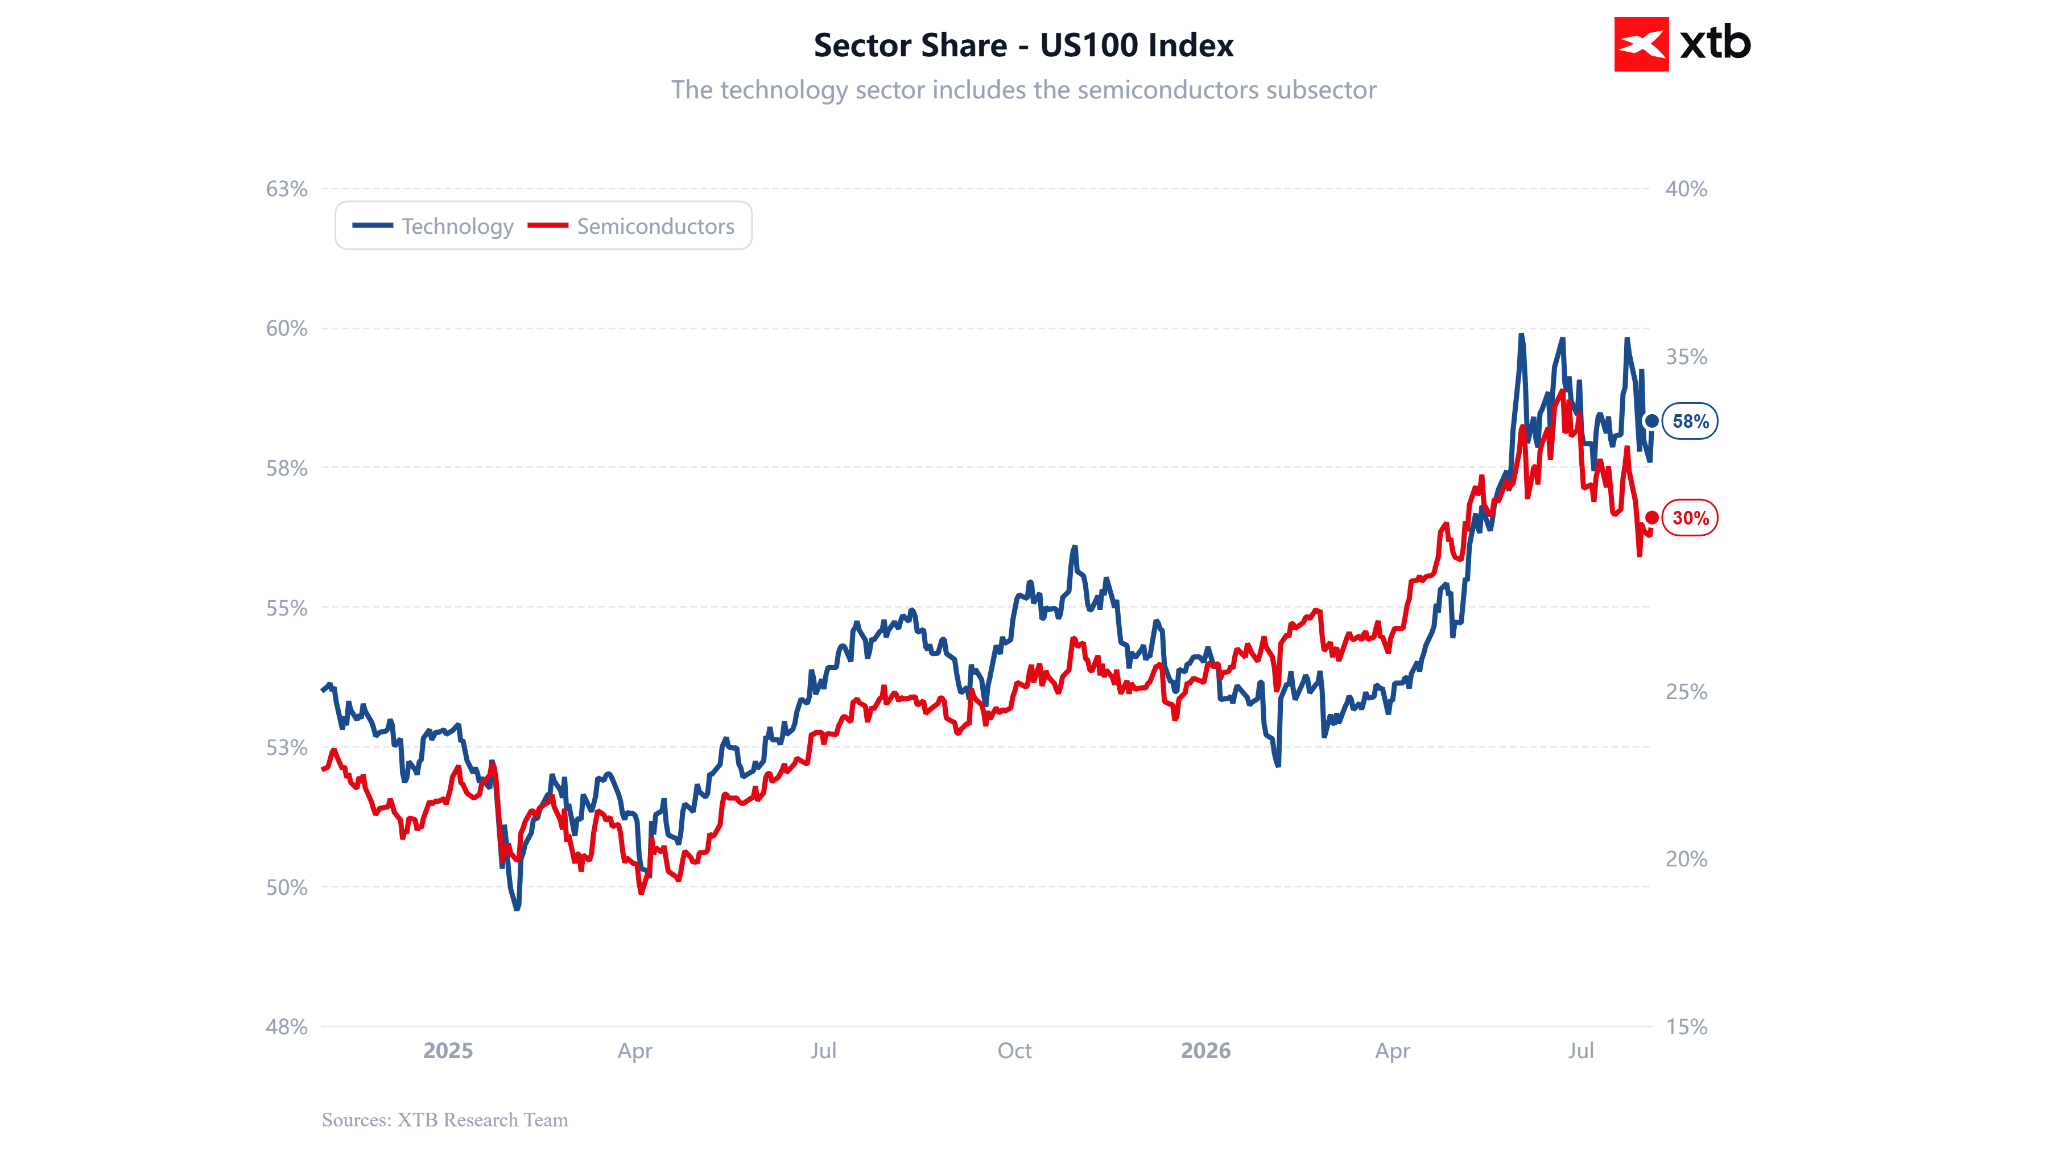
Technology and Semiconductor Sector Concentration
Technology companies account for approximately 58.3% of the Nasdaq 100’s total market capitalization, highlighting the index’s strong sensitivity to changes in expectations surrounding the digital economy and artificial intelligence. Semiconductor companies alone represent roughly 30.2% of the index’s total market capitalization. The semiconductor weighting climbed to nearly 34% in June before falling below 29% during the July correction. On one hand, this modest reduction in concentration can be viewed as a positive sign of diversification. On the other hand, the sector’s still-elevated weighting underscores how heavily the entire index depends on semiconductor stocks. This concentration helps explain the Nasdaq 100’s price dynamics: improving expectations for AI infrastructure can quickly lift the index, while disappointing semiconductor demand or weaker returns on AI investment could trigger an equally sharp downside move.
AI-Related Job Openings in the U.S. Labor Market
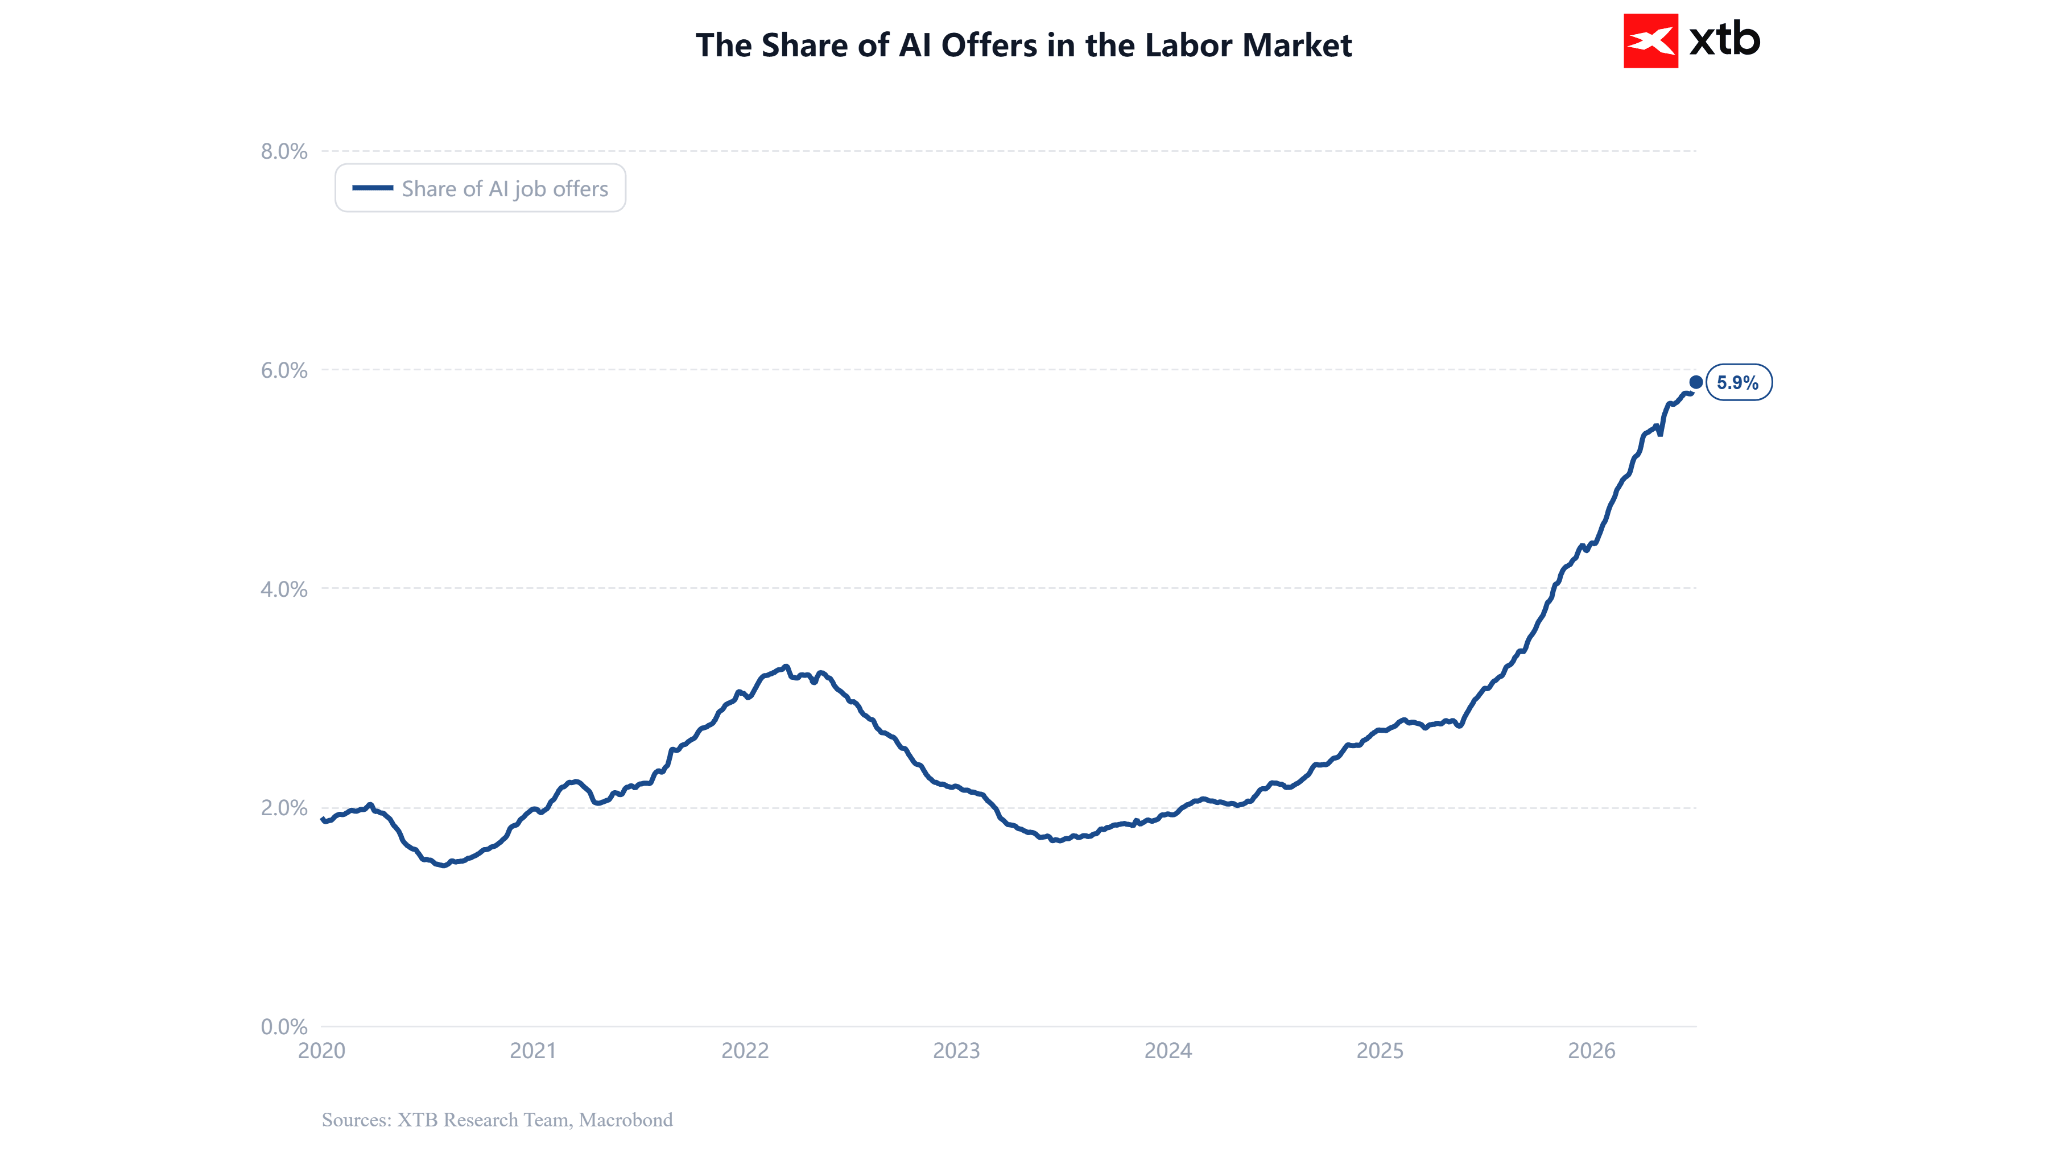
Strong demand for artificial intelligence is also evident beyond financial markets. AI-related positions accounted for approximately 5.9% of all U.S. job postings in June 2026 , up from 4.4% at the beginning of the year, 2.7% in January 2025 , and roughly 1.9% at the start of 2020 . This trend suggests that companies are moving beyond the experimental phase of AI adoption and are increasingly hiring employees to develop, deploy, and maintain AI-powered products and business processes.
Nasdaq 100 Market Breadth
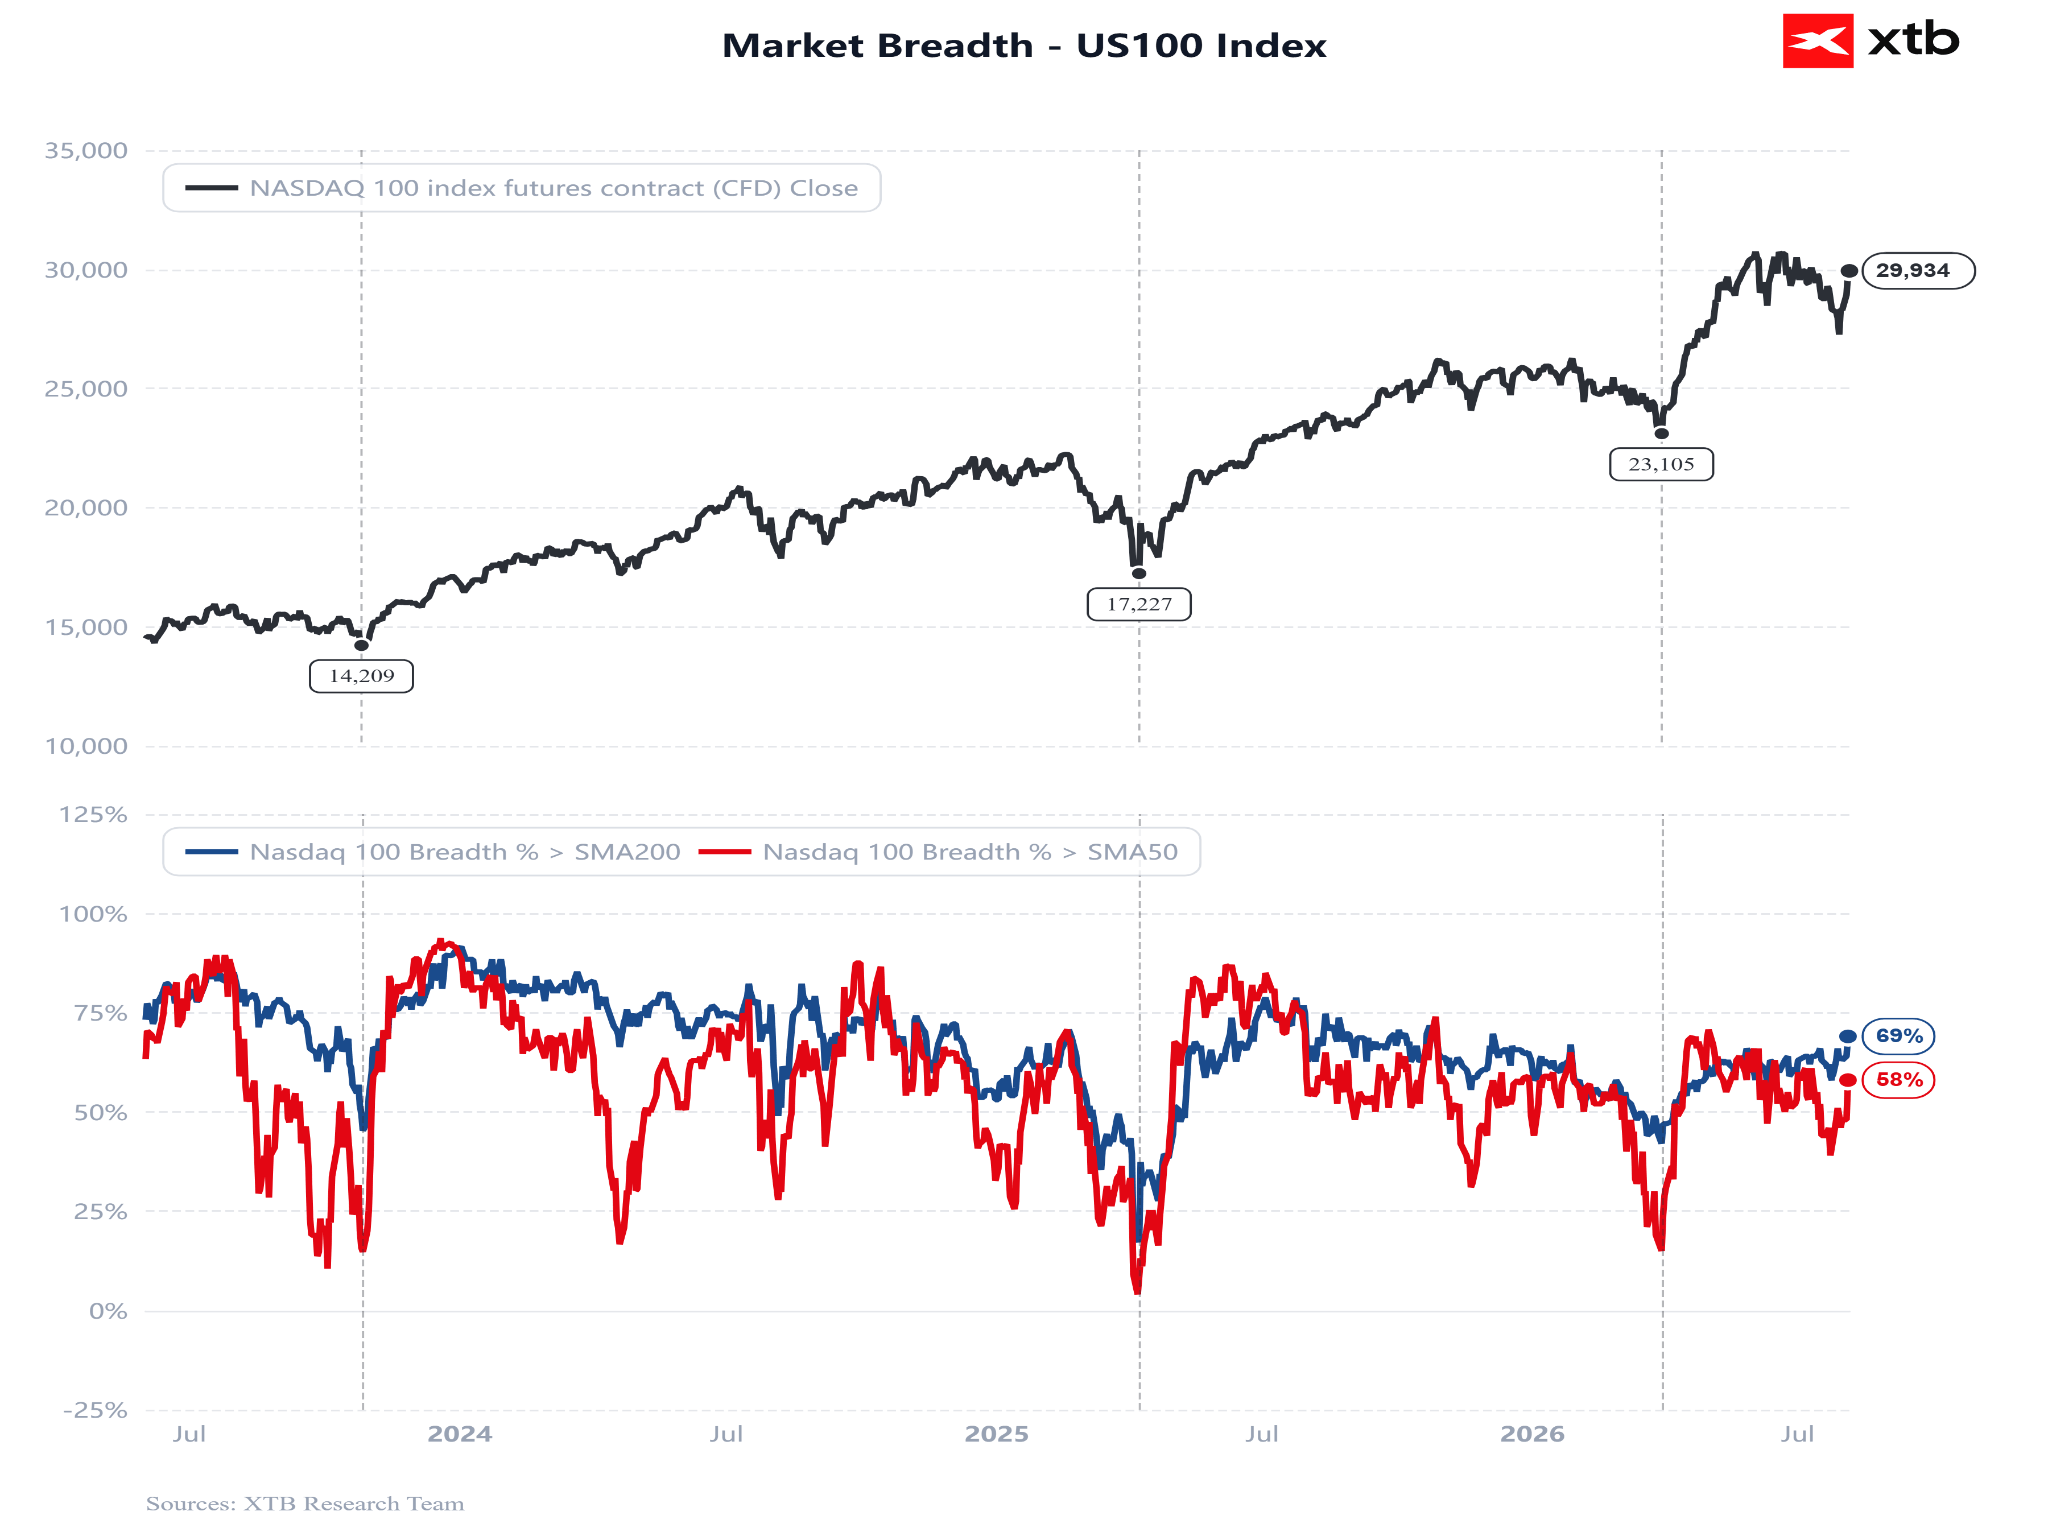
As of August 4 , approximately 69% of Nasdaq 100 constituents were trading above their 200-day moving averages , up from 58% at the recent market low. At the same time, the percentage of stocks trading above their 50-day moving averages increased from 39% on July 23 to 58% . This improvement suggests that the rebound is not being driven solely by a handful of mega-cap technology companies. A broader share of the index is participating in the rally, increasing its sustainability. Nevertheless, 42% of the index’s constituents still remain below their 50-day moving averages, indicating that while short-term market conditions have improved, the uptrend has not yet become fully broad-based.
Second-quarter earnings season has been exceptionally strong so far, but investor expectations remain extremely high. Companies may report robust growth and still see their share prices decline if their guidance, profit margins, or returns on AI-related investments fail to exceed already optimistic market expectations.