S&P 500 — US Large Cap Index
 FTSE 100 — UK Blue Chips
 Euro Stoxx 50 — Eurozone Leaders
 DAX 40 — German Equities
 CAC 40 — French Market Index
 Nikkei 225 — Japan Benchmark
 Hang Seng — Hong Kong Index
 Shanghai Composite — China Mainland
 ASX 200 — Australian Market
 TSX Composite — Canada Index
 Nifty 50 — India Large Cap
 STI Index — Singapore Market
 KOSPI — South Korea Index
 Bovespa — Brazil Equities
 JSE Top 40 — South Africa Index
 IPC Index — Mexico Market
One word keeps coming up in connection with the Nasdaq: “expensive.” And it’s hardly surprising, because when you look at the trailing price-to-earnings ratio, which is nearing 31, and add to that the price-to-sales ratio and EV/EBITDA, the picture does indeed look challenging. The problem is that the market isn’t always valued through the lens of the past. There are many dogmas in the financial market, and one of them is the view that an investor buying stocks today is paying not for the earnings that companies have already generated, but for those they are expected to generate in the future. And when we translate the valuation into earnings forecasts for the next twelve months, the narrative of an extremely overheated market begins to crumble somewhat.
Forward P/E: Another Benchmark
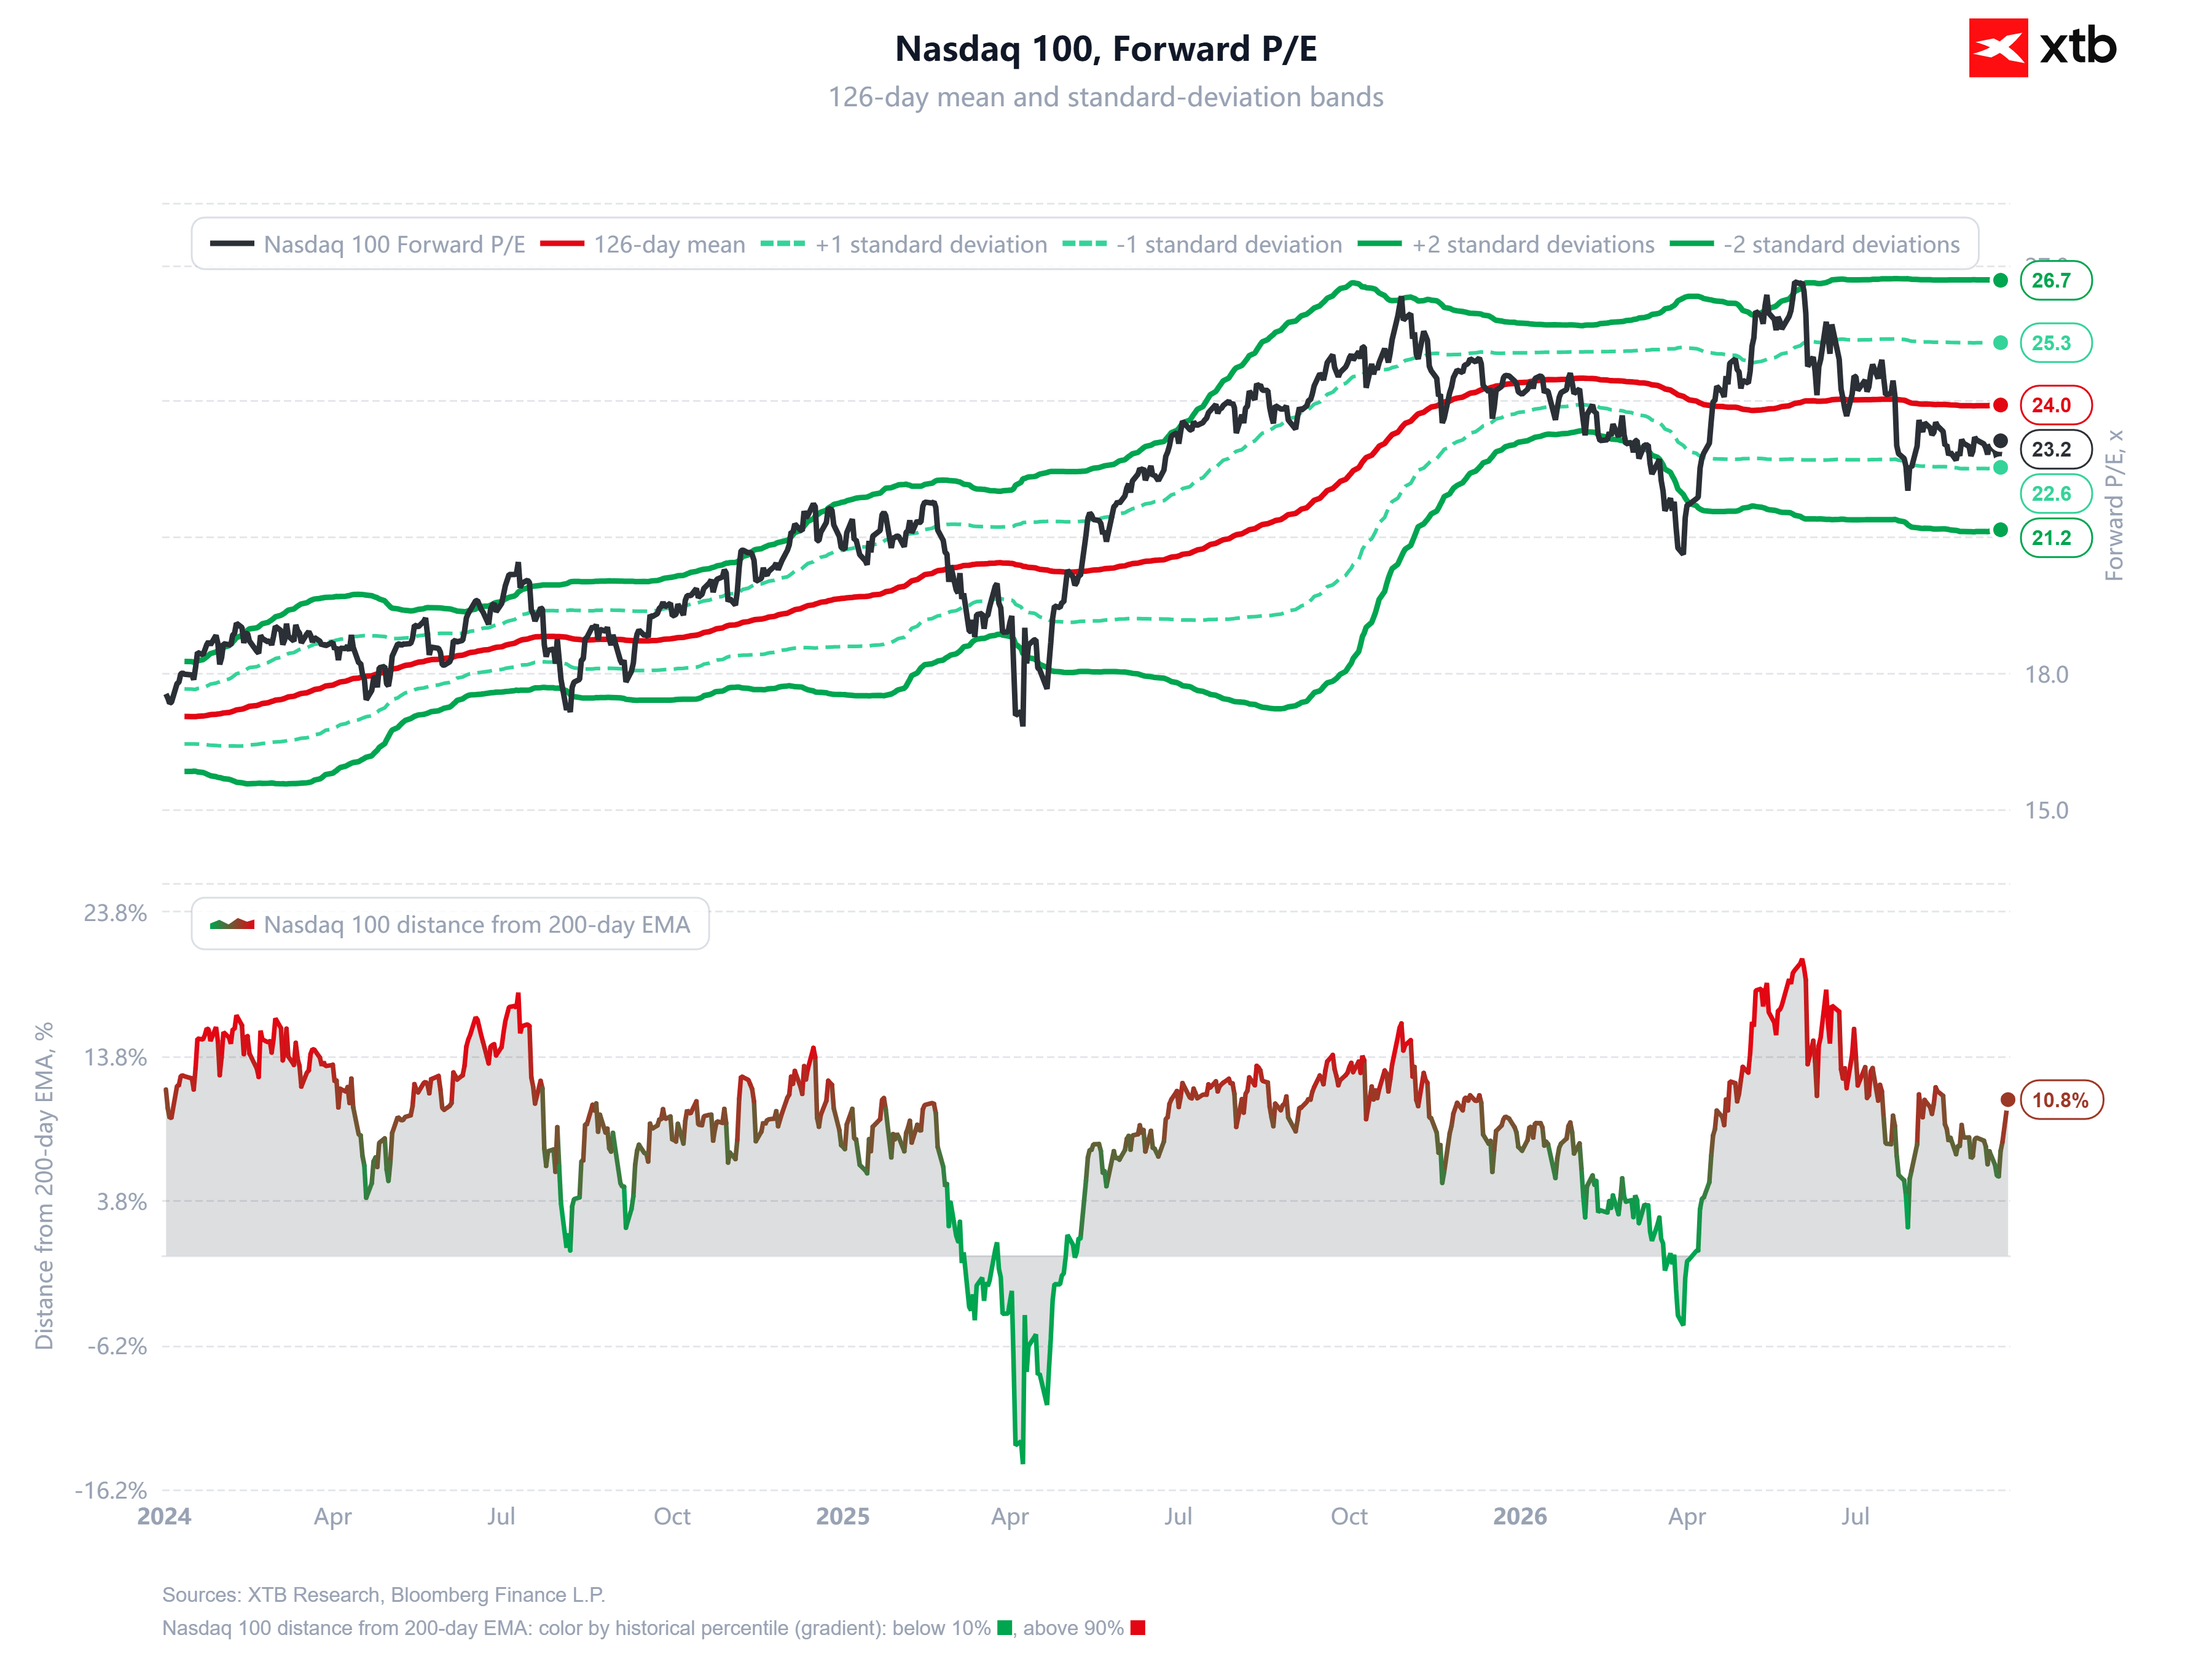
The key factor here is the Nasdaq 100’s forward P/E ratio, which currently stands at 23.2. This figure not only deviates significantly from the trailing 31, but more importantly, it is below its 126-session average of 24.0. In other words, relative to its own history over the past six months, the index is trading at a “fair” price—or even slightly below average—rather than at an extreme. The standard deviation bands illustrate this well, as the upper limit of plus two standard deviations is only at 26.7, and plus one is at 25.3. The current level of 23.2 thus falls closer to the lower half of the band, between the average and the minus-one standard deviation level at 22.6. This is not a market that has broken free from the gravitational pull of valuations. It is a market that remains within its statistical corridor, driven by the historical momentum of profit generation by U.S. companies. It’s worth noting the trends from recent quarters. In the spring of 2026, the forward P/E soared toward the upper band, brushing against plus two standard deviations, and that was the moment of genuine overheating. Since then, the ratio has cooled off and returned to around the average, even though the index itself remains near its highs. This situation—where the price is rising while the valuation ratio is stagnating or falling—means only one thing: the denominator, i.e., expected earnings, is catching up to the numerator.
Profits That Drive the Price
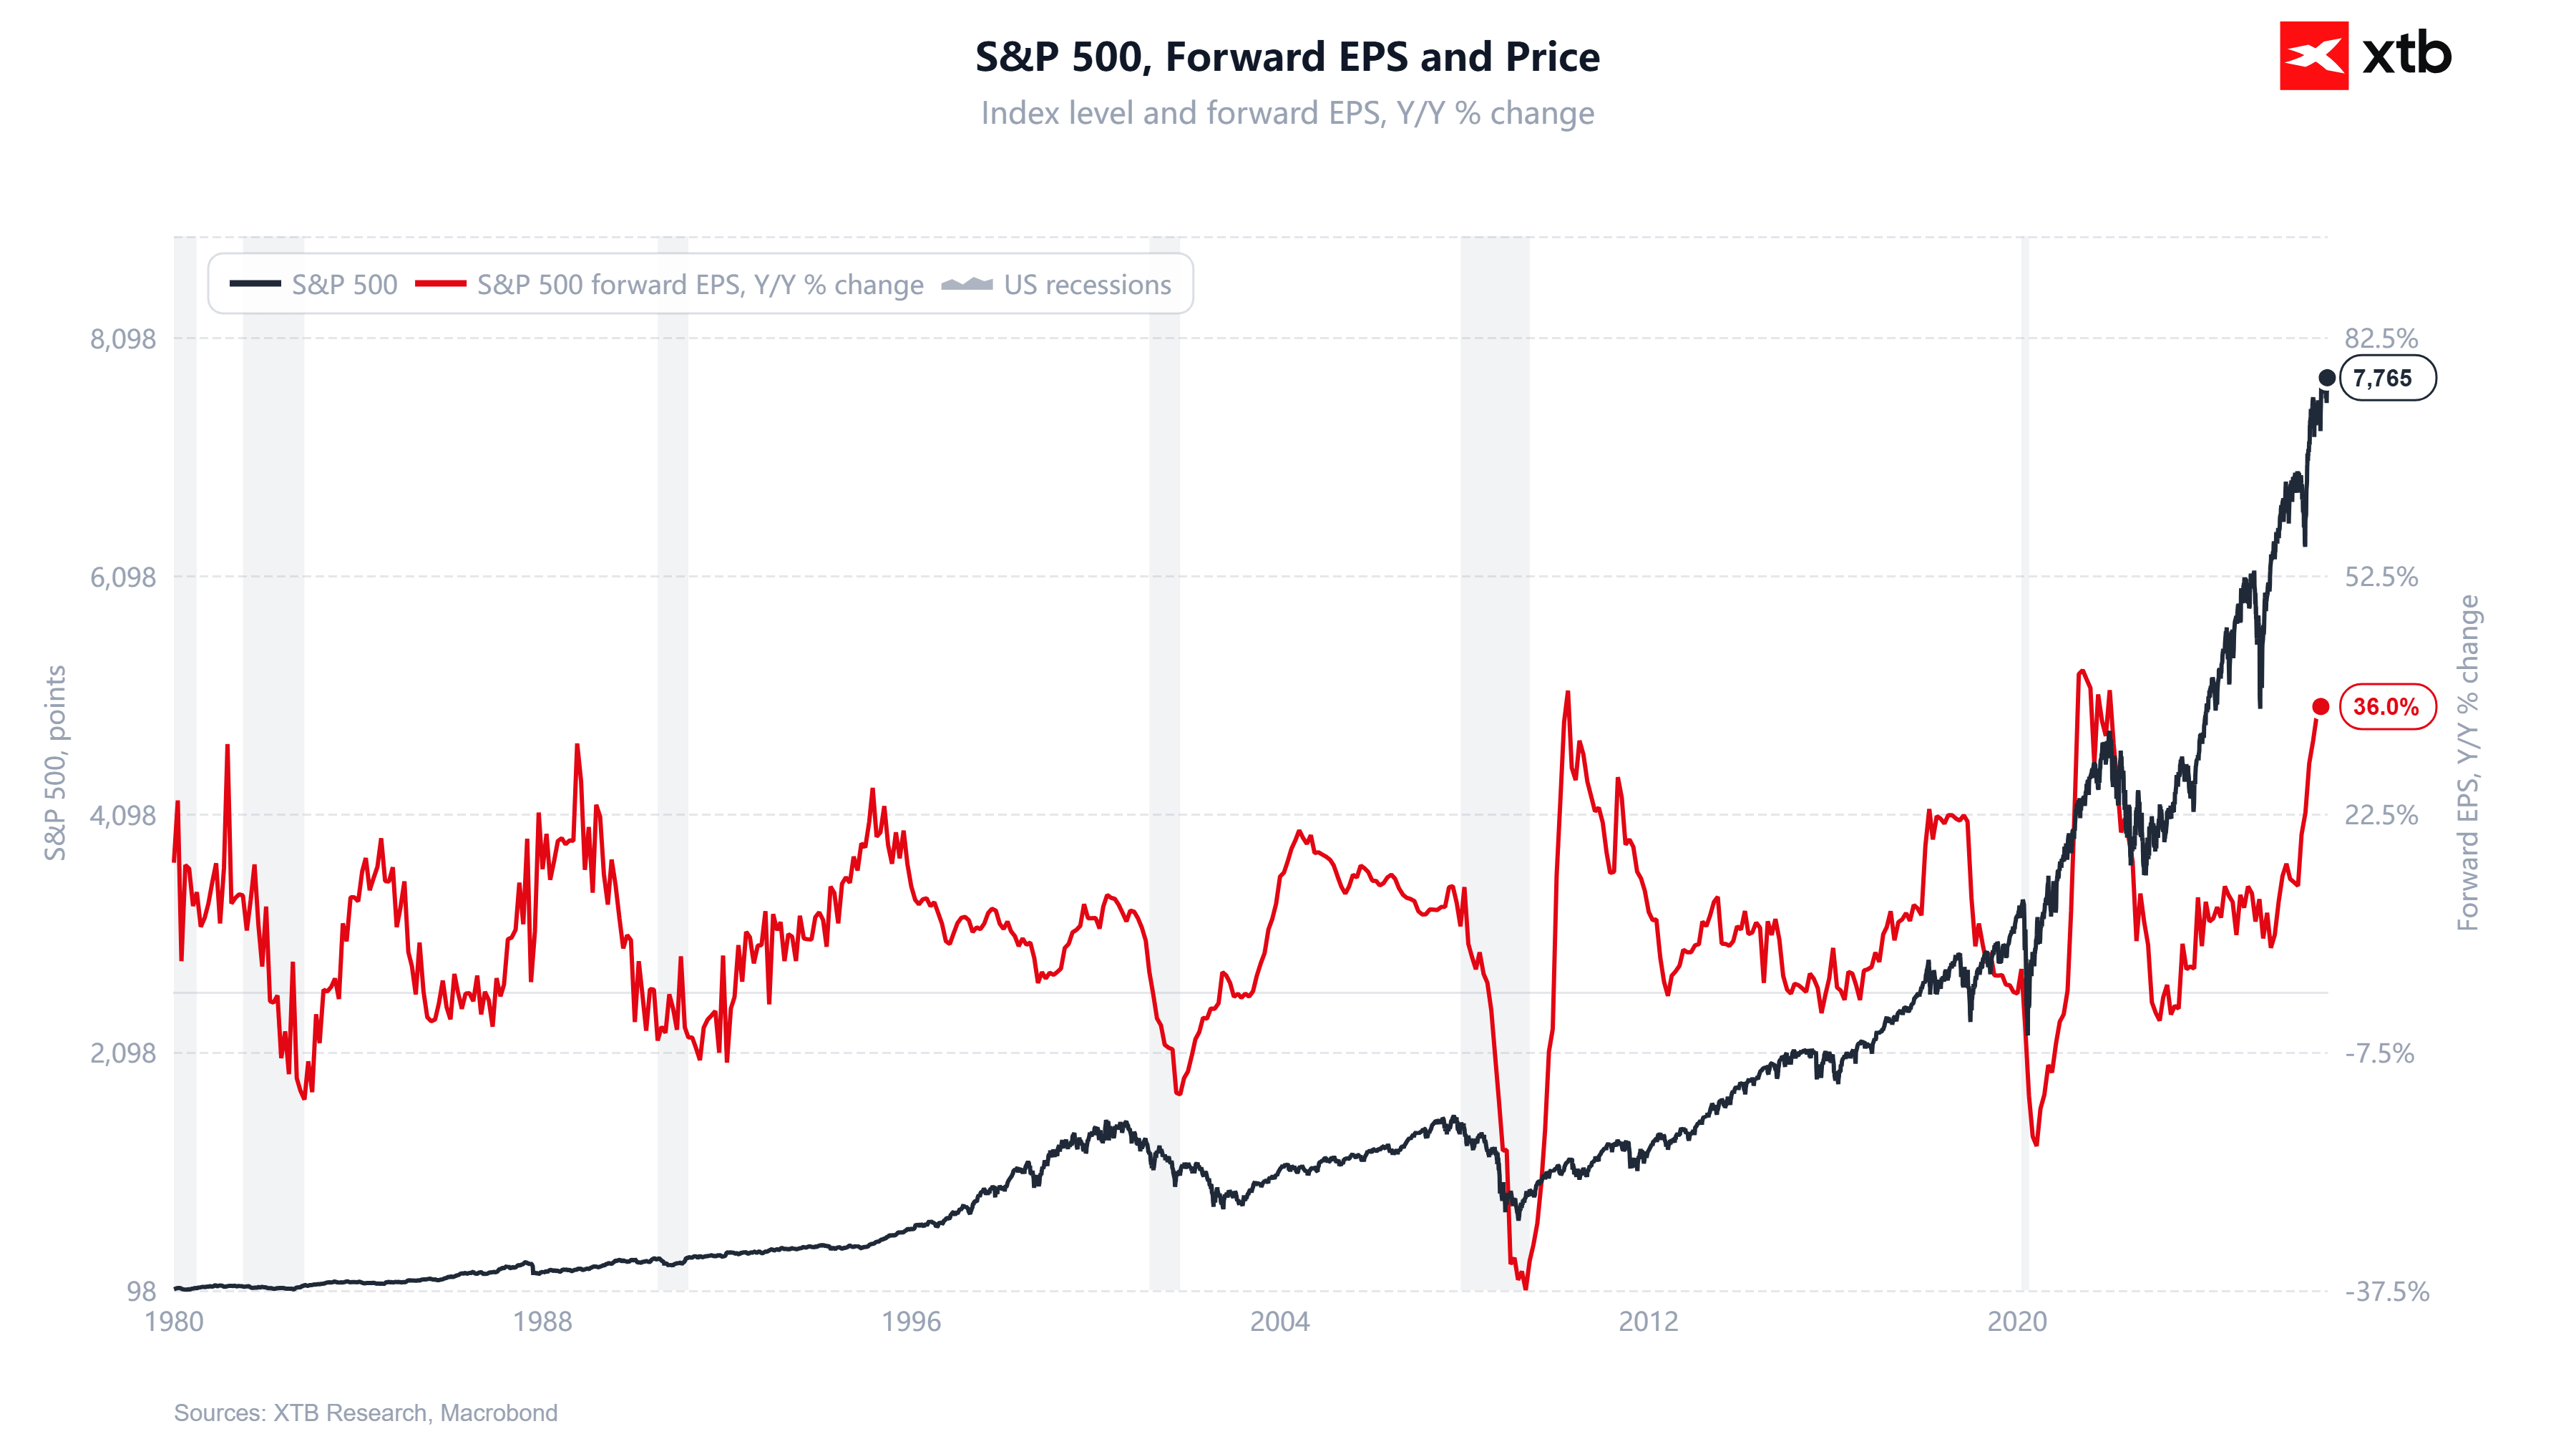
Here, from a slightly broader perspective, we’ll take a look at the S&P 500 index. A comparison of the index with projected earnings per share shows that forward EPS for U.S. companies is growing at a rate of 36 percent year-over-year. This is an extremely high figure, comparable to post-recession rebounds—except that this time, it’s happening without a recession in the background. The market today is not paying exorbitant prices for stagnant businesses, but is raising valuations in line with genuinely rising earnings expectations, driven largely by the investment cycle surrounding artificial intelligence. As long as this earnings momentum persists, high nominal multiples are at least partially justified. The risk only materializes when forecasts begin to be revised downward, because then today’s “reasonable” forward P/E will instantly become expensive, even without any price movement.
The Shadow in the Painting, or the Breadth of the Market
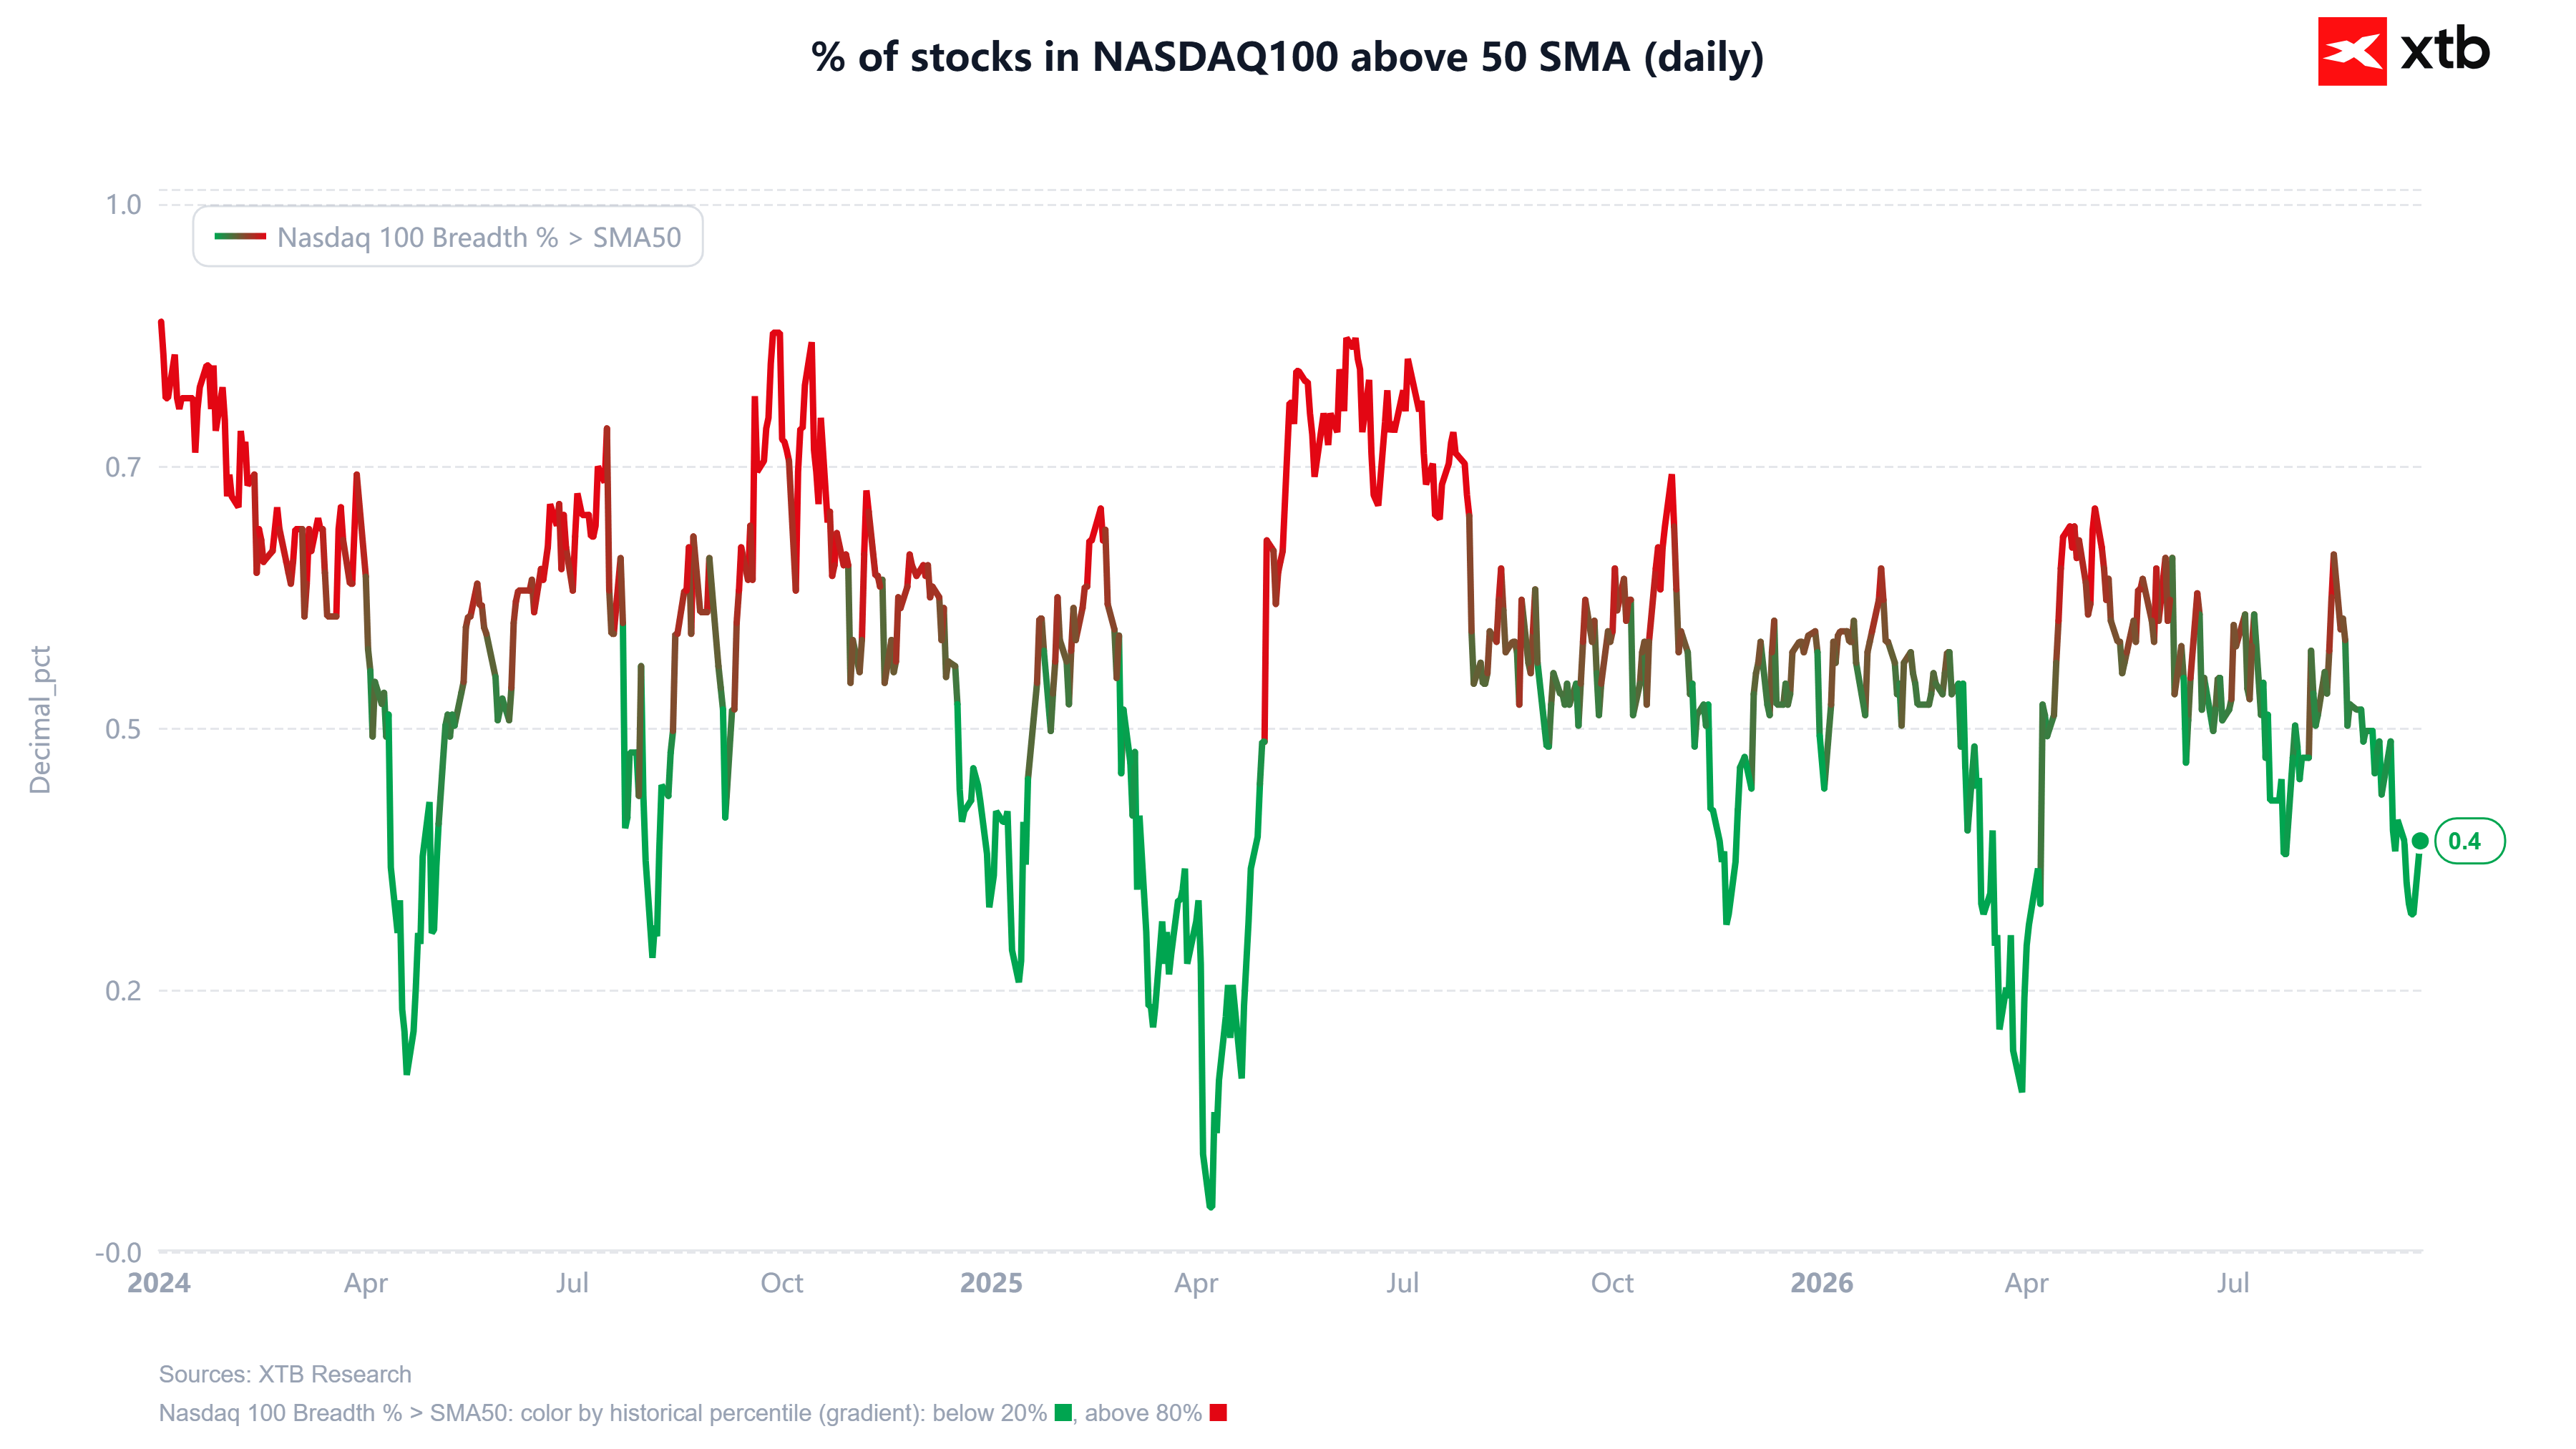
However, I would be dishonest if I were to focus solely on the optimistic side of the equation. The biggest cloud on this picture remains market breadth. The percentage of Nasdaq 100 companies trading above their 50-session moving average has fallen to just 40% and, importantly, is in the lower range of its historical distribution, as indicated by the green color of the indicator. This signals that the index’s strength is being driven by a narrow group of leaders, while the average company is performing significantly worse than the index level at its peaks would suggest. Such a divergence is not yet a sell signal, but it is a classic warning that the foundation of the rally is narrower than it appears at first glance. Additional context is provided by the index’s deviation from the 200-session exponential moving average, which currently stands at 10.8% and is in the upper, “hot” range of the distribution. This is not an extreme level like the one seen at the spring peak, but it is sufficient to justify a potential technical pullback or short-term correction.