S&P 500 — US Large Cap Index
 FTSE 100 — UK Blue Chips
 Euro Stoxx 50 — Eurozone Leaders
 DAX 40 — German Equities
 CAC 40 — French Market Index
 Nikkei 225 — Japan Benchmark
 Hang Seng — Hong Kong Index
 Shanghai Composite — China Mainland
 ASX 200 — Australian Market
 TSX Composite — Canada Index
 Nifty 50 — India Large Cap
 STI Index — Singapore Market
 KOSPI — South Korea Index
 Bovespa — Brazil Equities
 JSE Top 40 — South Africa Index
 IPC Index — Mexico Market

The summer is hurtling by, but this month has been crucial for assessing the main drivers of asset prices as we move through Q2. July has seen an abrupt shift in stock market leadership. The best performing indices for 2026 so far have been the worst performing sectors this month. The Kospi is down 23%, the Shenzen index in China is lower by 16%, and Japan’s Nikkei is down 9%. In contrast, the top performers include the FTSE 100, which is higher by 4% this month, the Dax and the Eurostoxx banking index, which is higher by 5.71% this month.
European banks have also been one of the top performing indices this year, and the fact that they have sustained gains even when other top performers have sold off, suggests that demand for diversification outside of tech remains among investors. From a stock index perspective, European stocks have outperformed their Asian and US counterparts. Although there has been huge volatility in the AI trade, the Nasdaq composite index is only lower by 2% this month, while the Nasdaq 100 is down 5%. The weakest US indices this month included the Nasdaq Telecommunications Index and the Philadelphia Semiconductor index, which are lower by 19% and 18% respectively. The major recovery in US tech stocks on Thursday, stopped these indices from falling into bear market territory. Without Thursday’s strong rally, the Nasdaq 100 was on course for correction territory.
This suggests two things as we move towards August:
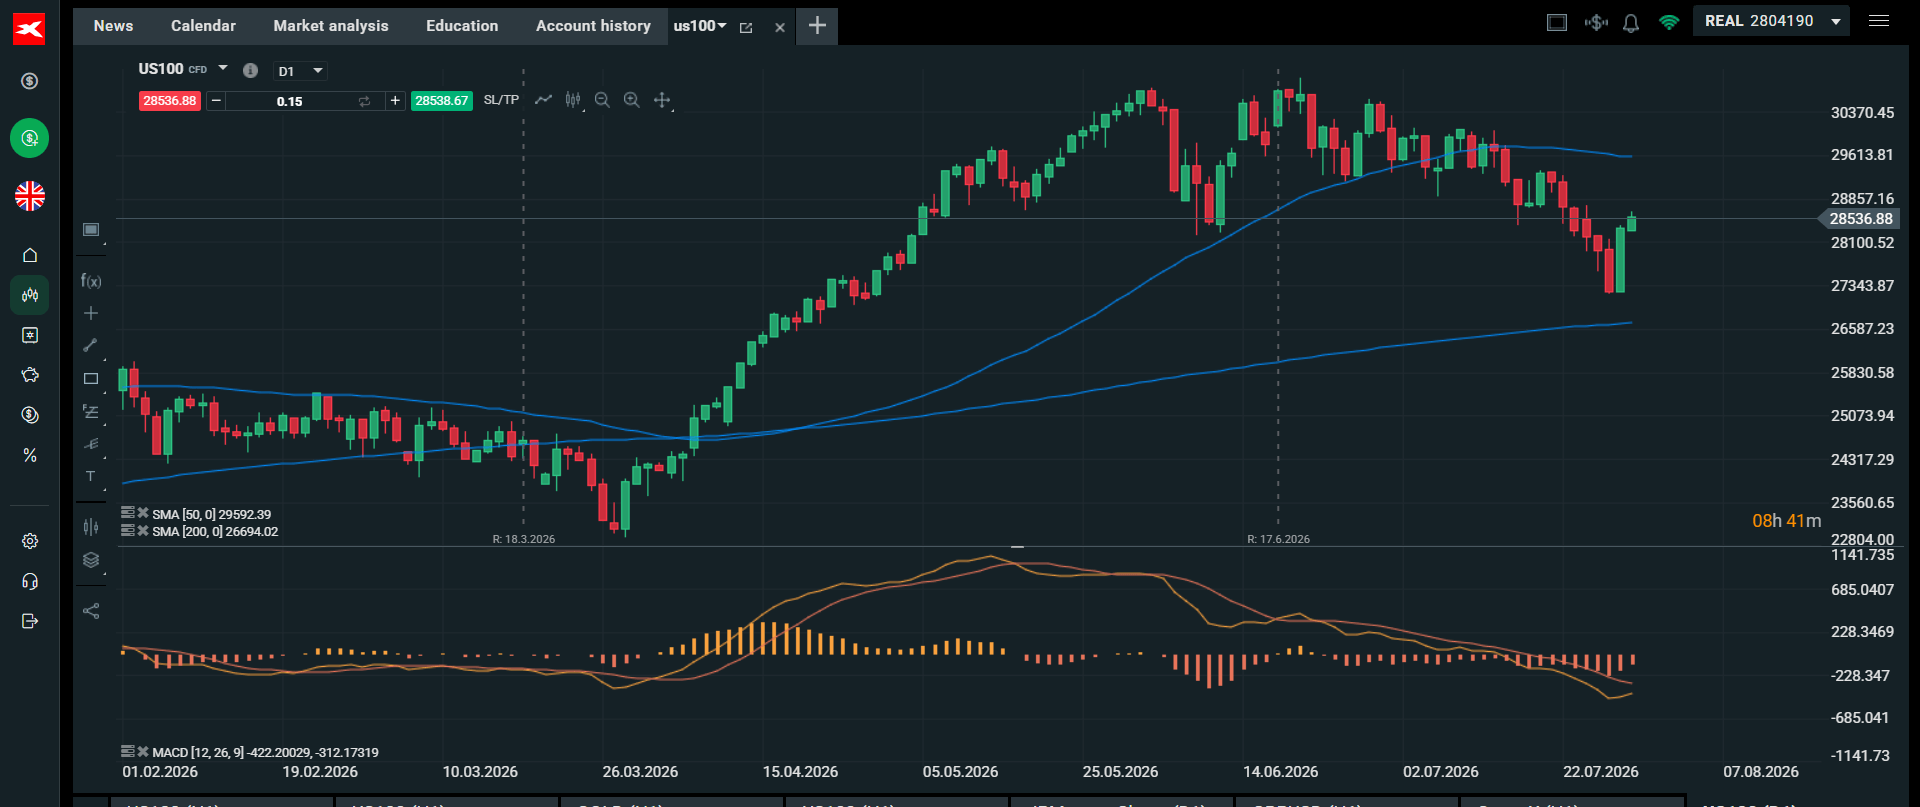
1, The AI trade is back on, but the leadership may rotate away from chip stocks and towards the hyperscalers that have evidence they can monetize their AI investments. While SanDisk and Micron were top performers on Thursday, Microsoft was the 7th best performer in the Nasdaq 100 yesterday. It has been a long time since Microsoft has led the Nasdaq 100 higher, and it could be a sign that the hyperscalers, which have sold off sharply this year, could make a comeback. Even Meta, which sold off sharply on Thursday after an underwhelming earnings report, is higher in the pre-market on Friday and is up 1%, so far. 2, Earnings season is having a major impact on the direction of markets as we move through Q3. Next week we will see a flurry of earnings reports, including SpaceX, which will also be important for sentiment towards the index. Thus, although European indices have had a strong run, the Eurostoxx 600 and the FTSE 100 have all made record highs this week, we could see US tech make a comeback as investors focus on earnings data. From a technical perspective, the Nasdaq 100 has moved well away from 200-day sma support at 26,690. The next major level of resistance that this index needs to clear is the 50-day sma at 29,590. Momentum indicators are moving into positive territory, although the MACD is not yet in oversold territory.
European indices remain resilient to energy price spike
While European equity strength is not the main story as we end July, it is remarkable how well the European indices have performed even though the Brent crude oil price has risen by 20% in the past month, central bankers remain concerned about inflation risks, and market-based interest rates have risen sharply. We believe that European stocks have been resilient in the face of these threats for one main reason, the oil price is high, but it is not in disaster territory and has not scaled back to $100 per barrel. This means that on an average basis the oil price is at a moderate level, which is easier for European corporates to absorb.
Q2 Earnings season round up: Europe:
So far, Eurostoxx 600 earnings are running well ahead of expectations, for those companies that have already reported results, headline EPS growth is 17%, well ahead of the 11% expected. Energy stocks are doing the heavy lifting, however, if you strip out energy the growth rate is a modest 7%. There is a fear that earnings growth will not be broad based. With 70% of the European index still to report, if earnings growth slips in the coming weeks, then we could see European stock struggle. US: earnings growth for the S&P 500 has been stunning so far, rising by 37% YoY, which is the fastest pace of growth since Q3 2021. Alphabet’s strong earnings report gave the earnings number a major boost last week, however, even if you strip out Alphabet, the growth rate is still a respectable 25%. Thus, as we move through Q3, we think that the focus could be on US earnings outperformance, which could give US stocks the edge for the rest of the summer.
Chart 1: Nasdaq 100