S&P 500 — US Large Cap Index
 FTSE 100 — UK Blue Chips
 Euro Stoxx 50 — Eurozone Leaders
 DAX 40 — German Equities
 CAC 40 — French Market Index
 Nikkei 225 — Japan Benchmark
 Hang Seng — Hong Kong Index
 Shanghai Composite — China Mainland
 ASX 200 — Australian Market
 TSX Composite — Canada Index
 Nifty 50 — India Large Cap
 STI Index — Singapore Market
 KOSPI — South Korea Index
 Bovespa — Brazil Equities
 JSE Top 40 — South Africa Index
 IPC Index — Mexico Market

Key takeaways
- WTI crude oil trades at 92.74 USD per barrel, up 61.96% year-to-date.
- Silver prices sit near 60 USD per ounce, registering a 5.85% weekly decline.
- Copper prices stand at 14 393 USD per metric ton, supported by strong supply deficits.
Commodities Market Overview
- Today’s session on the commodities markets brings a clear dominance of bearish sentiment, with only 6 out of 26 monitored assets recording gains. An average daily change of -0.78% reflects supply pressure, which hits the agricultural and soft commodities sectors the hardest.
- Among the assets suffering the largest losses, cotton and cocoa stand out, recording declines exceeding two percent.
- The only group showing clear gains remains precious metals, led by palladium and gold, which are attempting to recover from earlier weekly losses.
- At the same time, statistical indicators point to strong historical anomalies – copper and zinc remain significantly displaced upward from their five-year averages, which stands in contrast to deep price drops in lean hogs.
- The broader macroeconomic and geopolitical context, including reports of a potential US diesel export ban and the resumption of crude oil shipments by Saudi Arabia, raises concerns over the stability of global supply chains. In the near term, investors should closely monitor the rhetoric surrounding US energy policy and key technical support levels in the precious metals market amidst ongoing inflation fears.
- Higher crude oil prices, driven among other factors by tensions surrounding Iran and threats to regional infrastructure, exert pressure toward higher interest rates and on the currencies of energy-importing countries, while also affecting gold prices, which are testing local support levels.
- In the near term, investors should closely monitor geopolitical developments in the Middle East and their direct impact on fuel and energy prices, as also confirmed by comments from European Central Bank representatives.
- Also important for agricultural and industrial markets will be news regarding China’s trade policy toward US crops and local supply disruptions, such as the effects of Hurricane Polo in Mexico.
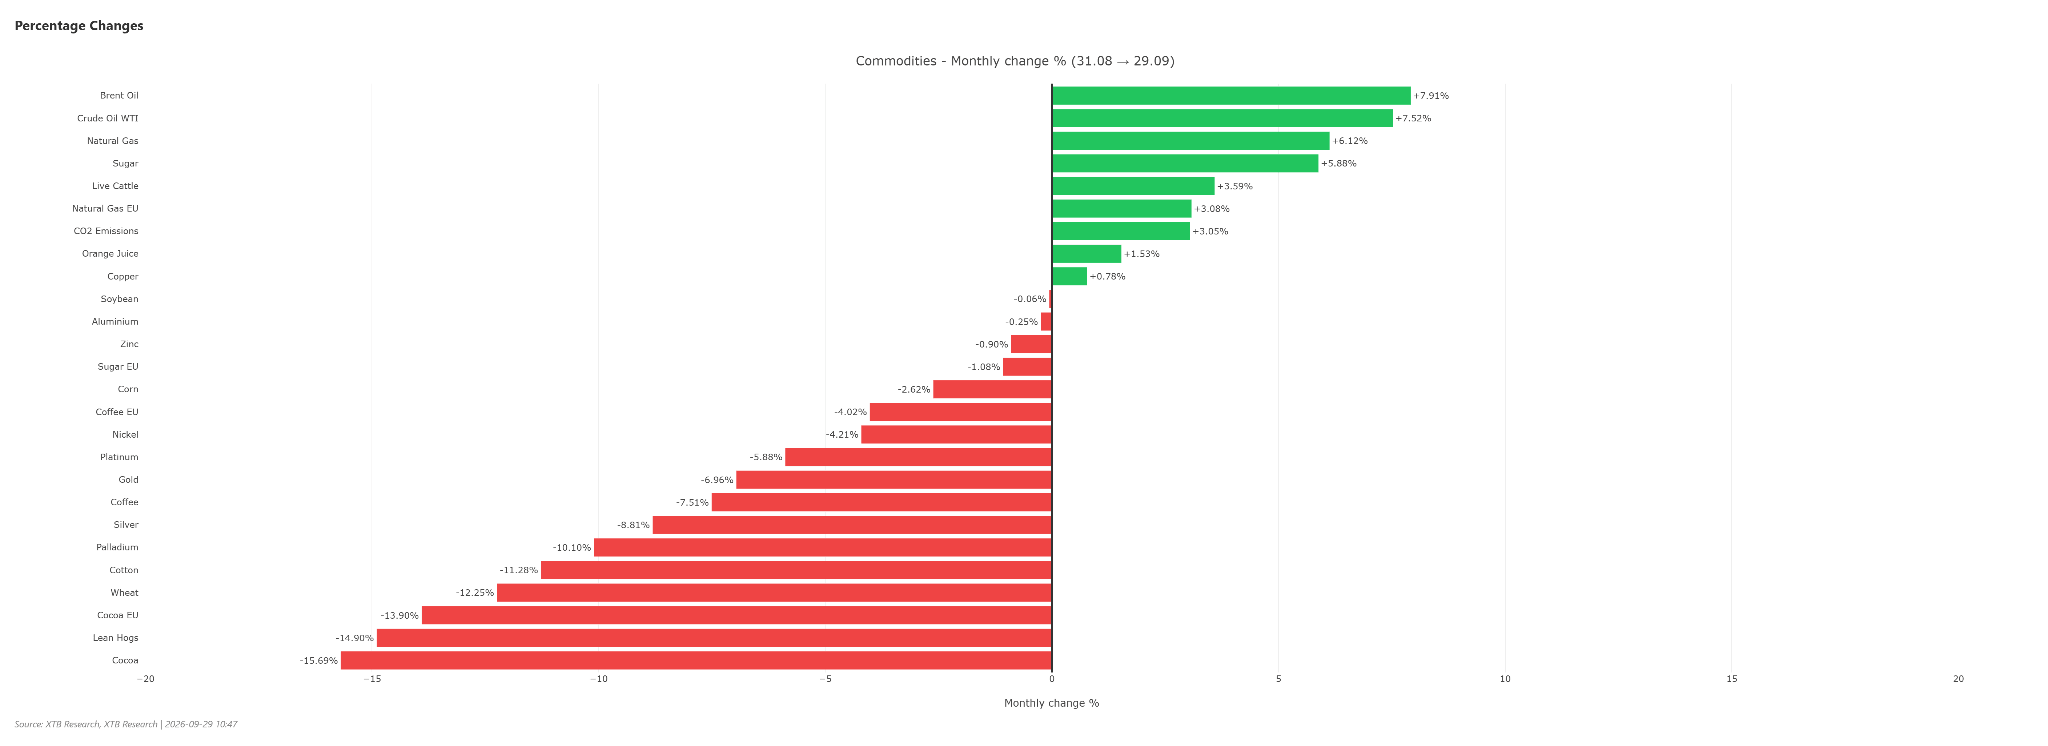
The past month brought a significant correction across commodities markets, outside the energy group. Sugar, live cattle, and orange juice also gained value. Source: XTB
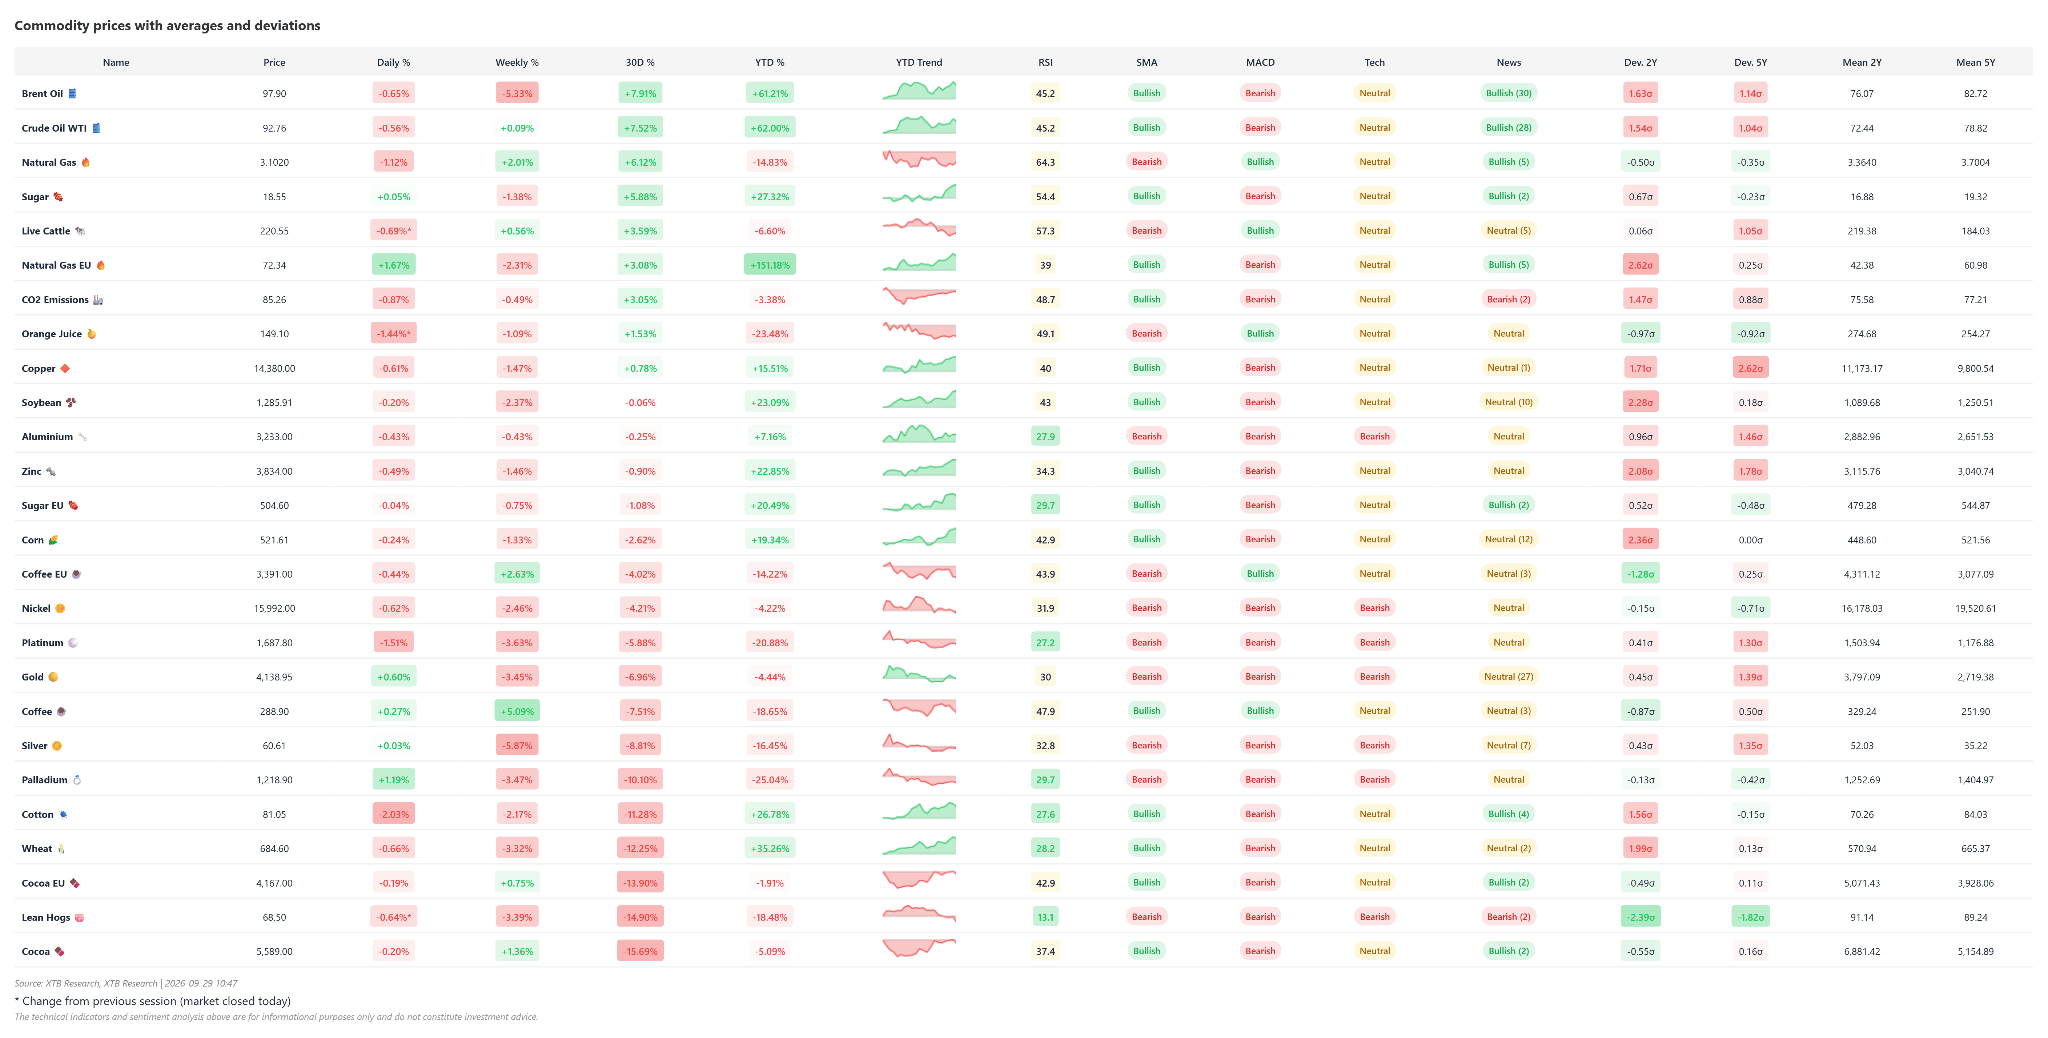
None of the commodities currently appear extremely overbought when looking at technical indicators like RSI, while many of them show a bearish bias looking at MACD. Source: XTB
Silver
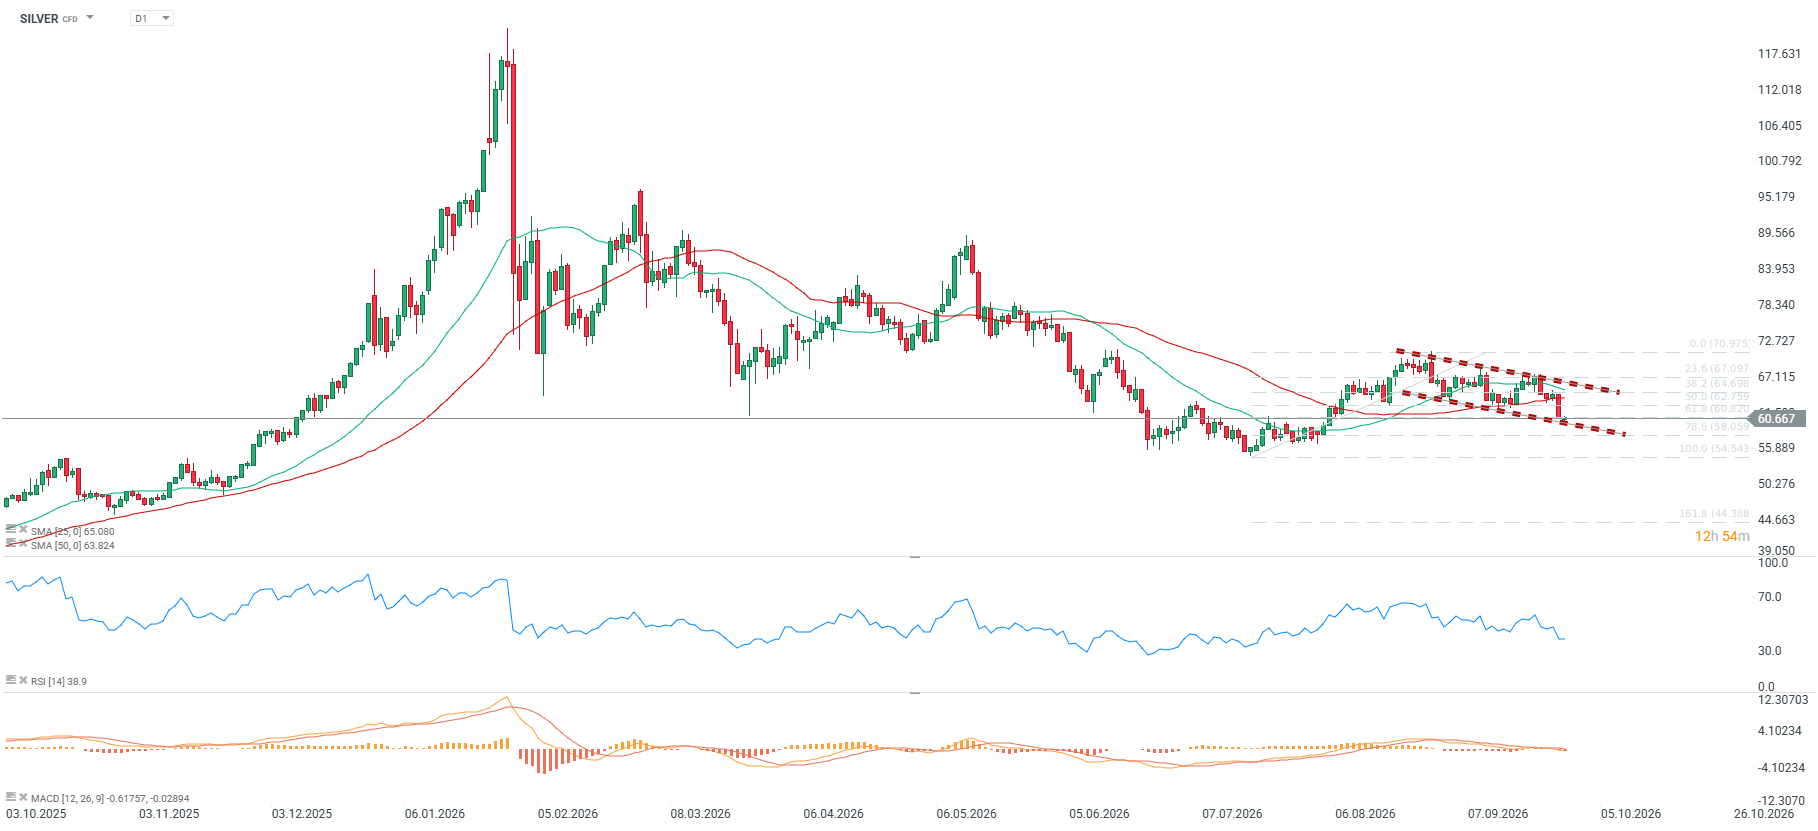
- The current price of silver is slightly over USD 60, registering a weekly decline of 5.85%, a monthly drop of 8.79%, and a YTD decline of 16.43%, along with a year-on-year growth of 30.03%.
- The RSI indicator reached a level of 33, bringing the market closer to oversold territory, and key technical indicators remain in a bearish setup with a bearish status on the SMA moving average, the MACD indicator generating sell signals, and the price sitting 5.01% below the 50-day moving average SMA50 under bearish sentiment.
- A breakdown below USD 62 per ounce at the 50.0 retracement level triggers a more bearish outlook in the short term, but holding USD 60 may still offer bulls a chance for medium-term upside.
Fundamental and Market Context
- Physical demand for silver is strengthening, as reflected in reports of rising demand for the precious metal on commodity exchanges. This is also evident in ETF funds, which maintain high silver holdings despite the recent sell-off on exchanges.
- The Federal Reserve’s restrictive monetary policy and sustained hawkish stance generate pressure on non-yielding assets in the face of multi-year highs in US Treasury yields.
- Despite this, institutional sentiment remains positive, primarily in the gold market.
- The global silver market faces direct macroeconomic pressure stemming from a combination of high interest rates and a restrictive credit environment. Credit growth in China is falling sharply, which could weigh on silver in the short term.
- The ongoing crisis in the Middle East region and associated high energy commodity prices generate a persistent inflationary impulse, affecting operating costs in the mining sector.
- Speculative fund positioning reflects a cautious stance toward the metal, as indicated by a percentile ranking of 47.3% with a long position share of 78.9%.
- The 8.79% monthly drop in silver prices coincides with deteriorating technical sentiment, bringing the RSI indicator down to 33 and pressuring key support levels.
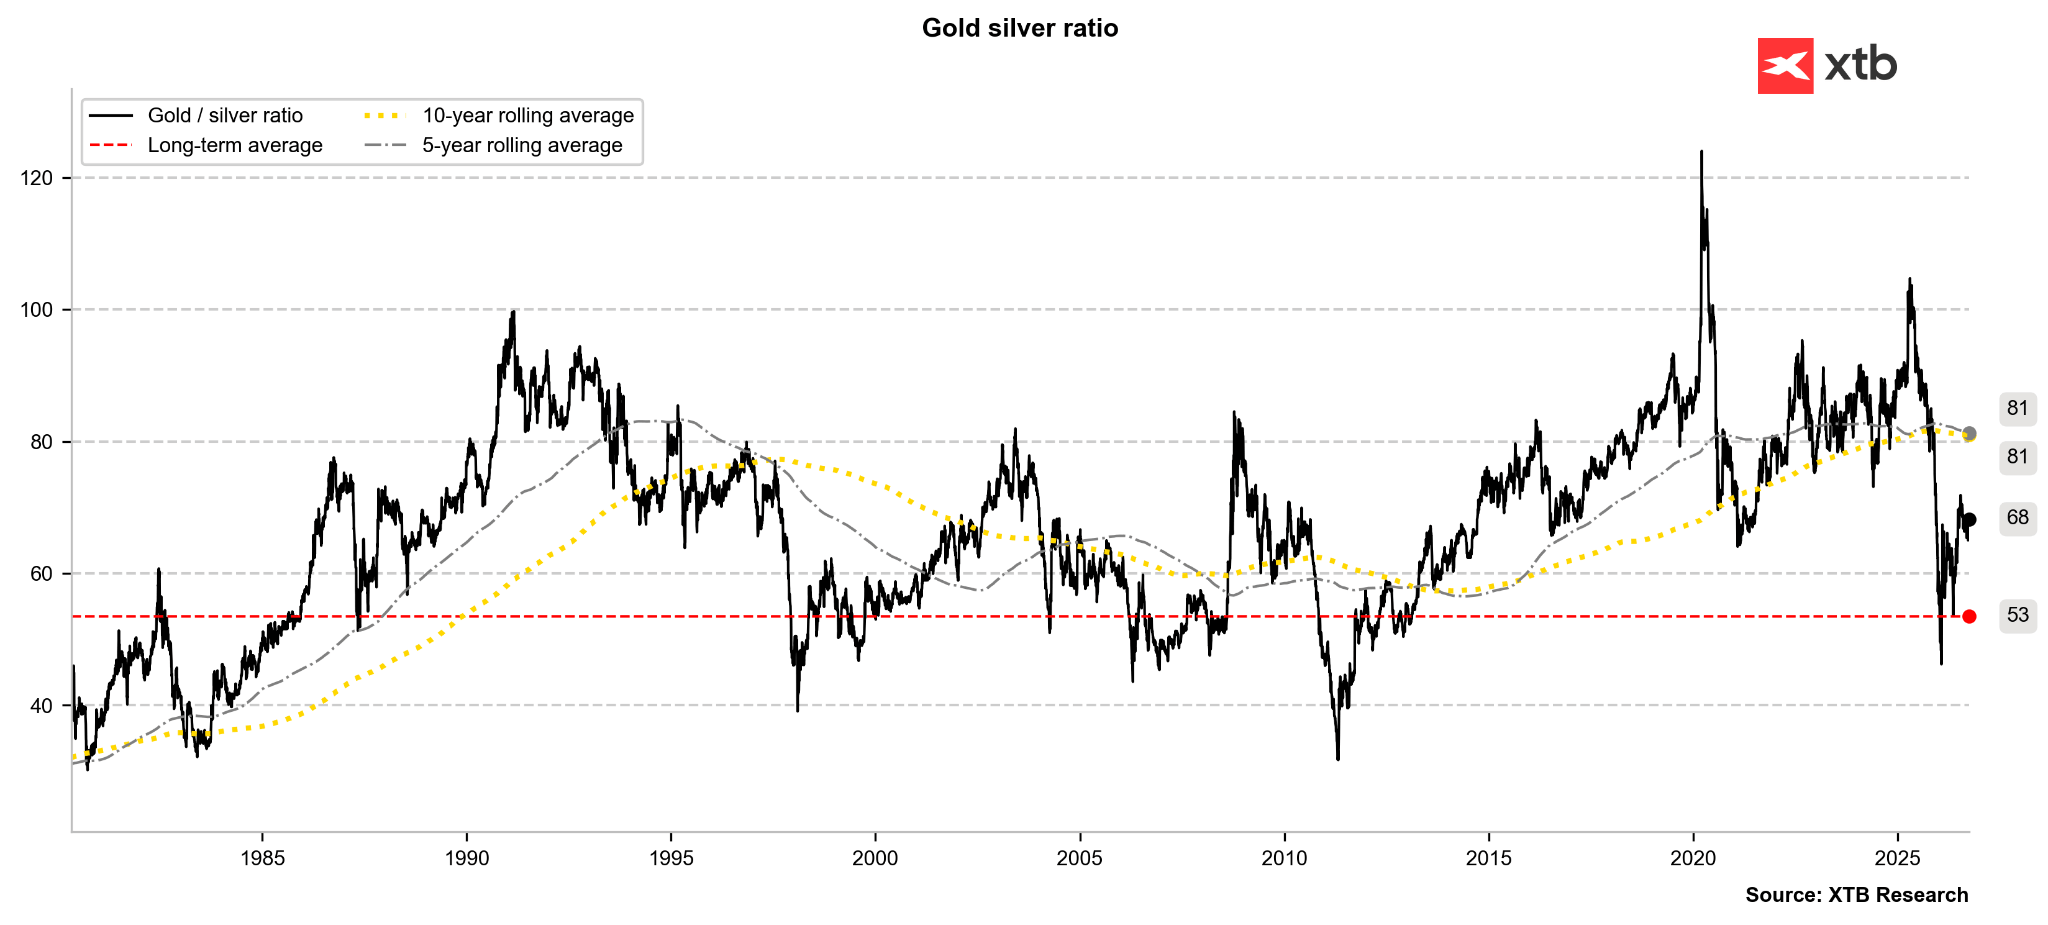
The gold-to-silver ratio remains elevated compared to a few months ago, but continued pressure from yields could push this ratio up to 70. At a gold price of USD 4,200 per ounce, silver would then be valued at exactly USD 60, meaning silver appears currently well valued. Source: Bloomberg Finance LP, XTB
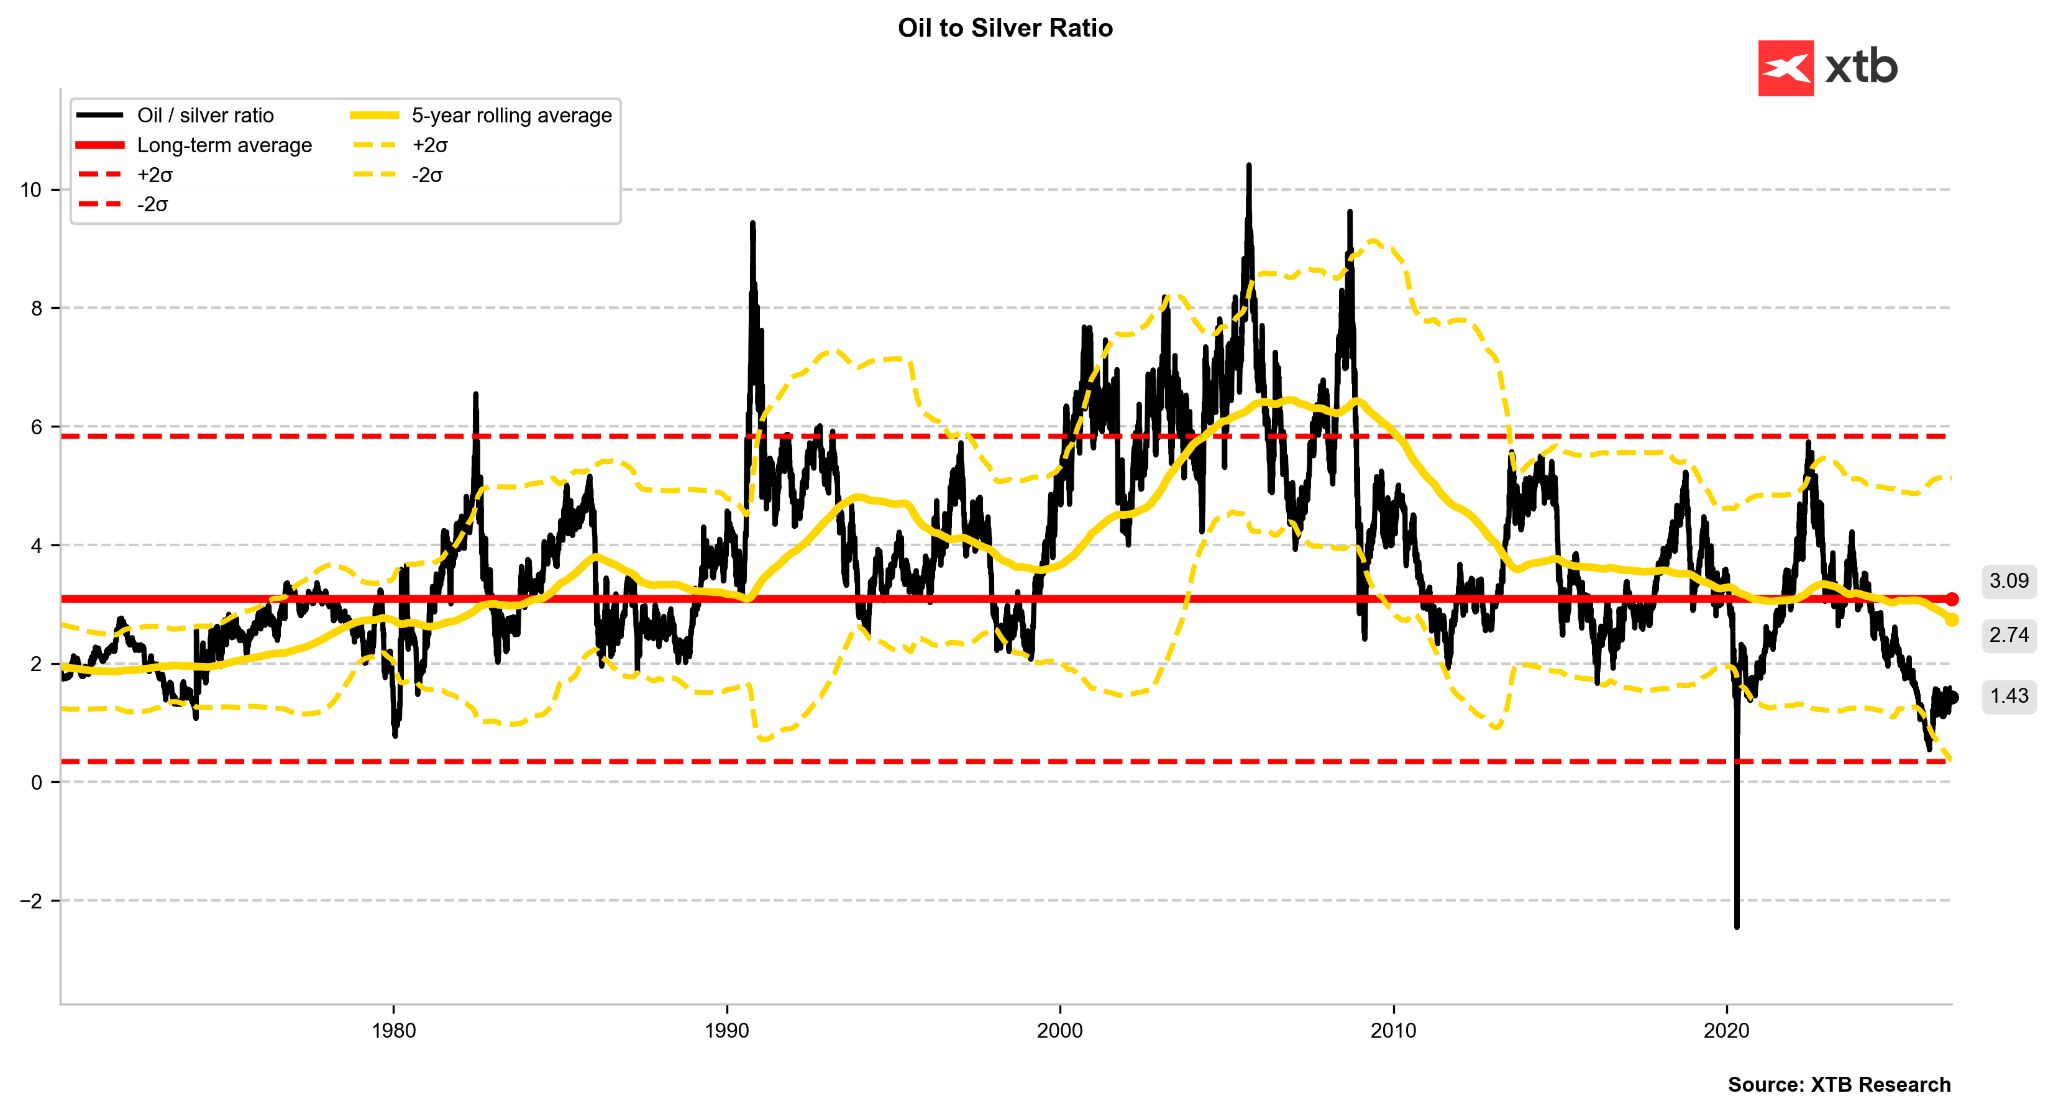
The oil-to-silver ratio remains low, somewhat reminiscent of the late 1970s. Back then, silver was recovering from a strong rebound in 1987 and subsequently pulled back for 5 years. In 1990, a sharp surge in oil prices drove the ratio up to 9. Source: Bloomberg Finance LP, XTB
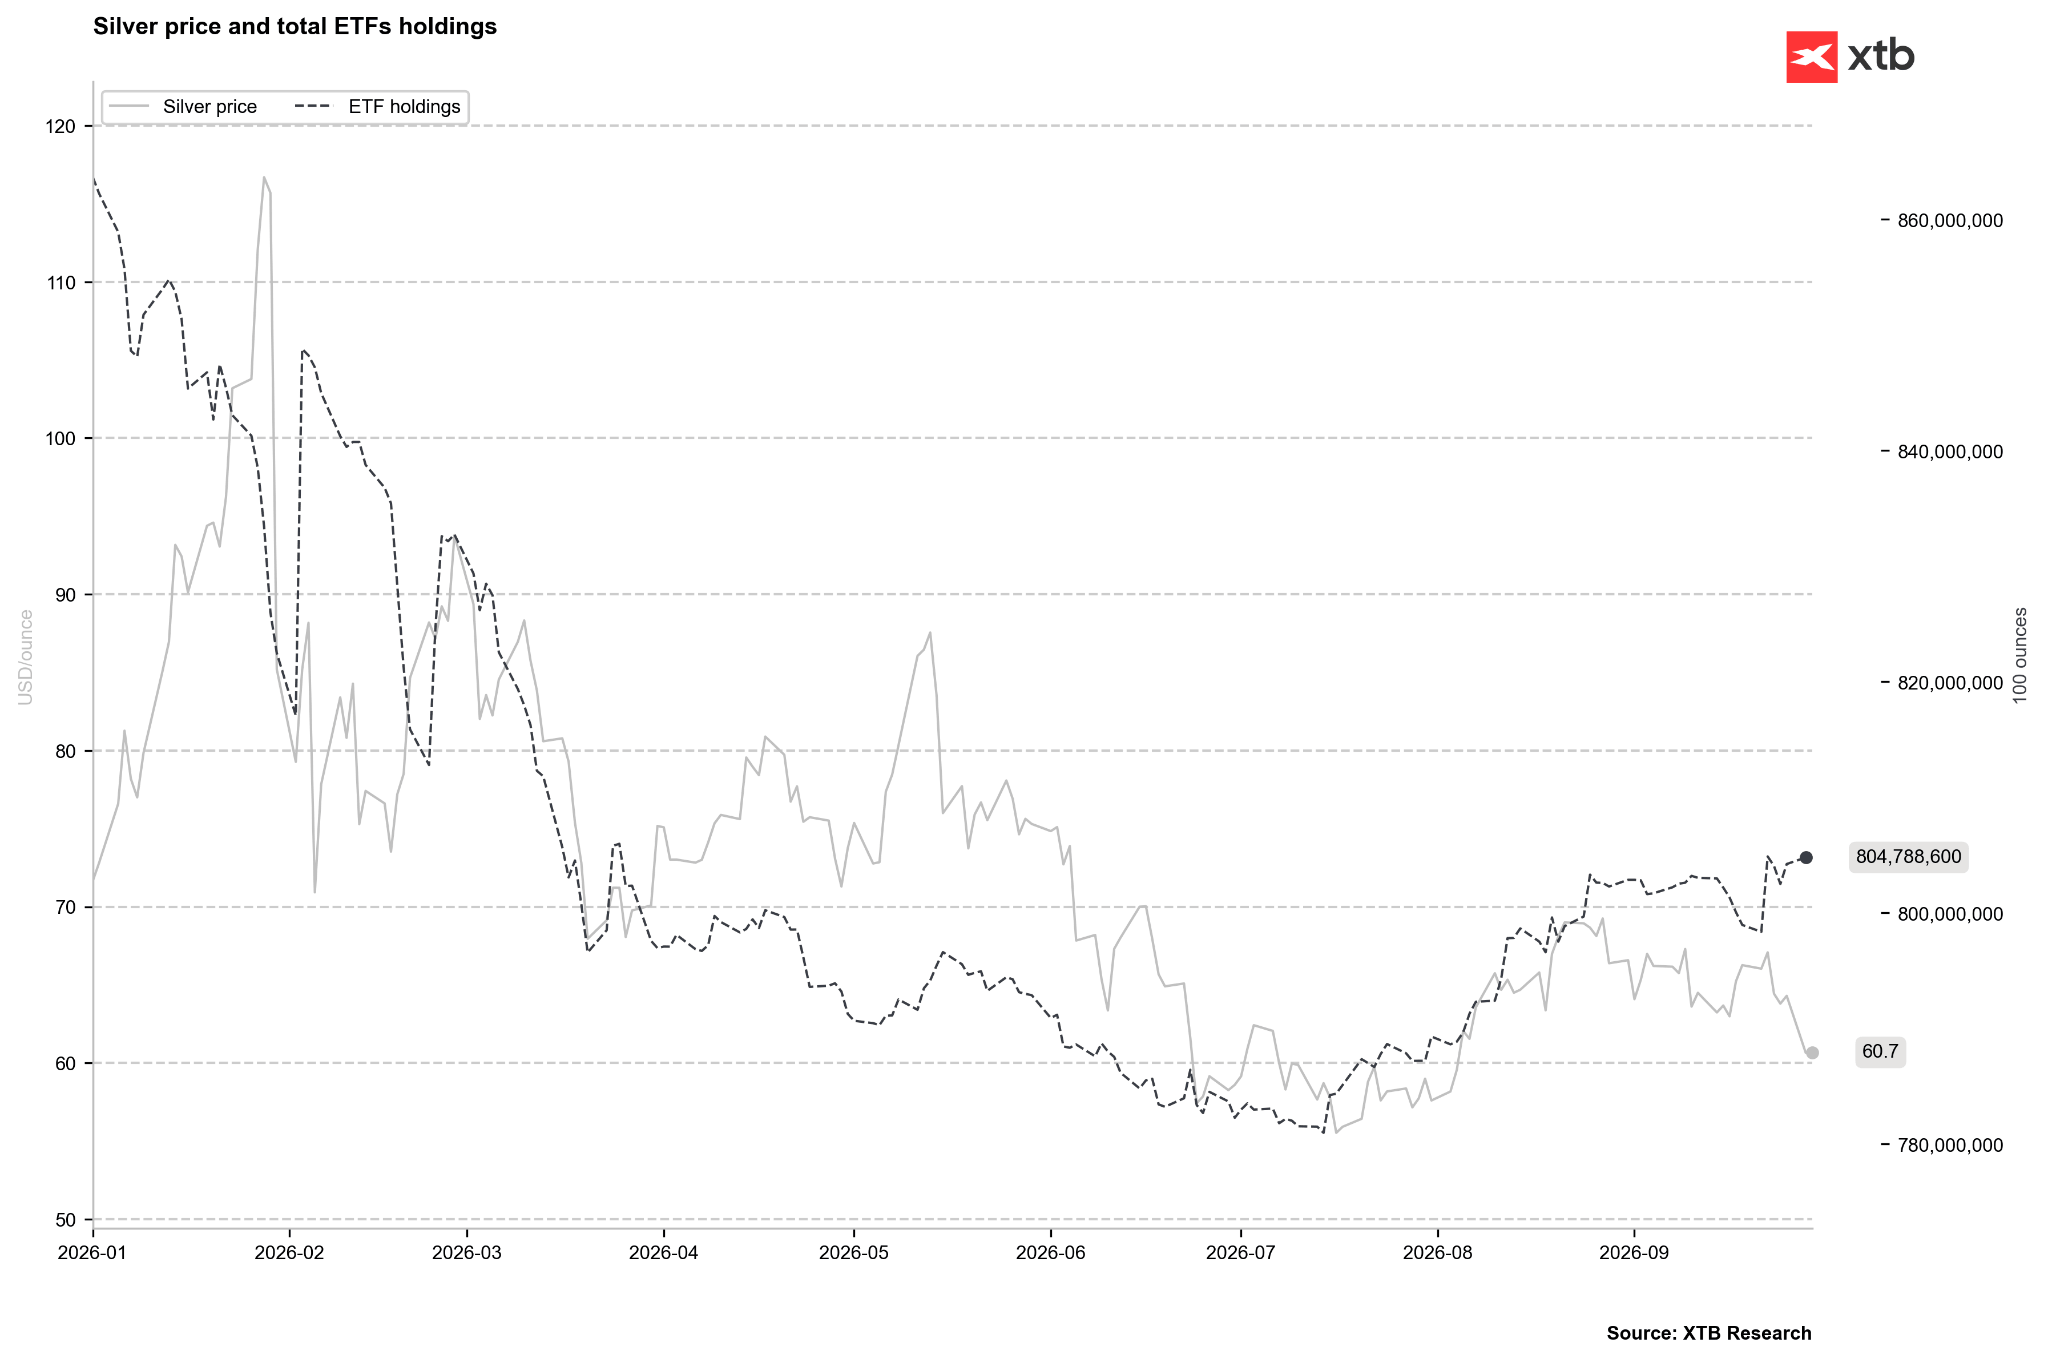
The hope for bulls lies in high ETF silver holdings, suggesting the price decline may be temporary. However, if funds start selling, a deeper drop below USD 55 per ounce cannot be ruled out. Source: Bloomberg Finance LP, XTB
Historical Valuation (Z-score) and CFTC Positioning
- Z-score values for silver stand at -0.67 on a 1-year horizon (Z1Y), +0.43 on a 2-year horizon (Z2Y), and +1.35 on a 5-year horizon (Z5Y).
- An analysis of the 5-year Z-score historical dynamics shows that this indicator stood at 2.54 six months ago, then dropped to 1.41 three months ago, settled at 1.73 one month ago, and has now returned to 1.35, reflecting a gradual cooling of silver’s long-term price premium.
- According to CFTC data as of September 22, 2026, net speculative positioning stands at 25,444 contracts, with a Z-score of -1.05 and a historical percentile of 47.3%.
- The weekly change in positions showed an increase of 118 contracts, while the share of long positions settled at 78.9%.
- Synthesizing both perspectives indicates moderate divergence: a negative Z-score in speculative positioning near the 47th percentile alongside a low RSI of 33 suggests the market is in a local oversold phase, though the absence of extreme undervaluation in futures contracts limits immediate risk of a sharp short squeeze.
- At the same time, the price drop alongside a reduced long-term Z-score valuation confirms that downward pressure is well grounded in current capital flows.
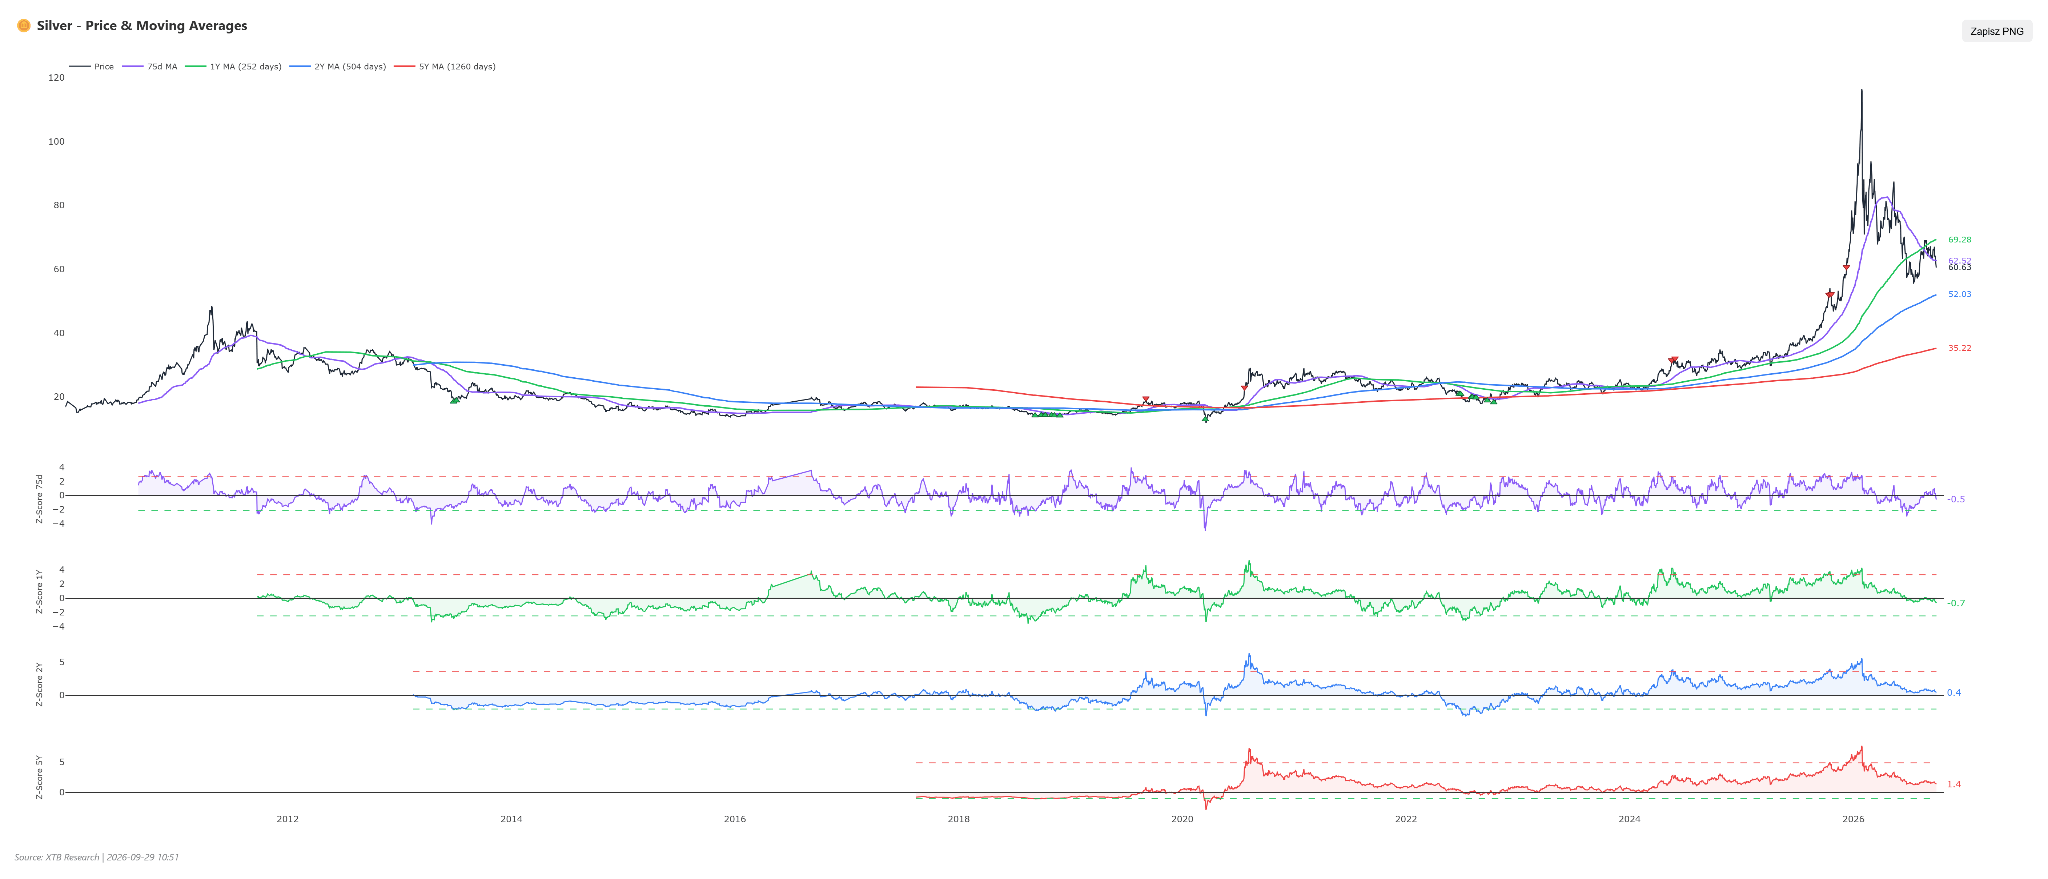
Silver is currently not showing large deviations from moving averages. Source: XTB
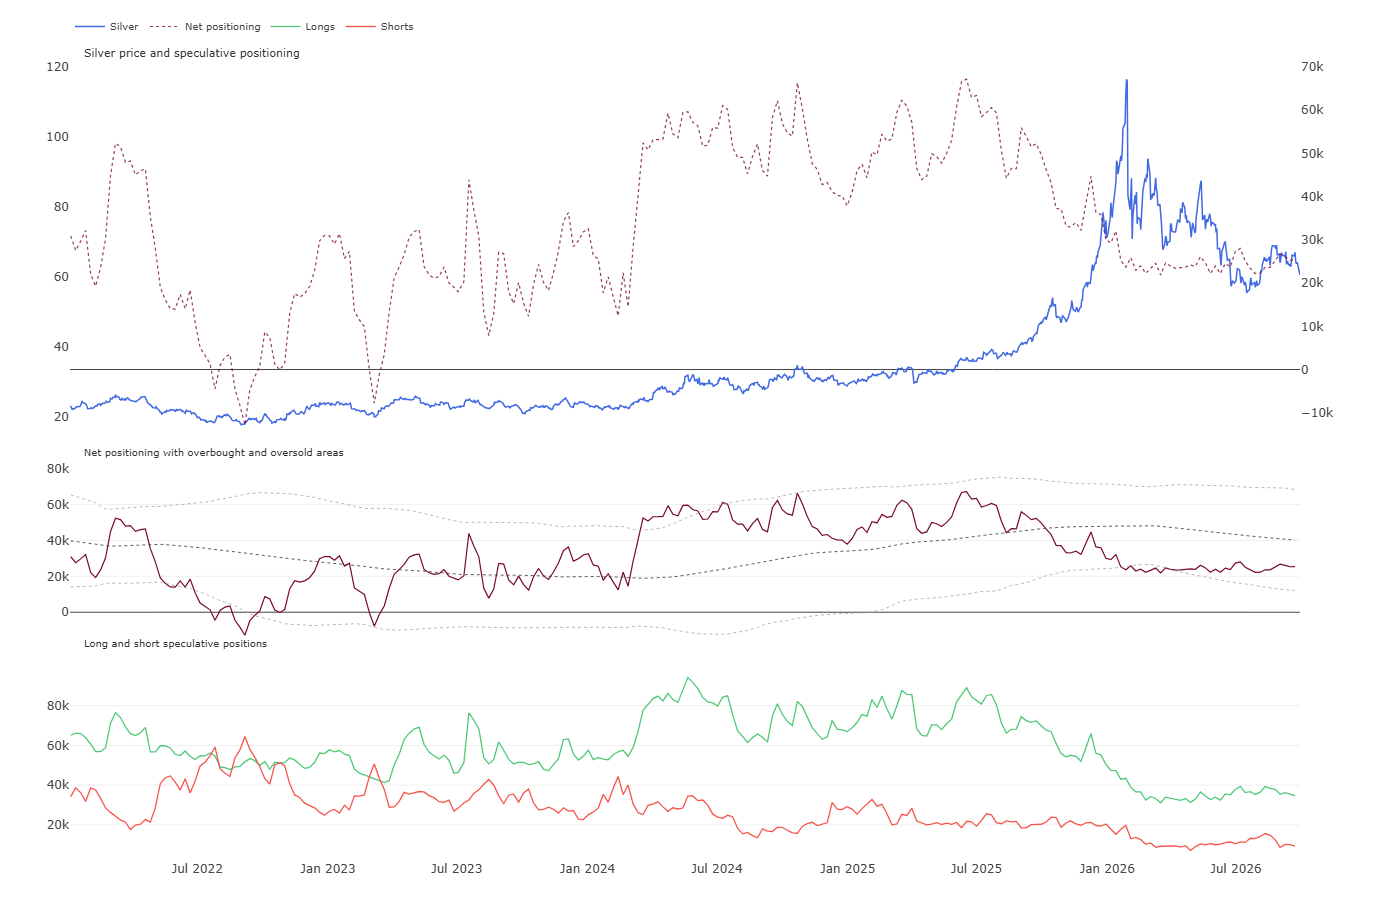
Essentially since July of last year, we have seen a clear reduction in long positions. Currently, open interest remains at low levels, and net positions are negatively deviated from the average, but do not show extreme oversold conditions like in Q1 of this year. Source: Bloomberg Finance LP, XTB
Scenarios
- Bullish Scenario: The bullish scenario depends on easing pressure from US Treasury yields and a sustained break above technical resistance near the 50-day moving average SMA50, which would need support from ETF inflows and an RSI rebound above 50, opening the path toward resistance around 64.50 and a return toward highs near 68.00.
- Bearish Scenario: The bearish scenario materializes if a hawkish monetary policy stance persists along with further losses below key technical support. Given the bearish configuration in the SMA and MACD indicators and a further RSI drop below 33, this could lead to a deeper sell-off testing price levels around 57.00, and potentially down to 54.20 if selling pressure accelerates.
Copper
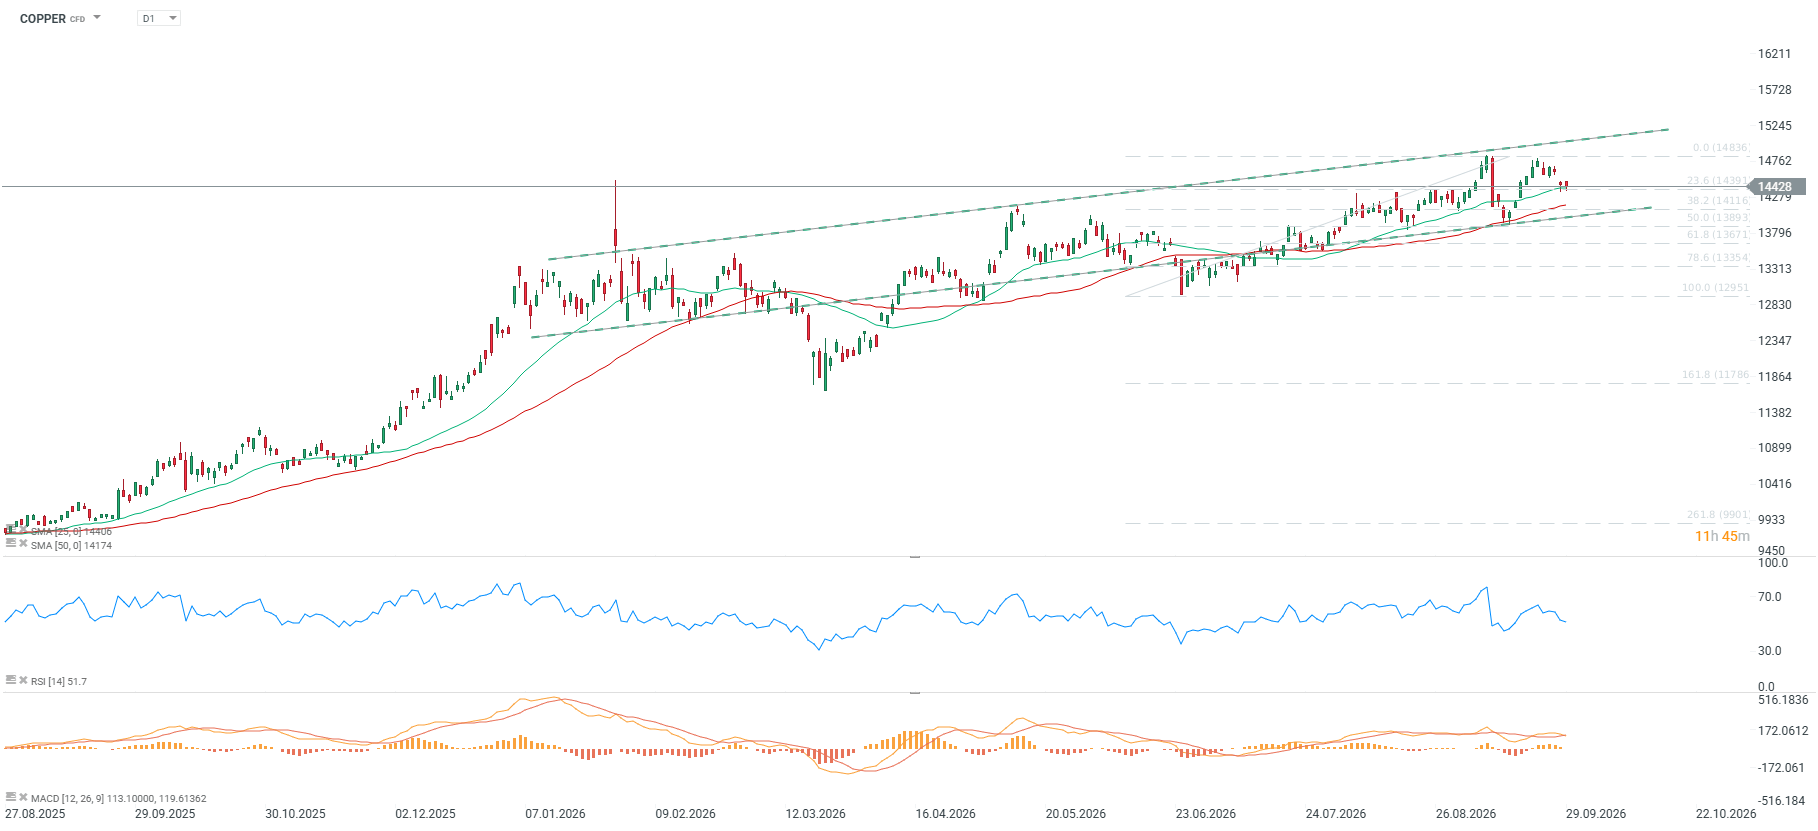
- Copper prices currently stand at USD 14,393.0 per metric ton, with weekly prices down 1.38%, while month-on-month gains reach 0.87%.
- Year-to-date (YTD), the commodity benchmark is up 15.62%, and the year-on-year return reaches an impressive 39.77%.
- The Relative Strength Index (RSI) stands at 40, the SMA moving average gives a bullish signal with a 1.54% price deviation above the SMA50, while the MACD indicator remains in bearish territory.
- Copper remains in an upward consolidation trend, staying above 5-digit price levels (LME prices) for nearly a year now.
- Recent days failed to break the all-time high, but the current pullback is holding around the 23.6% Fibonacci retracement of the latest upward impulse and near the 25-day SMA.
Fundamental and Market Context
- The copper market remains structurally distorted by geographic inventory asymmetry and systematic output declines across key mines.
- Inventories continue to be directed to the United States over fears of new tariffs and due to copper’s growing role in emerging tech developments.
- The global supply-demand balance is characterized by a deficit of physical cargo shipments, putting upward pressure on regional premiums.
- However, construction and industrial demand in major Asian economies is capping copper’s upside potential. China’s credit impulse indicates that copper’s price rise is not driven by demand-side factors.
- Copper forward curve indicators reflect contract relationships over annual horizons, showing Z-score values of 1.32 for 1-year, 1.72 for 2-year, and 2.63 for 5-year periods.
- Smelting activity at copper refineries faces raw material constraints tied to concentrate availability, translating into low treatment and refining charges (TC/RCs).
- Market sentiment measured by synthetic indicators remains neutral, reflecting a tug-of-war between strong supply fundamentals and concerns over global manufacturing health.
- Growing fears of production halts at certain Chilean mines (strikes, a worker fatality at Escondida) are keeping copper prices hovering near record highs.
- The decline in global copper inventories has paused somewhat, while the build-up at the turn of 2025/2026 is a result of inventory building in the US. Meanwhile, in China, we continue to see inventory drawdowns reaching extreme lows.
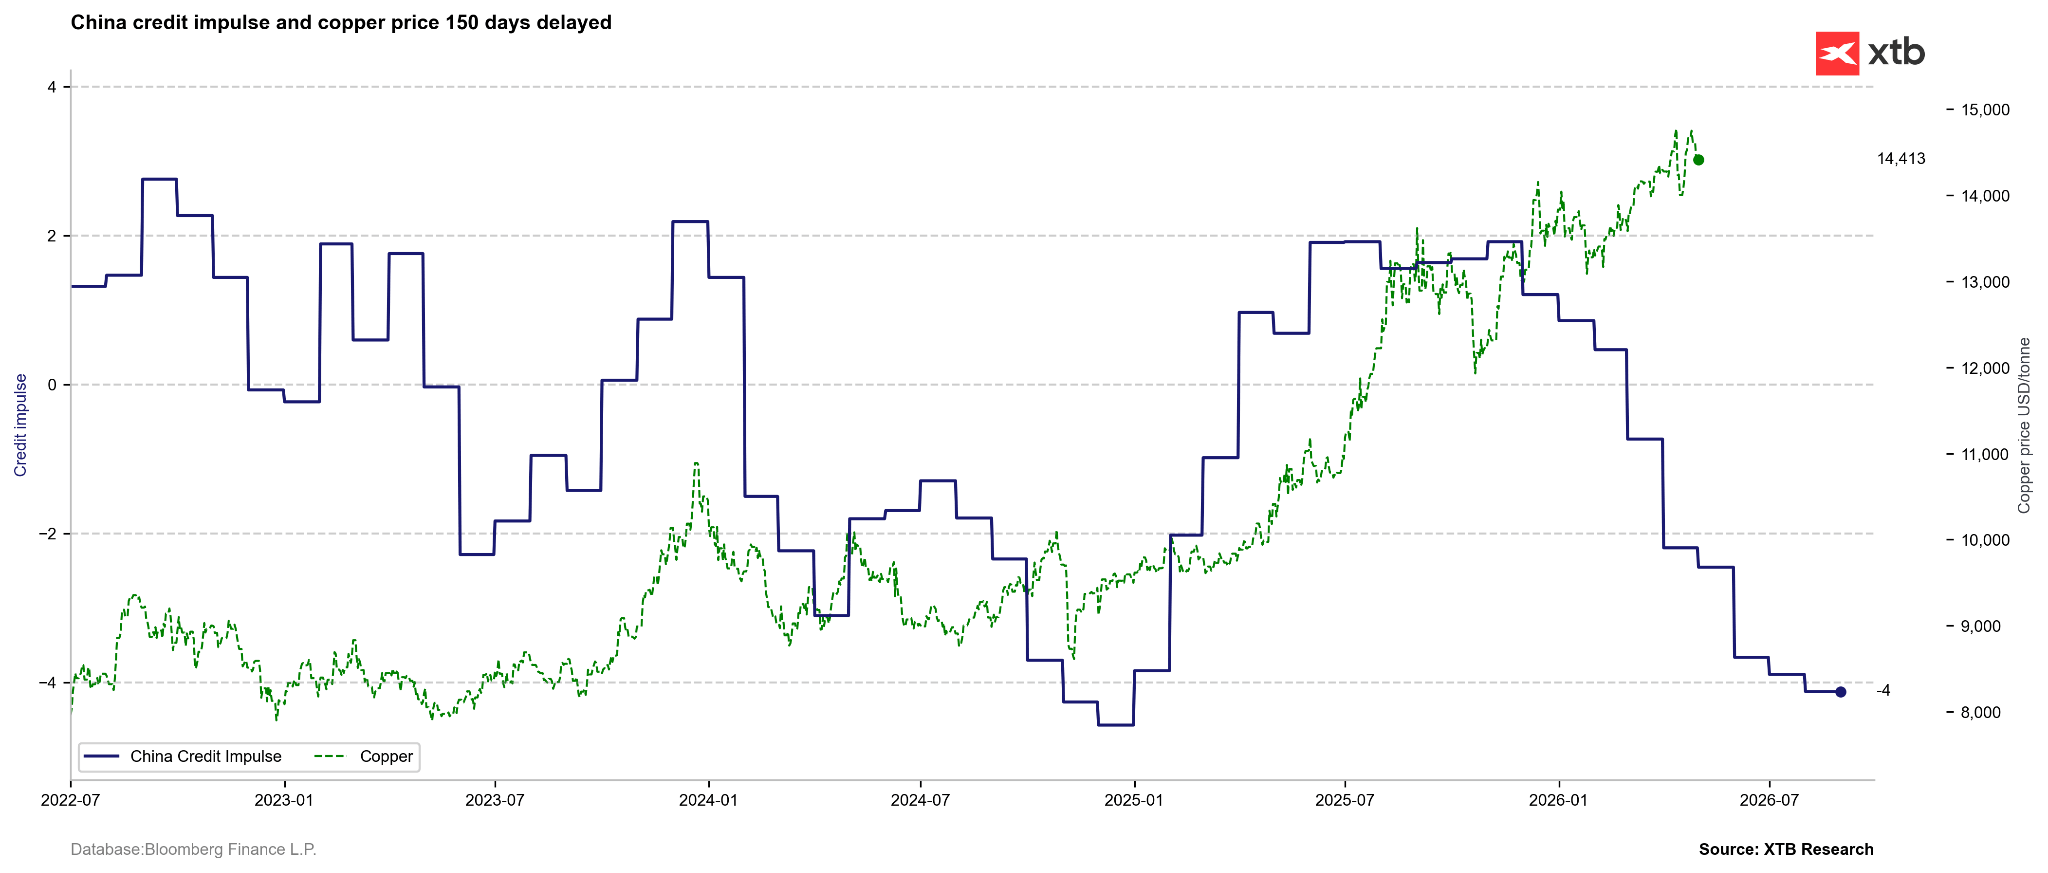
China’s credit impulse, which typically served as a leading indicator, currently shows that copper price gains are disconnected from demand factors. Source: Bloomberg Finance LP, XTB
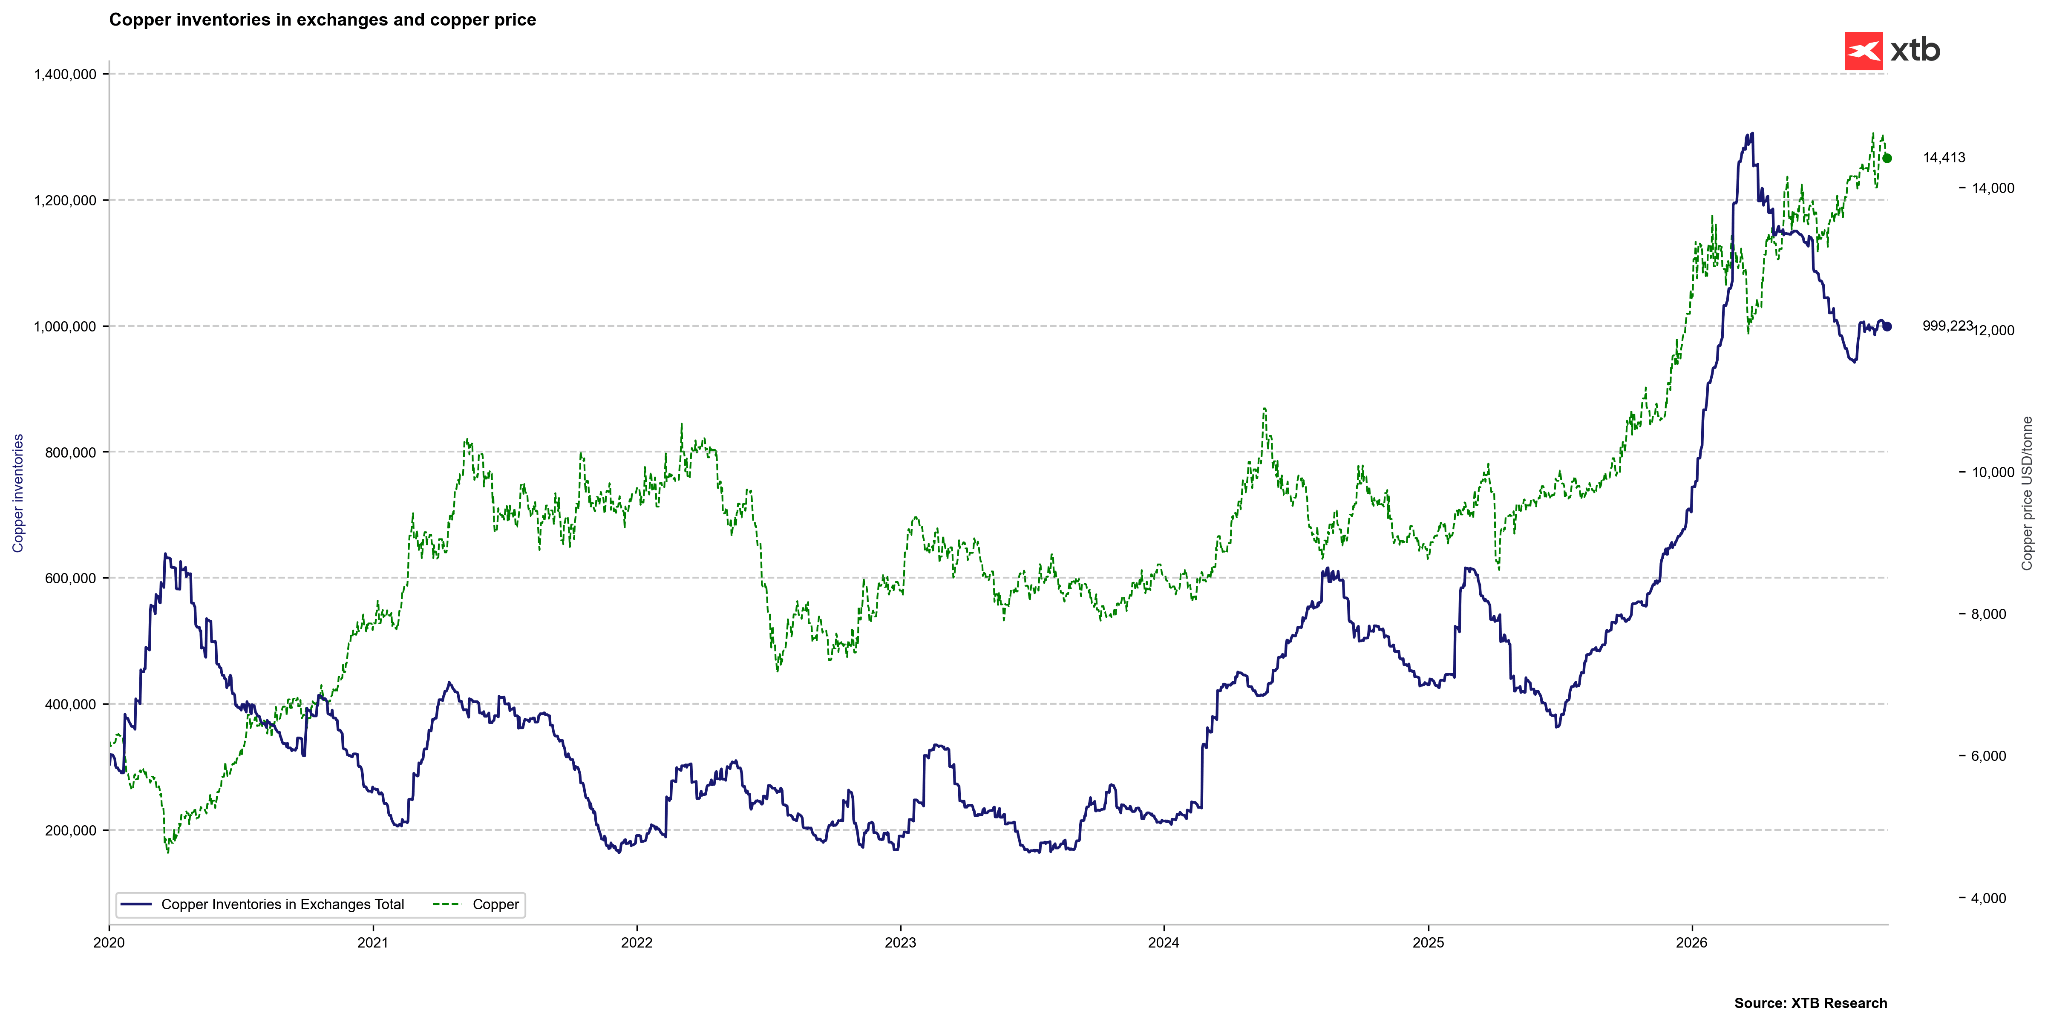
Global copper exchange inventories have halted their decline recently and are stabilizing. Source: Bloomberg Finance LP, XTB
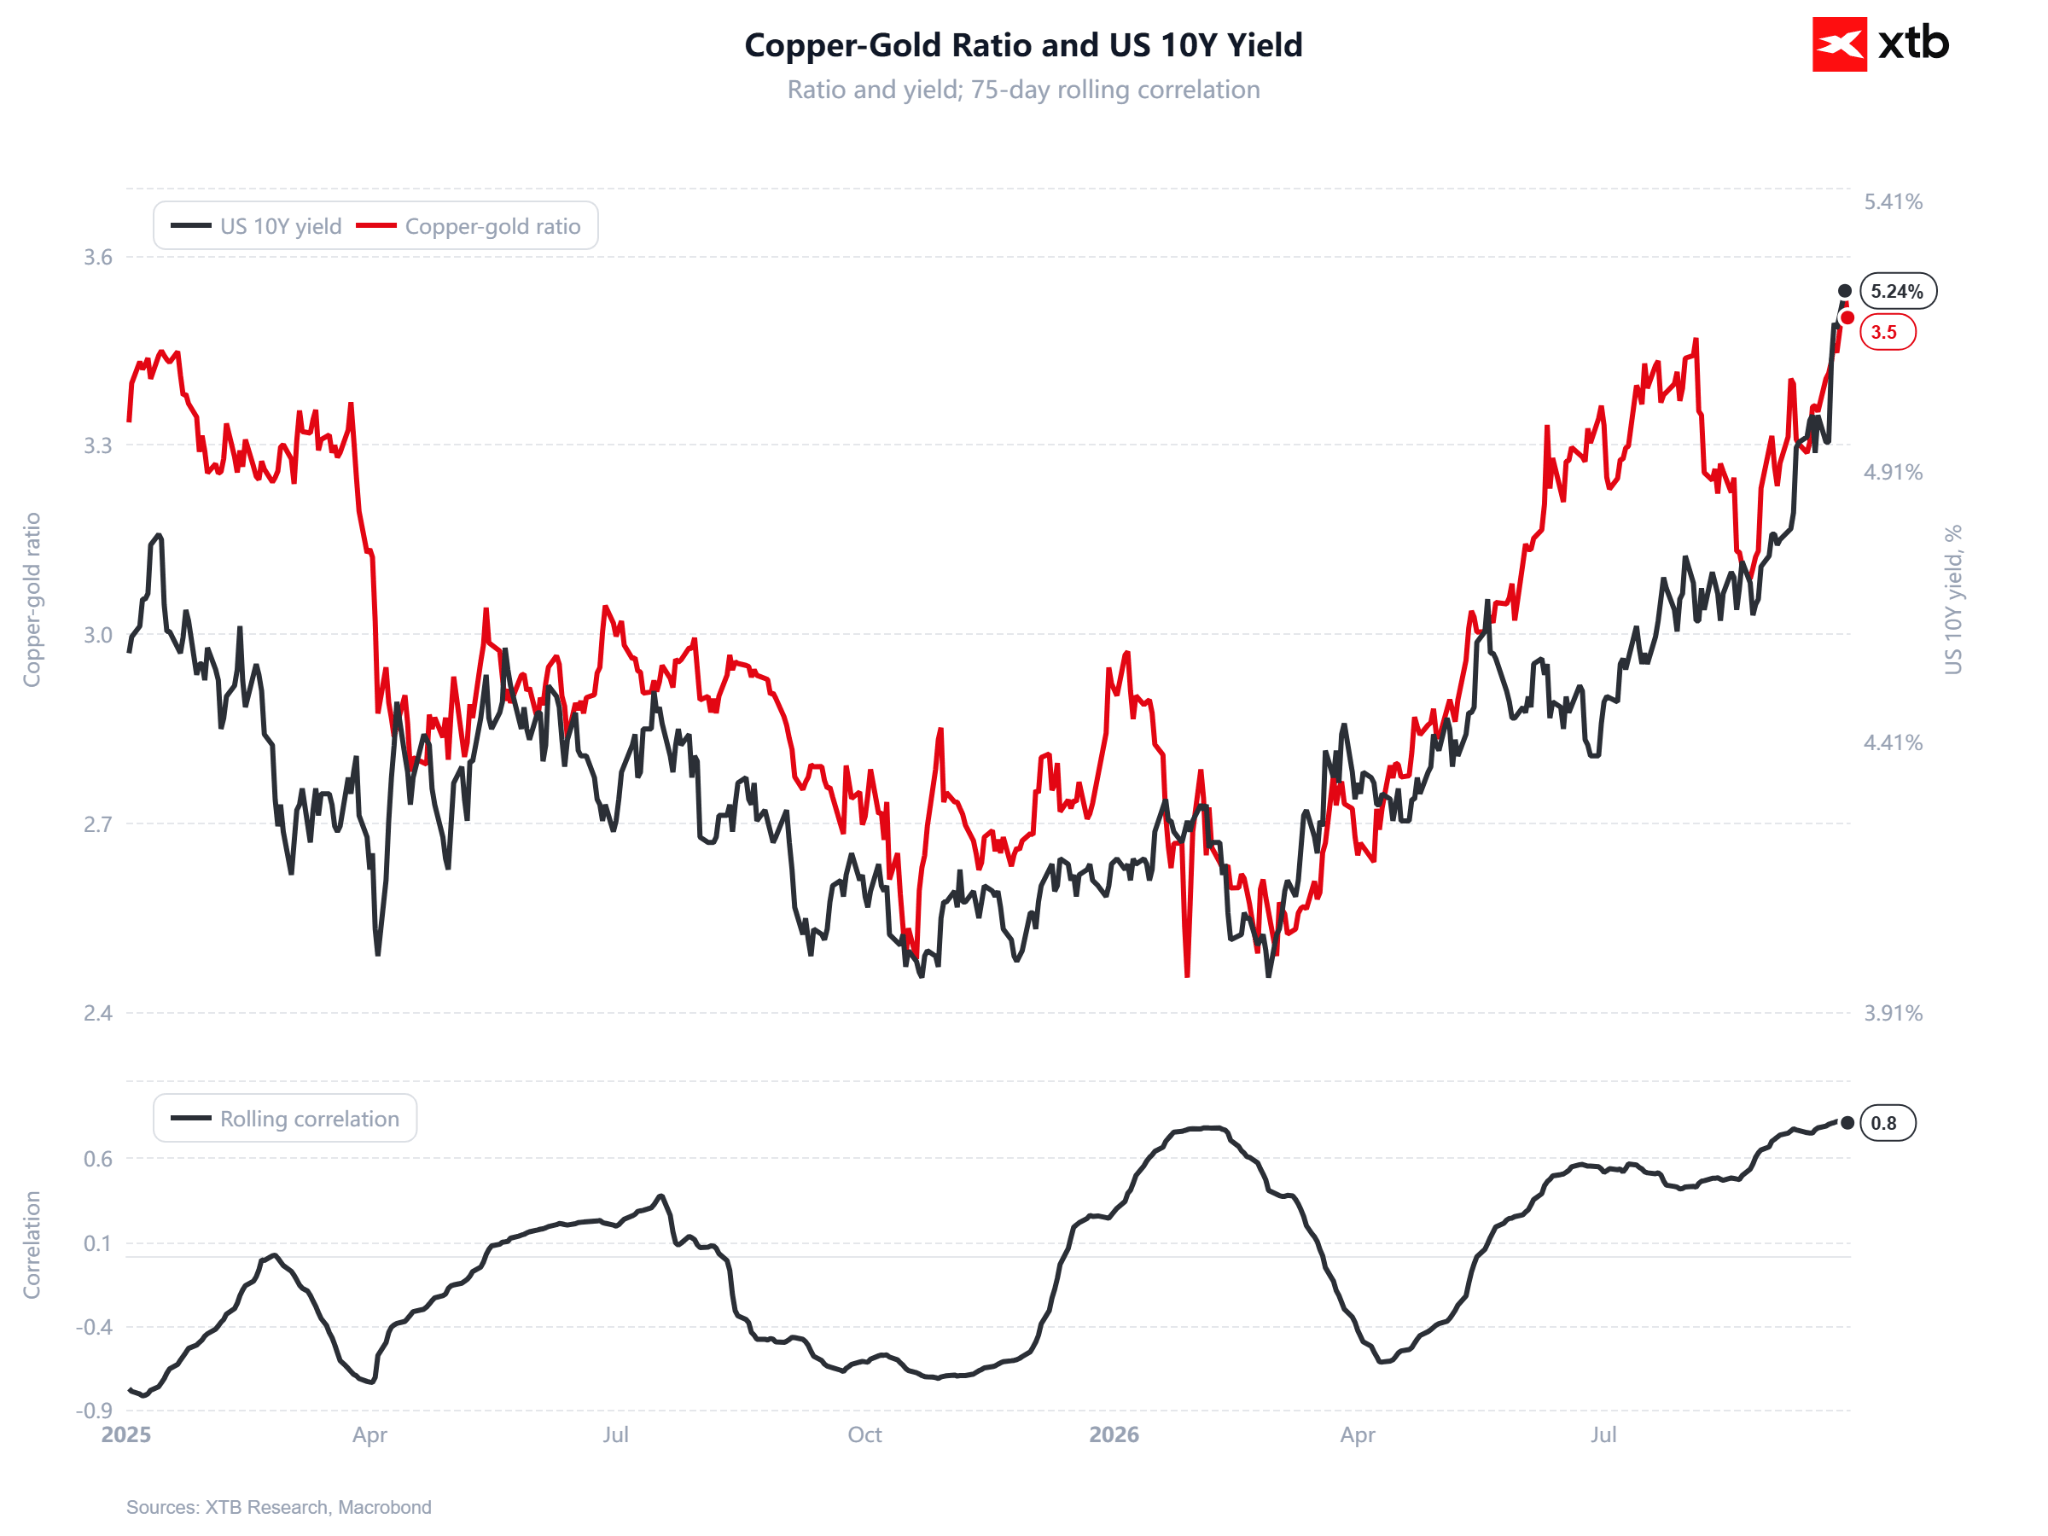
The copper-to-gold ratio used to be an important economic indicator pointing the way for yields. Currently, copper gains are primarily a short-term supply story, and long-term fears of supply failing to match growing demand. Even so, the copper-to-gold ratio has recently priced rising yields fairly well. Source: XTB
Historical Valuation (Z-score) and CFTC Positioning
- The price Z-score for copper stands at 1.32 on a 1-year horizon (Z1Y), 1.72 on a 2-year horizon (Z2Y), and reaches 2.63 on a 5-year horizon (Z5Y).
- The 5-year Z-score showed notable volatility over recent months: six months ago it stood at 2.17, three months ago it rose to 2.62, one month ago it ticked up to 2.79, and has now stabilized at 2.63.
- According to CFTC data as of September 22, 2026, fund net speculative positioning reached 90,522 long contracts, with the position Z-score touching an extreme +2.12 level, corresponding to the 99.9th historical percentile.
- The weekly change reflected a sharp influx of speculative capital, adding 15,388 contracts, with the long share increasing to 76.9%.
- It is worth noting that CFTC data pertains to US copper, which trades in cents per pound. At the same time, US positioning data correlates well with London prices, which currently do not show significant spread against US figures.
- The above synthesis points to a strong divergence between valuations based on historical deviations and aggressive speculative positioning. A high 99.9th percentile and a surge in net long positions alongside neutral technical sentiment indicate that the market is heavily crowded on the bullish side.
- Such a positioning structure drastically increases the risk of sudden profit-taking and a sharp downward correction should negative macroeconomic triggers or disappointments in physical demand data emerge.
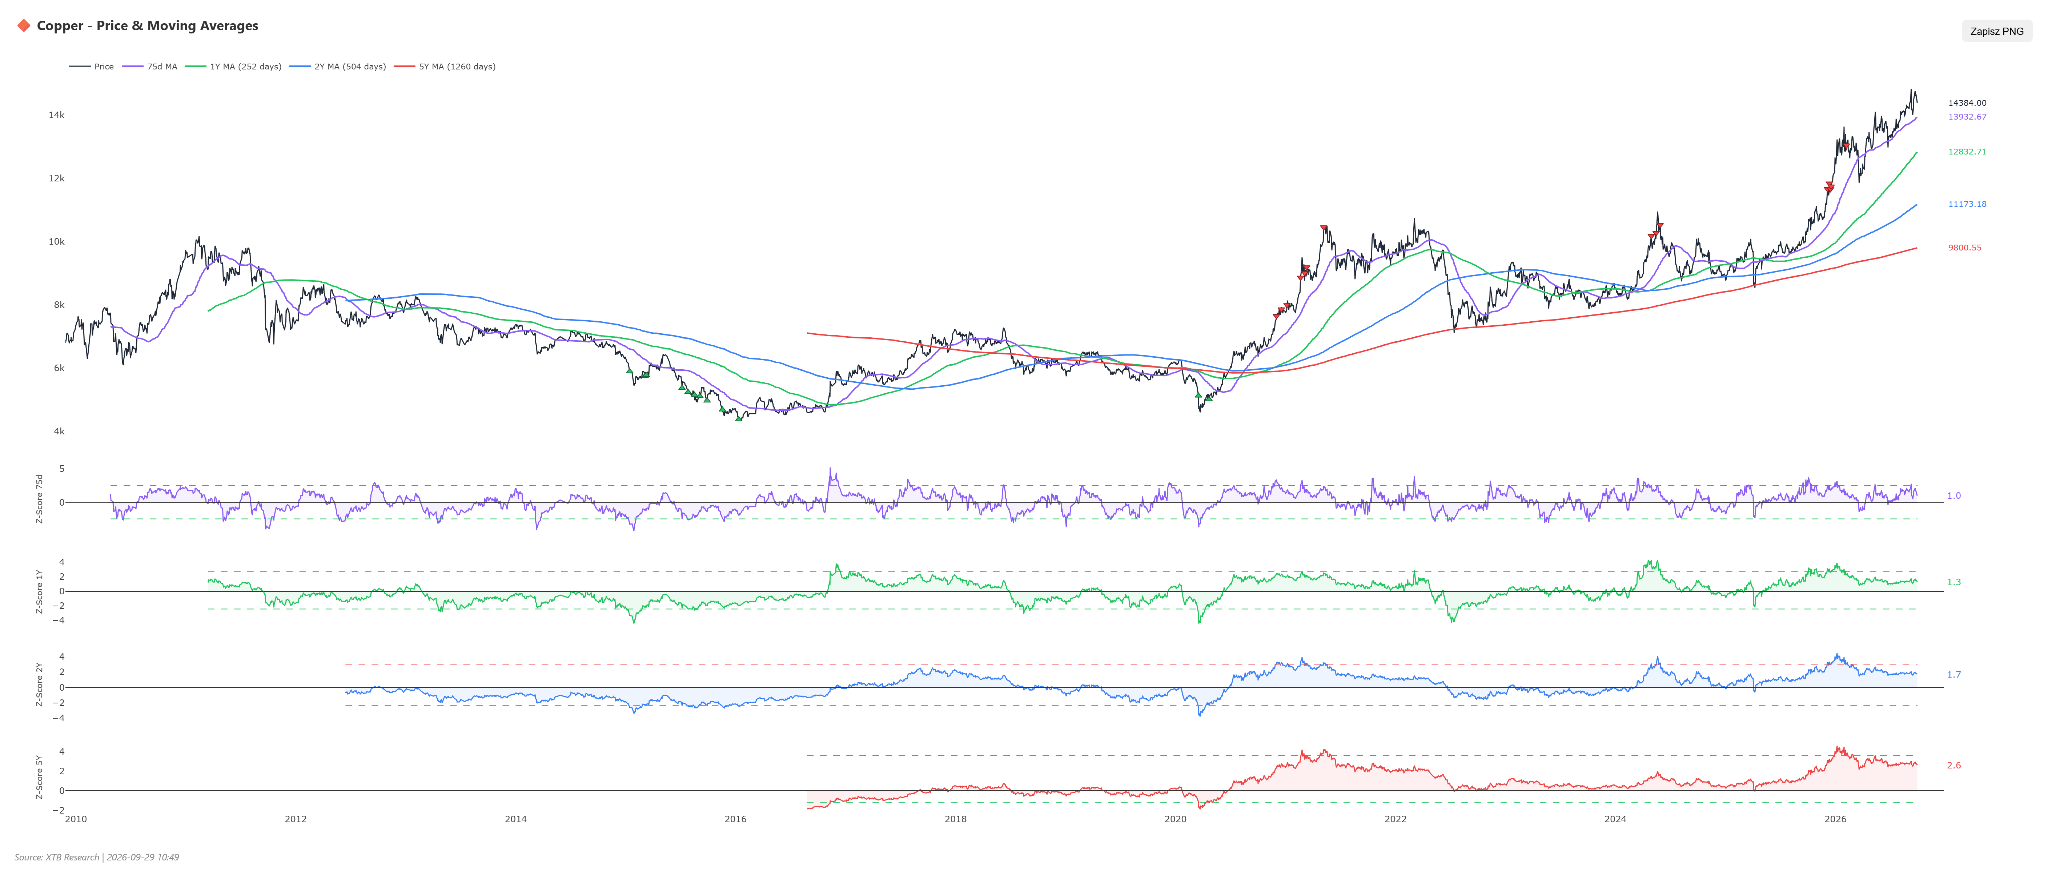
Copper remains visibly overbought looking at the 5-year average, but the previous setup in 2021-2022 suggests copper can consolidate for an extended period at high deviation levels. Source: XTB
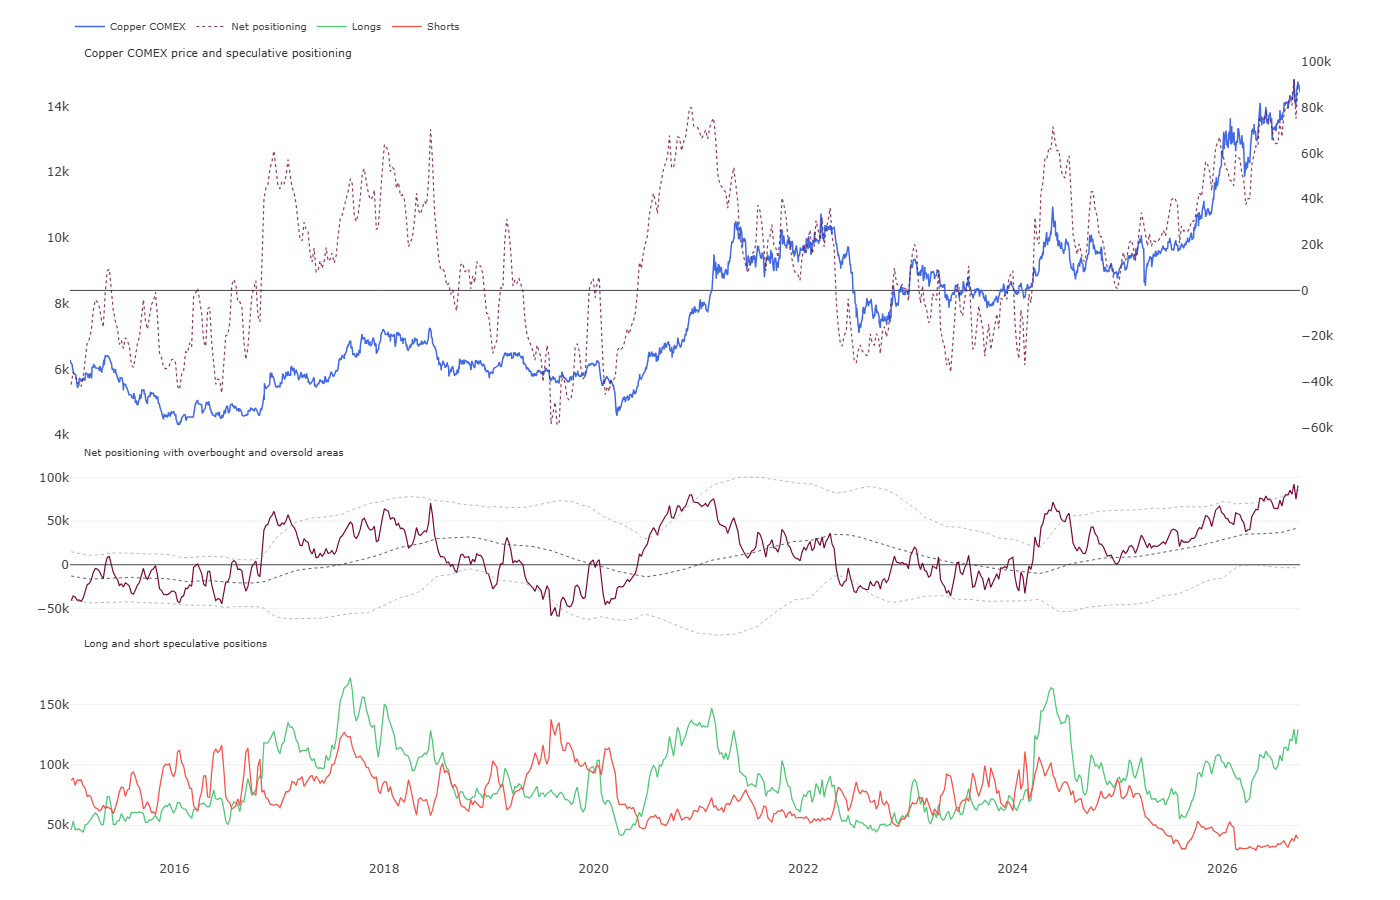
Net positions are currently near extreme overbought territory, but historically, only a clear move above a 2x standard deviation triggered a strong signal. Source: CFTC, XTB
Scenarios
- Bullish Scenario: This scenario materializes if the physical copper concentrate deficit deepens further, unexpected outages occur at key mines, and industrial activity and orders accelerate in China’s high-tech and renewable energy sectors. A necessary condition is maintaining support at the SMA moving average and defending price retracement levels above USD 14,000 per ton. With strong fund backing and sustained high net positioning, copper quotes could break technical resistance and head toward USD 14,800–15,200 per ton.
- Bearish Scenario: This scenario assumes a wave of sell-offs and liquidation of extremely high long positions by speculative investors, which could be triggered by weakening macroeconomic indicators or a stronger inflow of copper scrap into developed markets. Technical conditions include a sustained RSI drop below 40, a MACD line cross in favor of sellers, and a price break below key support around USD 14,150 per ton. Under rapid liquidation of record speculative involvement, copper prices could dive toward USD 13,600–13,800 per ton.
Crude Oil
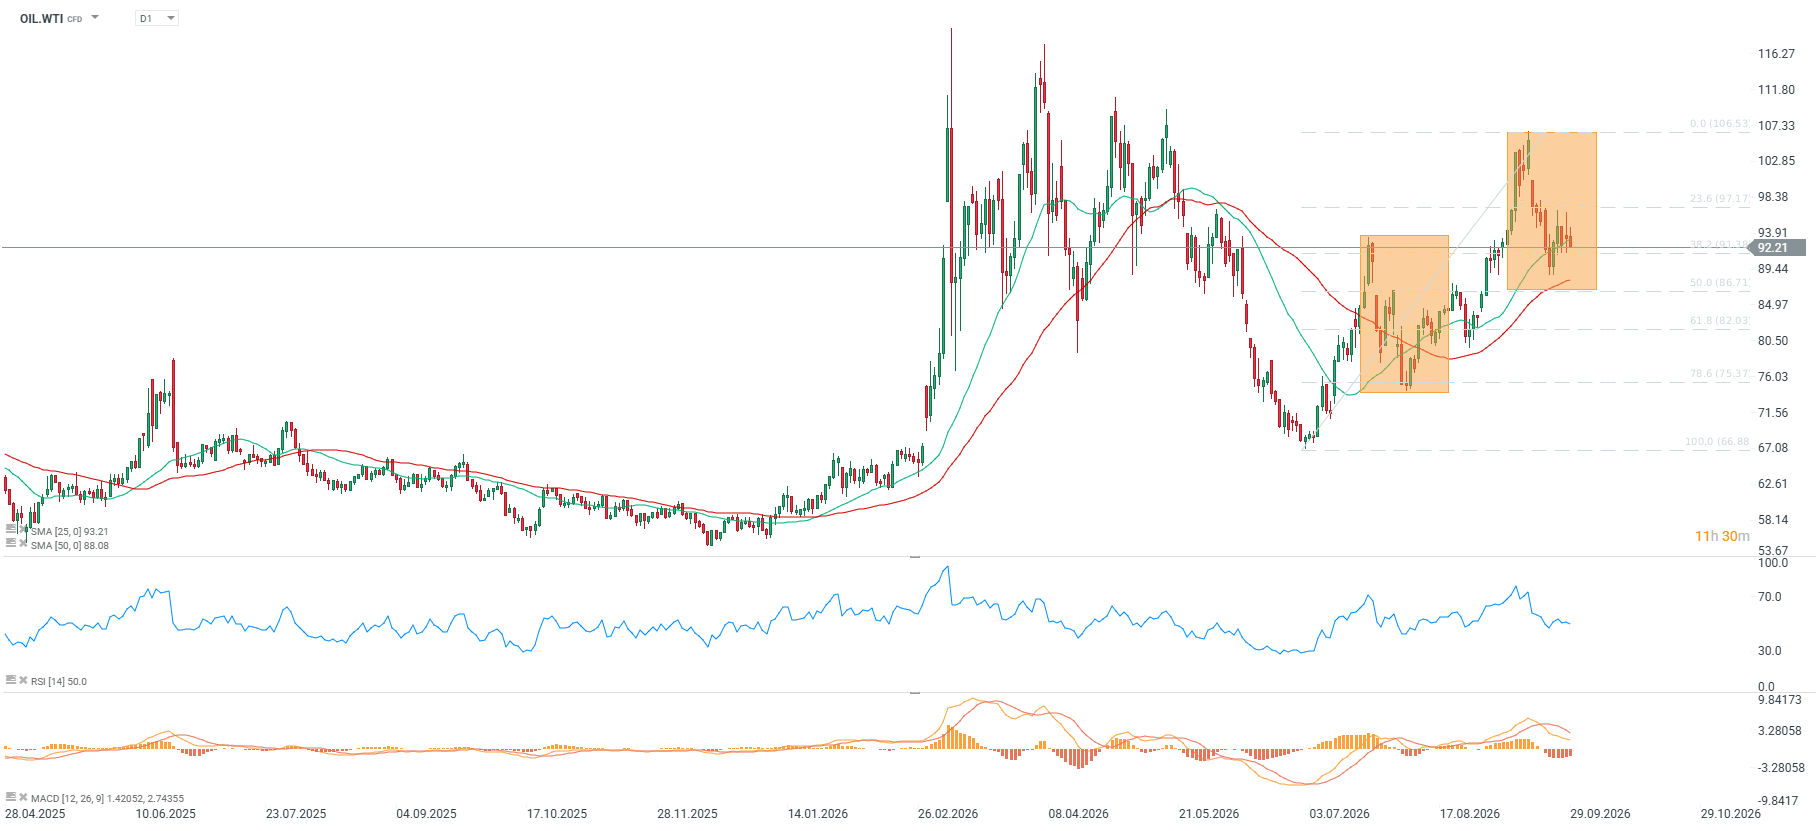
- WTI Crude is trading at USD 92.74 per barrel, reflecting a monthly gain of 7.50%, a strong YTD surge of 61.96%, and a year-on-year increase of 48.57%.
- The RSI indicator stands at 45, indicating a neutral market position; the SMA moving average maintains a bullish signal, while the MACD indicator generates a bearish signal.
- Quotes remain 5.28% above the 50-period SMA moving average under neutral market sentiment, though morning gains have given way to a pullback below the 25 SMA.
- Nevertheless, only a move below the 50.0 retracement would signal a genuine attempt to break the uptrend that has been in place since early July.
Fundamental and Market Context
- November Brent crude futures fell to USD 105 per barrel, while the December contract struggled to break back above USD 100 per barrel.
- Partial recovery of transit through the Strait of Hormuz to around 7.4 million bpd, monitored by Kpler, enabled total Middle East exports to rise to 12.8 million bpd in September. Some reports even suggest Middle East exports over recent days reached up to 17 million bpd.
- However, the key aspect is that costs associated with Persian Gulf oil exports (insurance, transshipment) currently run up to USD 20-30 per barrel. Therefore, only a genuine agreement could drive a sustained price slump below the USD 80 per barrel mark.
- The OPEC+ alliance maintained output cuts unchanged, with Saudi Arabian production stabilizing around 10.48 million bpd.
- The International Energy Agency (IEA) estimates effective OPEC+ spare capacity at just 0.22 million bpd, signaling an absence of supply buffer.
- The US EIA forecasts forced production shut-ins in the Persian Gulf averaging 5.7 million bpd in Q4 2026.
- Announcements of a potential US diesel export ban caused crack margins to collapse to a monthly low, discouraging US refiners from crude purchases and weighing on WTI prices while driving up European diesel prices.
- Iran’s parliamentary leader, Qalibaf, stated via state media that no country in the region will sell its oil if Iran cannot sell its own, warning that a lack of security for Iran means a lack of security for regional infrastructure.
- The European Central Bank, through representative Kazimir, highlighted that energy prices remain a key macroeconomic factor.
- Lufthansa Group pointed to oil prices and fleet issues as main factors signaling another year of operational and financial challenges for the carrier.
- Argentina threatened legal action and a lawsuit against the United Kingdom unless an offshore oil drilling project near the Falkland Islands is suspended.
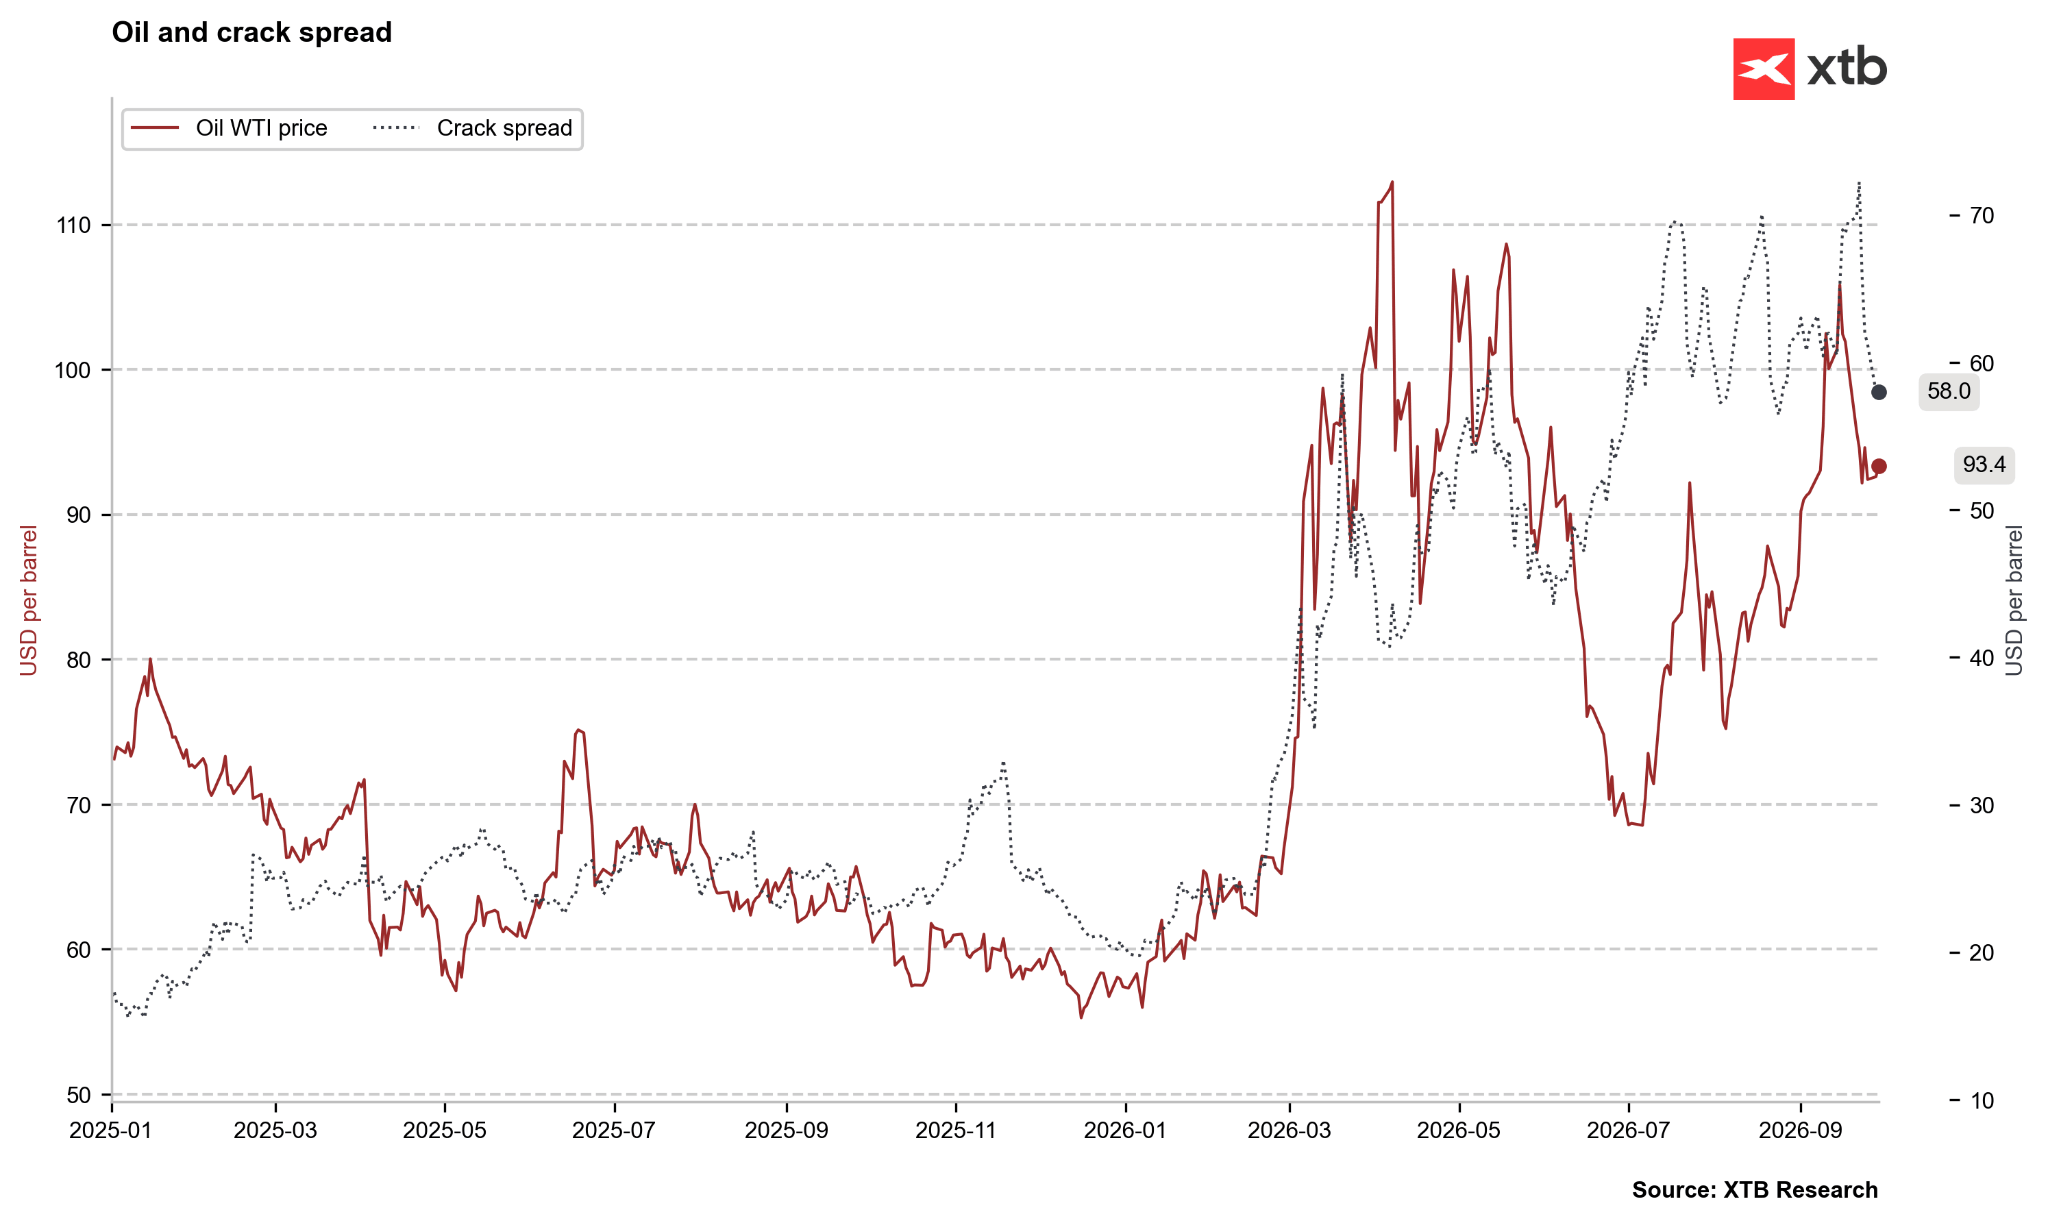
Crack spread is dropping visibly, but remains at historically high levels. Source: Bloomberg Finance LP, XTB
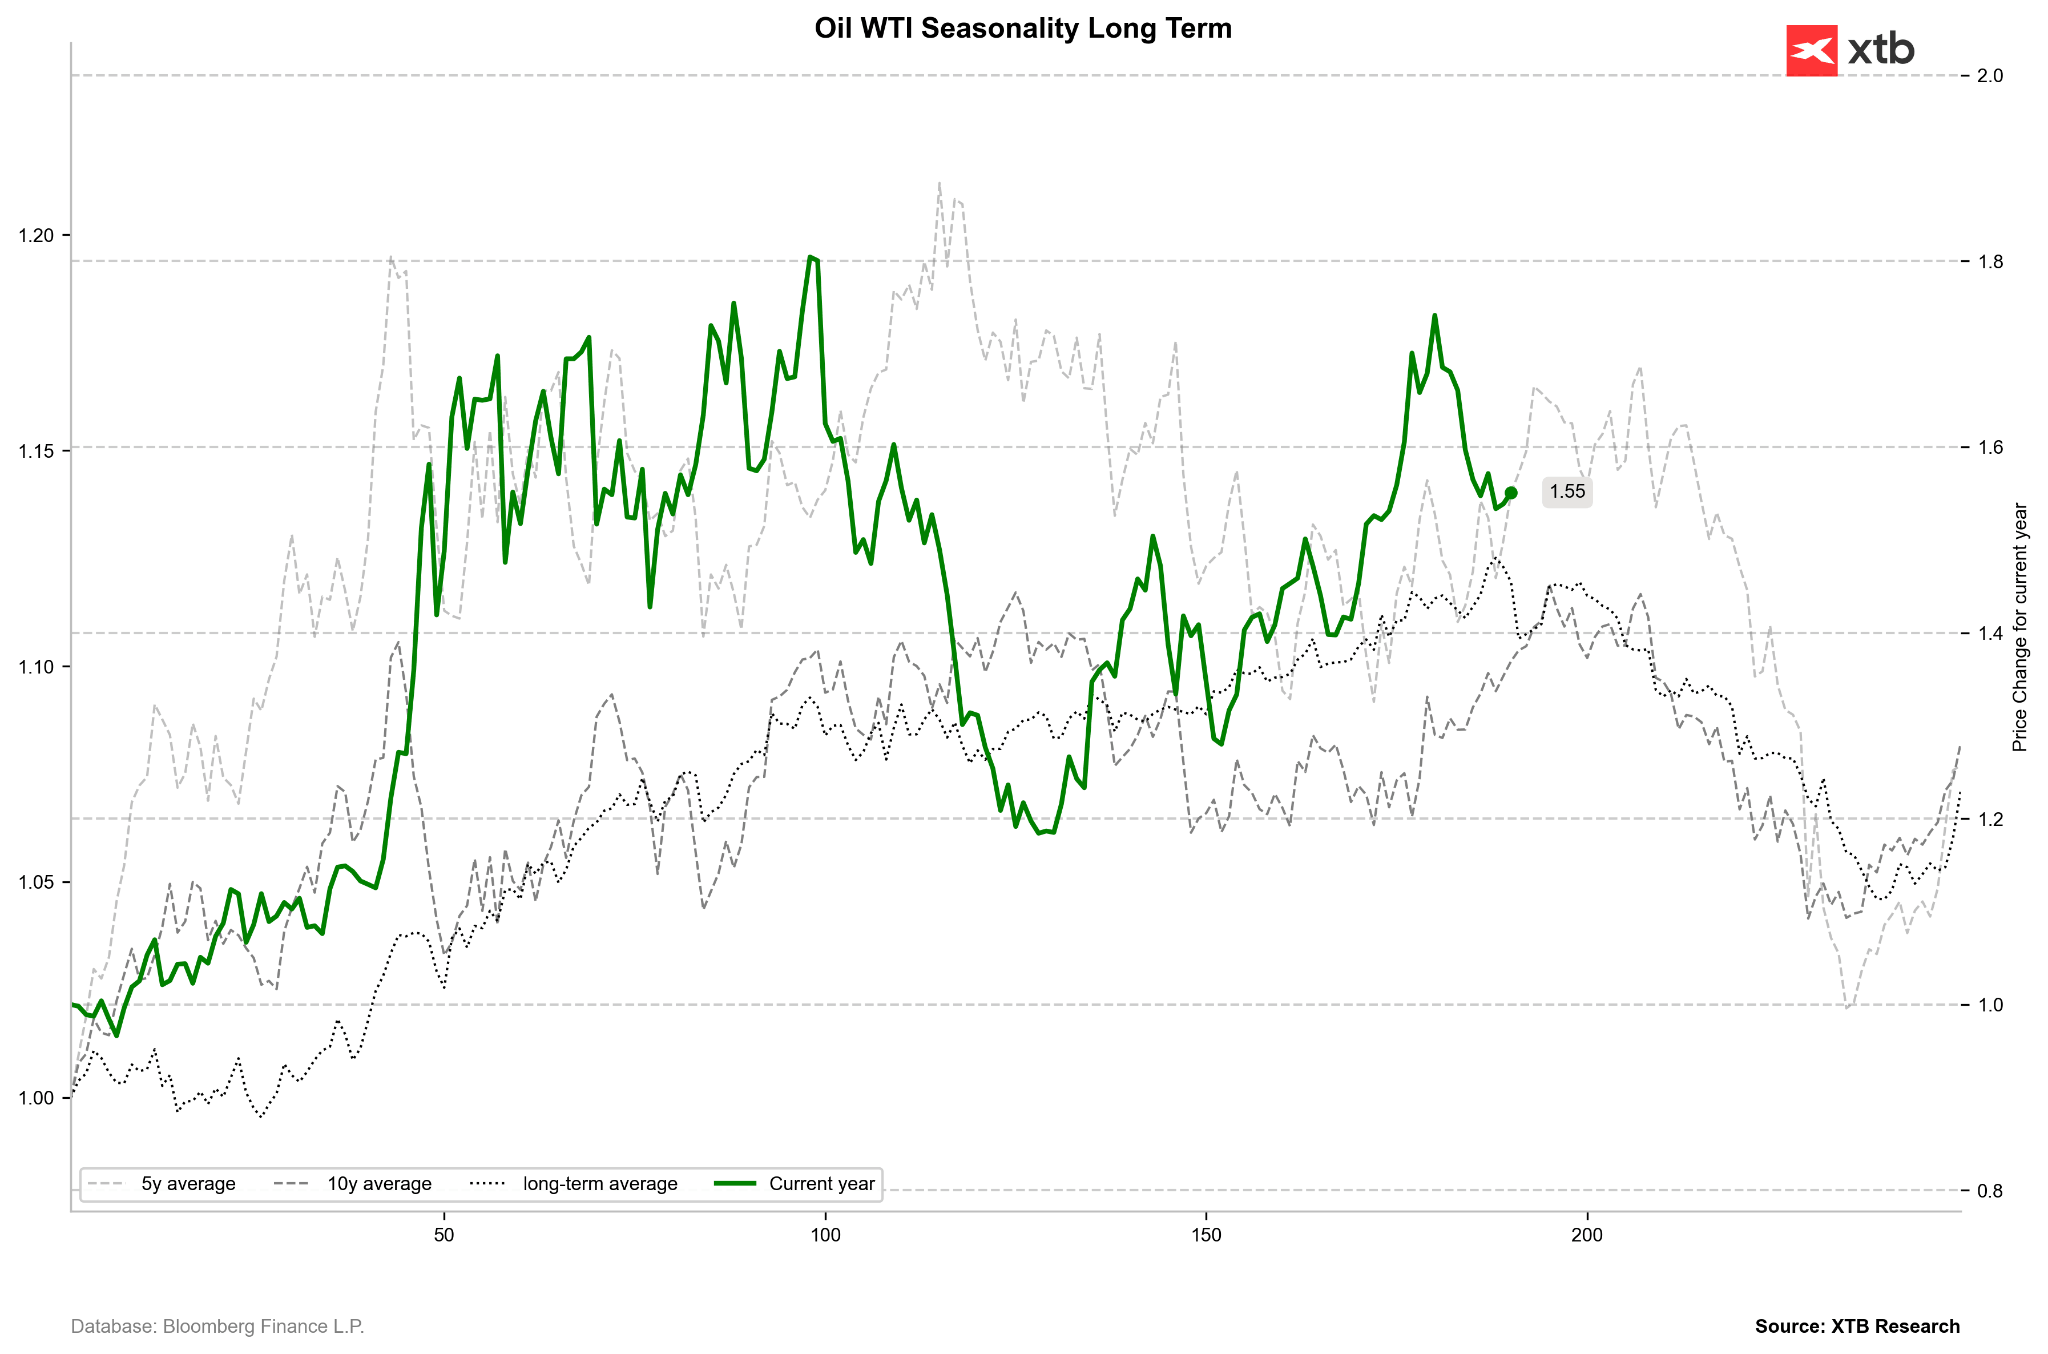
WTI Crude is approaching a seasonal peak. Long-term averages point to price pullbacks in the October-November period. Source: Bloomberg Finance LP, XTB
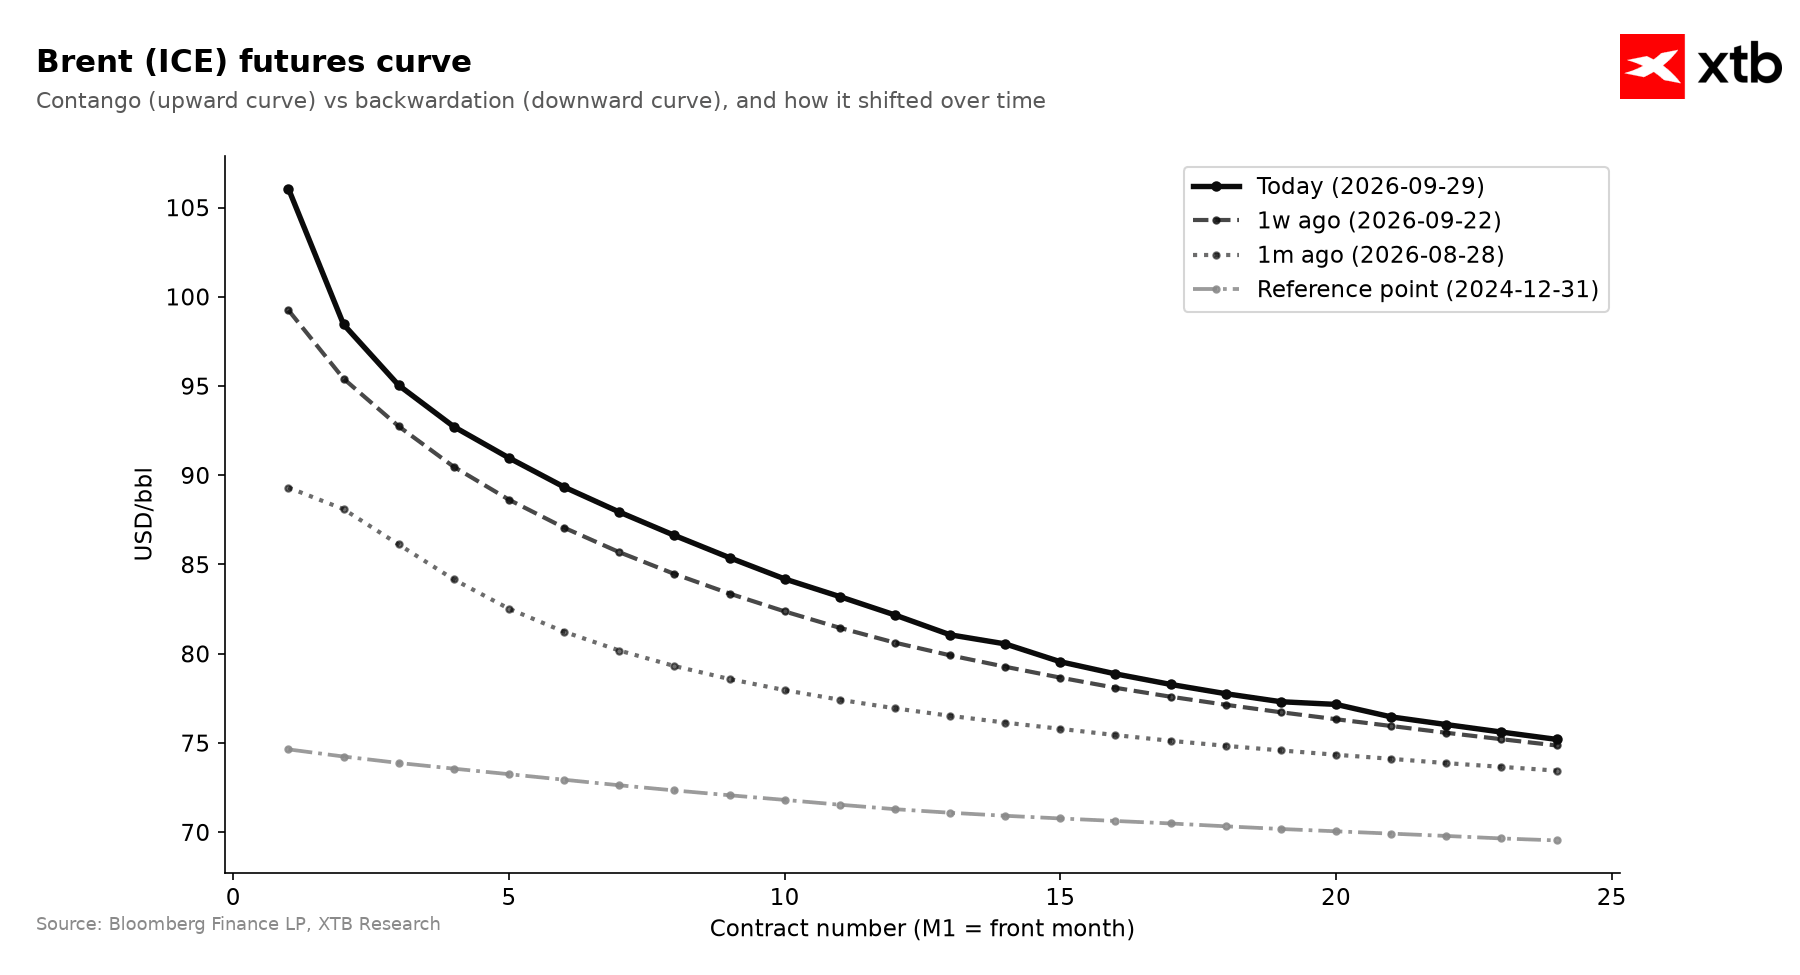
The front calendar spread on Brent is exaggerated mainly due to contract expiration. However, the entire curve is elevated, even amid signs of returning exports from the Middle East. Source: XTB
Historical Valuation (Z-score) and CFTC Positioning
- The Z-score for crude oil stands at Z1Y: +0.90, Z2Y: +1.54, and Z5Y: +1.04.
- Over a 5-year view, the Z-score showed volatility, standing at +0.37 one month ago, -0.61 three months ago, +1.26 six months ago, and currently stabilizing at +1.04, reflecting a clear rebound in medium-term valuations.
- According to CFTC data as of September 22, 2026, net speculative positioning reached +141,106 contracts, with a Z-score of -0.18 and a percentile of 58.1%.
- The weekly net position change showed an increase of 5,201 contracts, with the long position share settling at 62.2%.
- Speculative positioning sits within moderate historical bounds and shows no extreme swings, confirming moderate market optimism without signs of an exaggerated speculative bubble.
- This means current valuation relies more heavily on solid fundamental and geopolitical drivers than on escalating financial leverage from speculators.
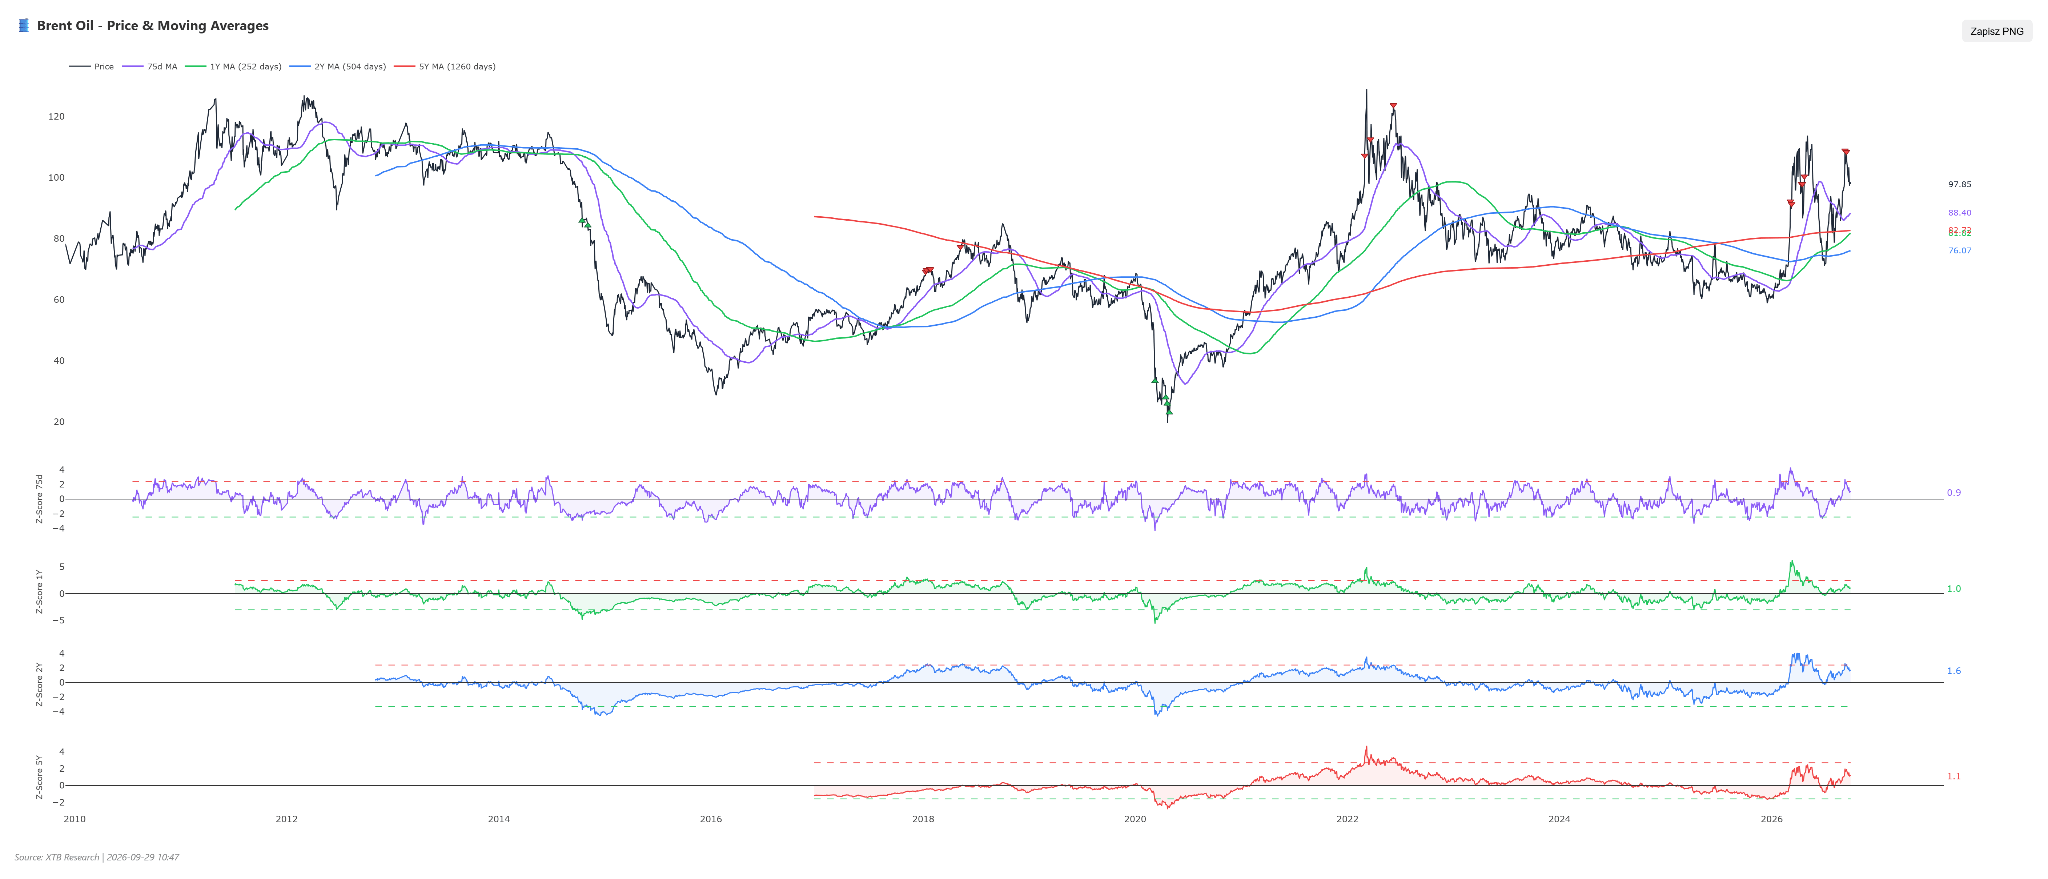
Oil recently showed a short-term overbought signal relative to the 3-month and 2-year moving averages. Source: XTB
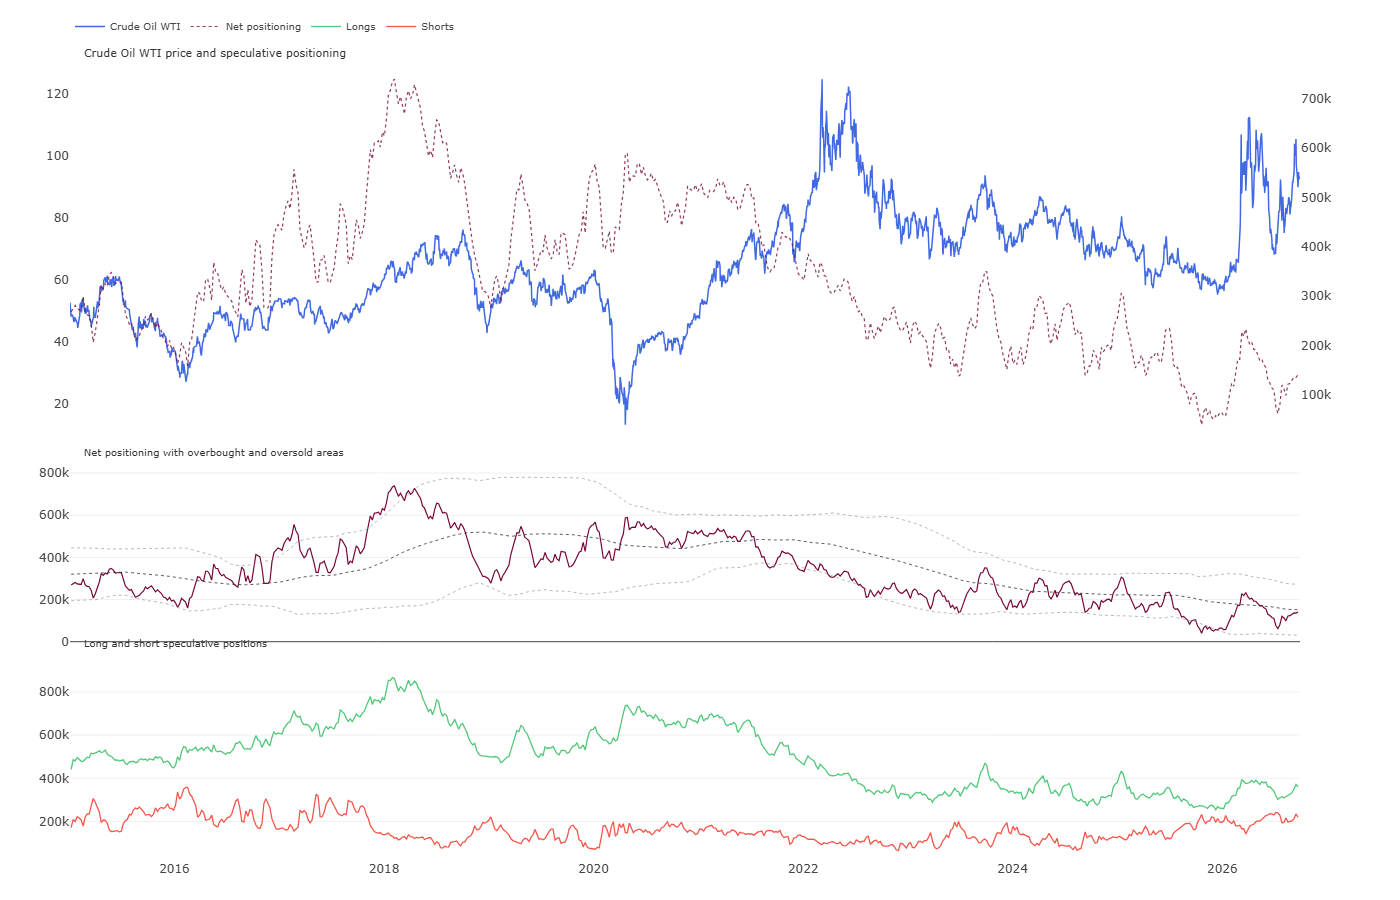
Recently, we observed a slight increase in long positions, bringing net positions near the 2-year average. A long position increase above 400,000 could provide a mild contrarian overvaluation signal. Source: CFTC, XTB
Scenarios
- Bullish Scenario: The bullish scenario assumes the materialization of geopolitical risk through a sustained blockade of maritime routes in the Middle East or further escalation of tensions in the Persian Gulf region, which, given critically low OPEC+ spare production capacity of 0.22 million bpd, will trigger a sharp physical deficit. An additional bullish catalyst will be maintaining a wide spread between Brent and WTI along with a deepening product crisis in Europe linked to North American fuel export restrictions. These conditions must lead to breaking technical resistance, targeting Brent crude quotes above USD 110.00 per barrel and US WTI crude toward USD 98.00–100.00 per barrel.
- Bearish Scenario: The bearish scenario assumes an easing of geopolitical tensions in the Strait of Hormuz and a full, stable normalization of maritime transit above projected levels, accompanied by declining refining margins and the actual implementation of US diesel export curbs hitting base demand in America. Bearish pressure will also be reinforced by scheduled refinery downtime and waning inflationary pressure forcing more restrictive central bank actions. Fulfilling these technical and fundamental conditions will pull WTI crude quotes below support around USD 88.00 per barrel, and Brent crude toward USD 90–95 per barrel.
Coffee
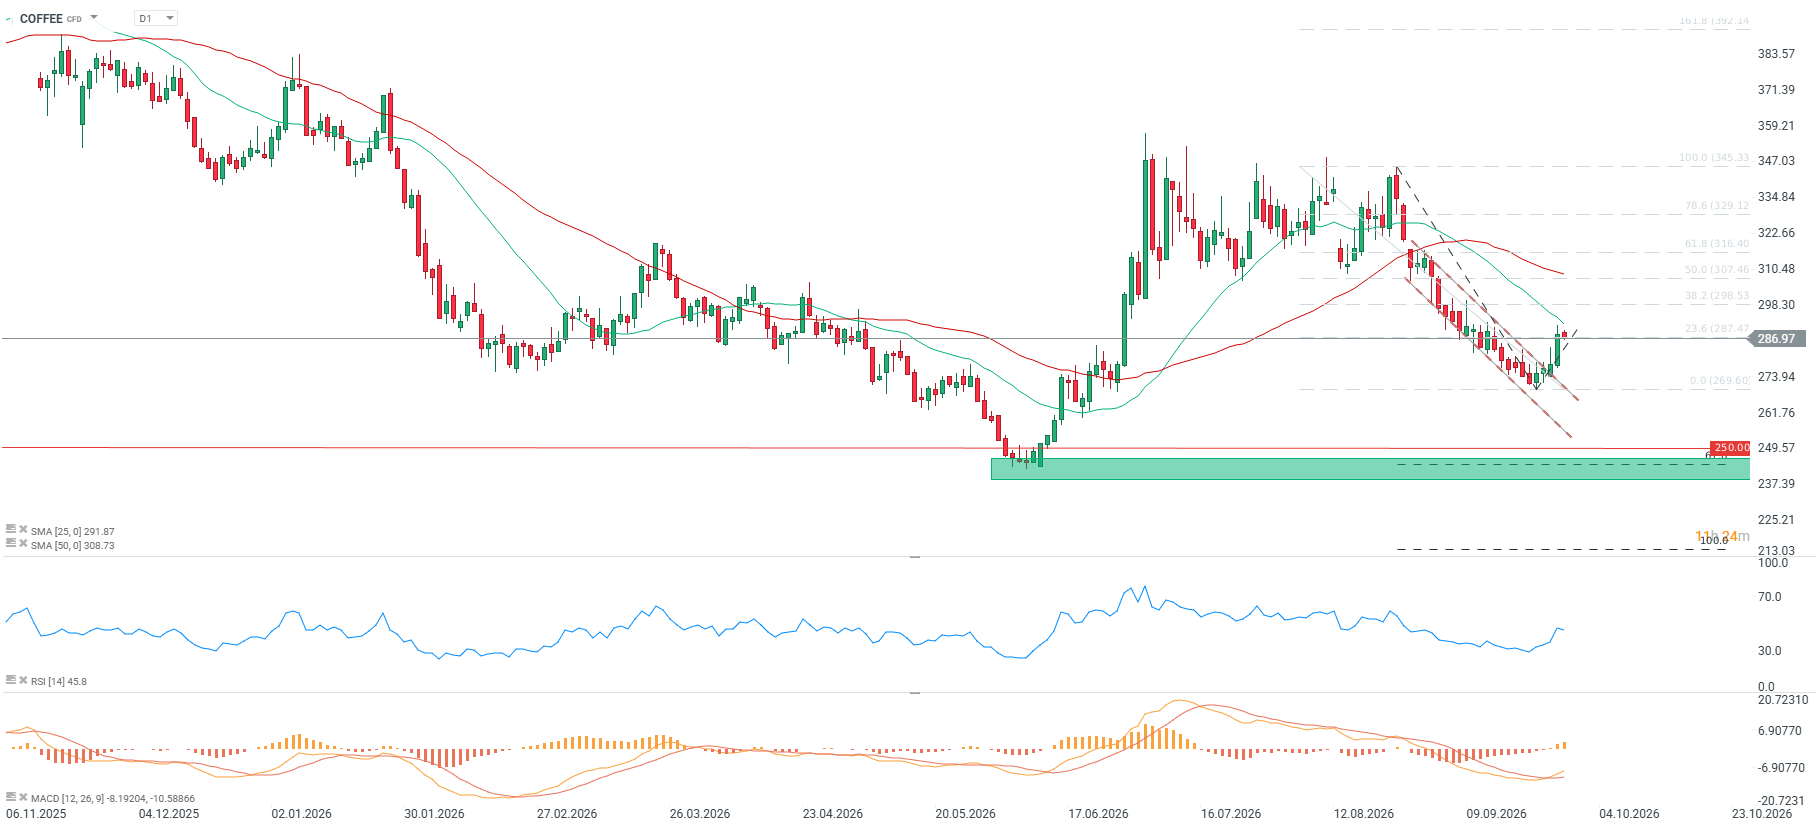
- The current coffee futures contract price stands at 289.77, recording a monthly drop of 7.23%, a year-to-date (YTD) decline of 18.41%, and a year-on-year correction of 22.55%.
- The RSI indicator sits at a neutral level of 49, while the SMA moving average generates bullish signals, further supported by a rising MACD indicator.
- Quotes remain 6.16% below the 50-session moving average under neutral market sentiment.
- A breakout from the downward trendline generates a potential bullish signal, but only a move above 300 cents per pound and above the 25 SMA would offer a chance for a sustained recovery and an attempt to reach the 50.0 retracement area of the latest downward wave.
- If coffee prices fail to climb back above 290 cents per pound, the current breakout might only represent a brief correction followed by an attempt to drop toward June lows below 250 cents per pound, where the 61.8 extension of the last corrective leg in the August-September downtrend lies.
Fundamental and Market Context
- Arabica coffee futures registered their largest monthly gain in New York, surging late in September by up to 4.6% to USD 2.915 per pound for December delivery after breaking through a key technical threshold at USD 2.84 per pound.
- Overall market fundamentals remain bearishly tilted, primarily influenced by Brazil continuing shipments of its massive current crop, expected to comfortably surpass 70 million bags total.
- Brazil is estimated to export between 4.3 million and 4.6 million bags of coffee in September, with the majority consisting of Arabica beans, which analysts consider a very strong volume.
- Meteorological forecasts project rainfall in Brazil over upcoming days, expected to stimulate and encourage flowering ahead of the next harvest season.
- Rainfall in Brazil’s largest Arabica coffee-growing region reached 29.7 mm last week, representing 112% of the historical norm for this period.
- The southern and southwestern regions of Minas Gerais state typically account for roughly 30% of domestic Arabica production, and historical average rainfall for this time stands at 26.4 mm, within a range of 0.6 mm to 79.4 mm.
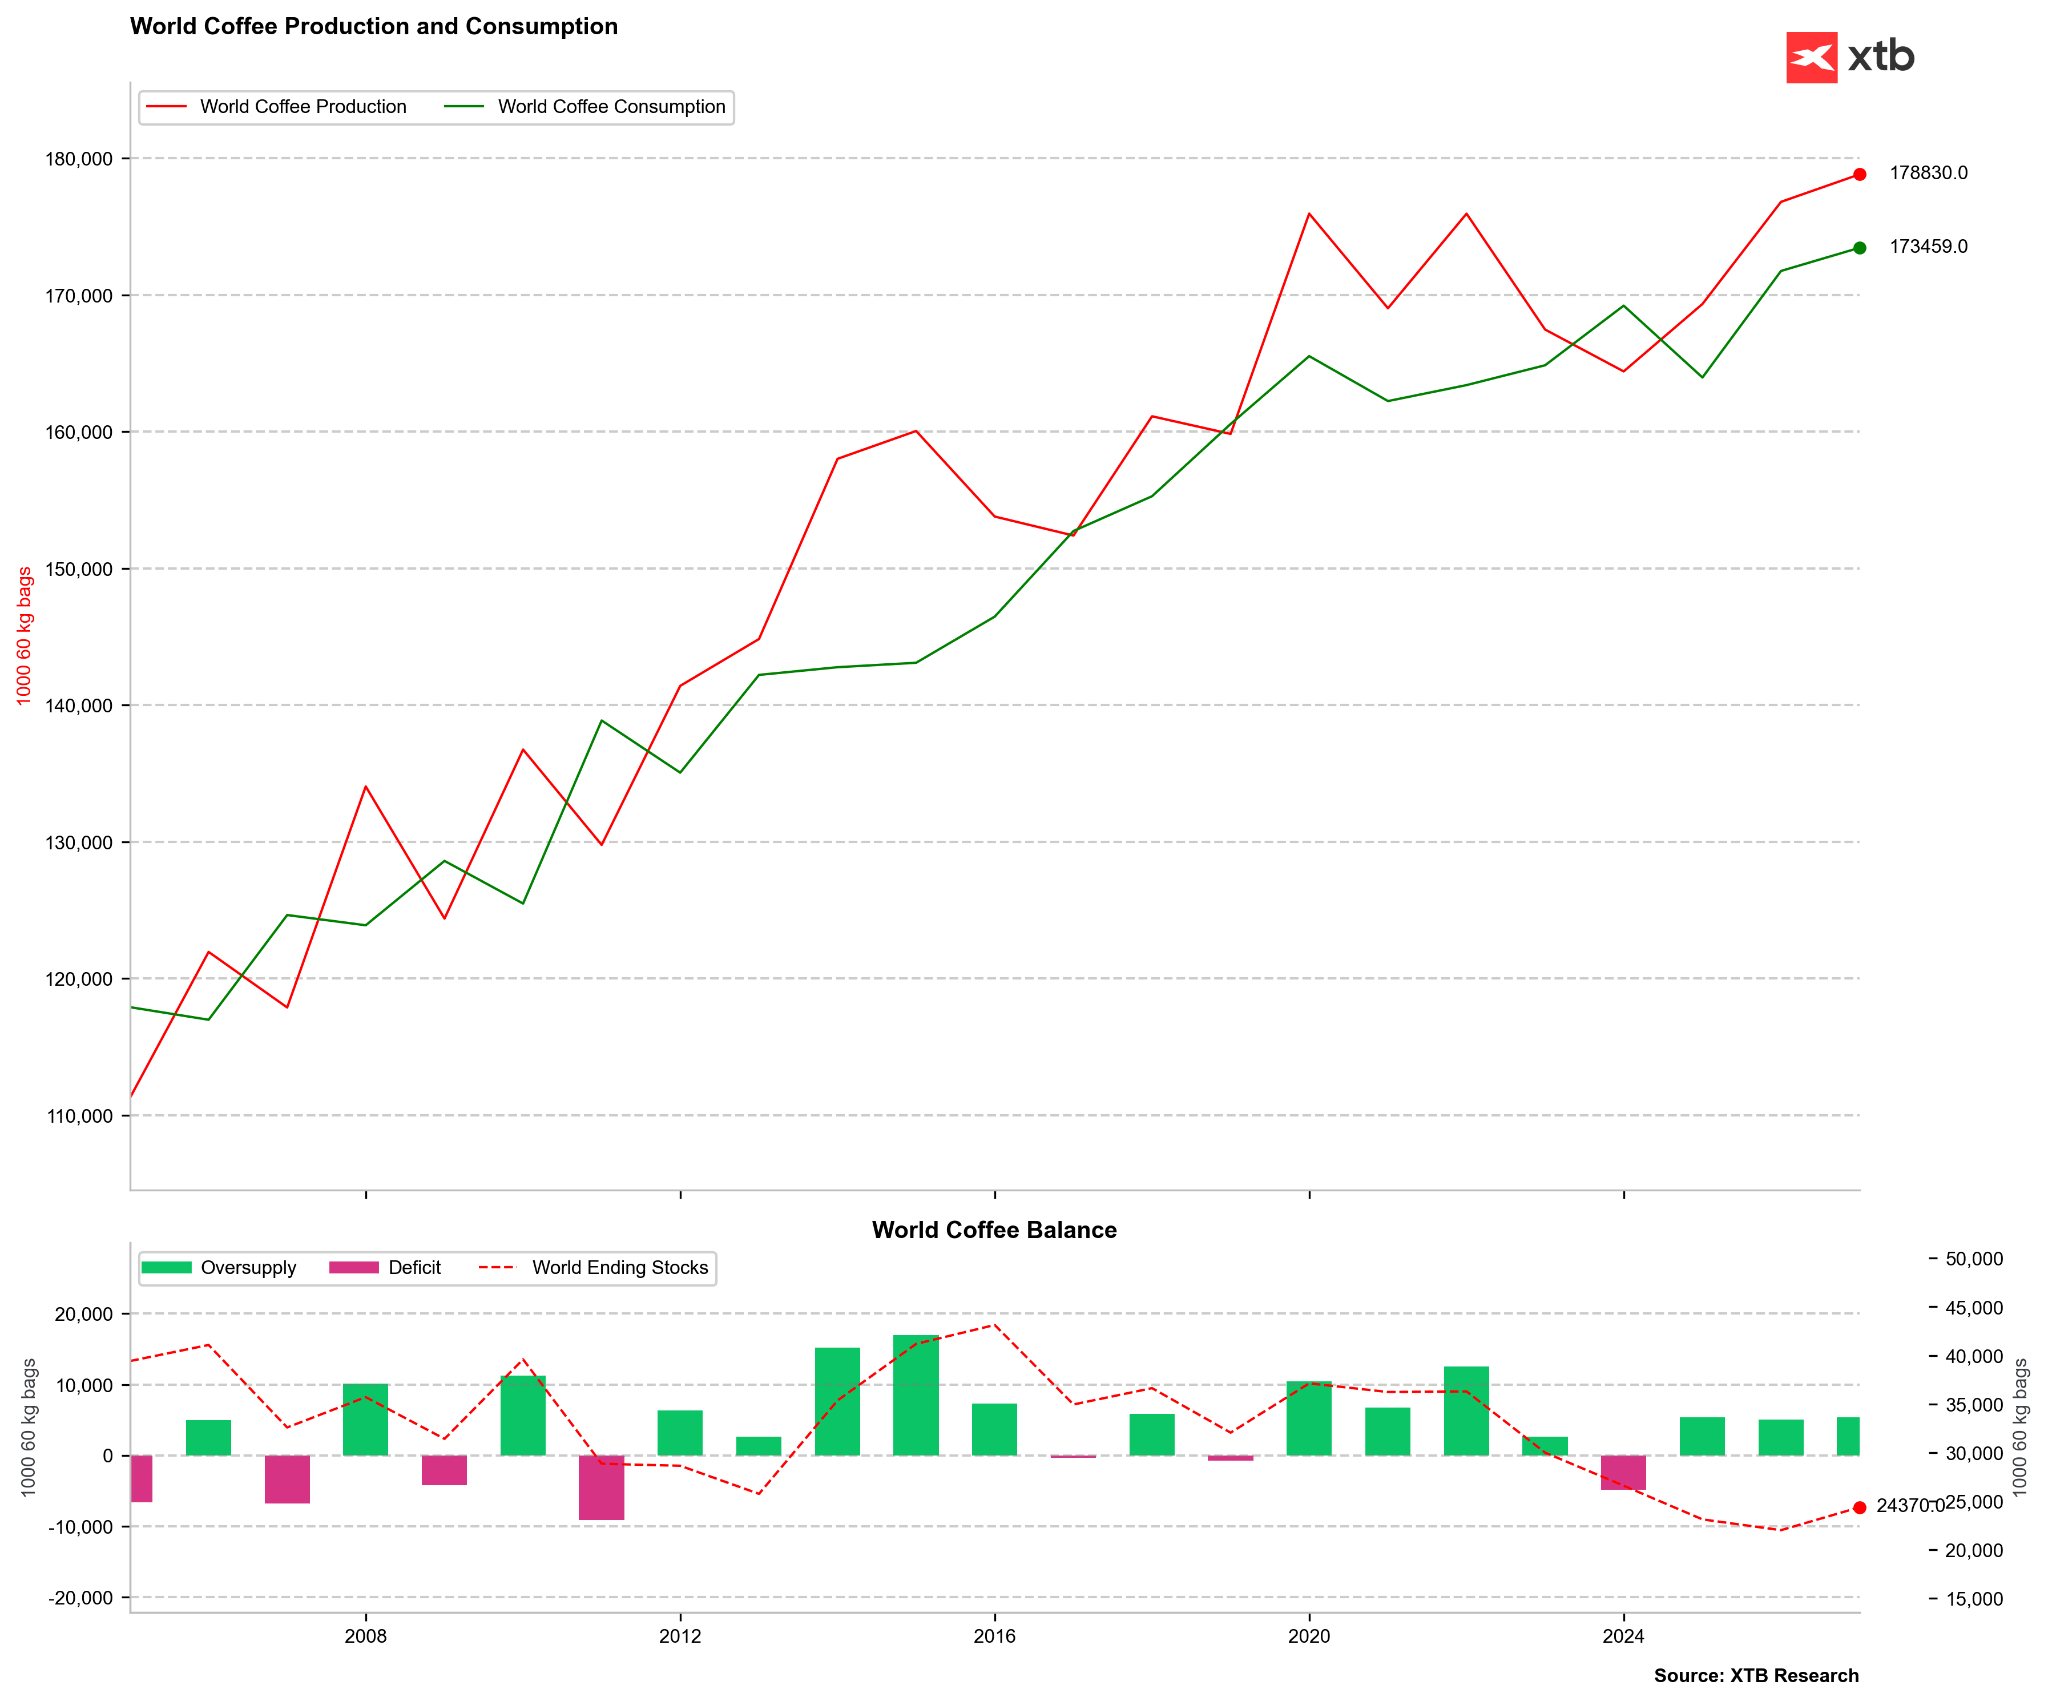
According to USDA data, the 26/27 season is set to be another year of heavy oversupply. Source: Bloomberg Finance LP, XTB
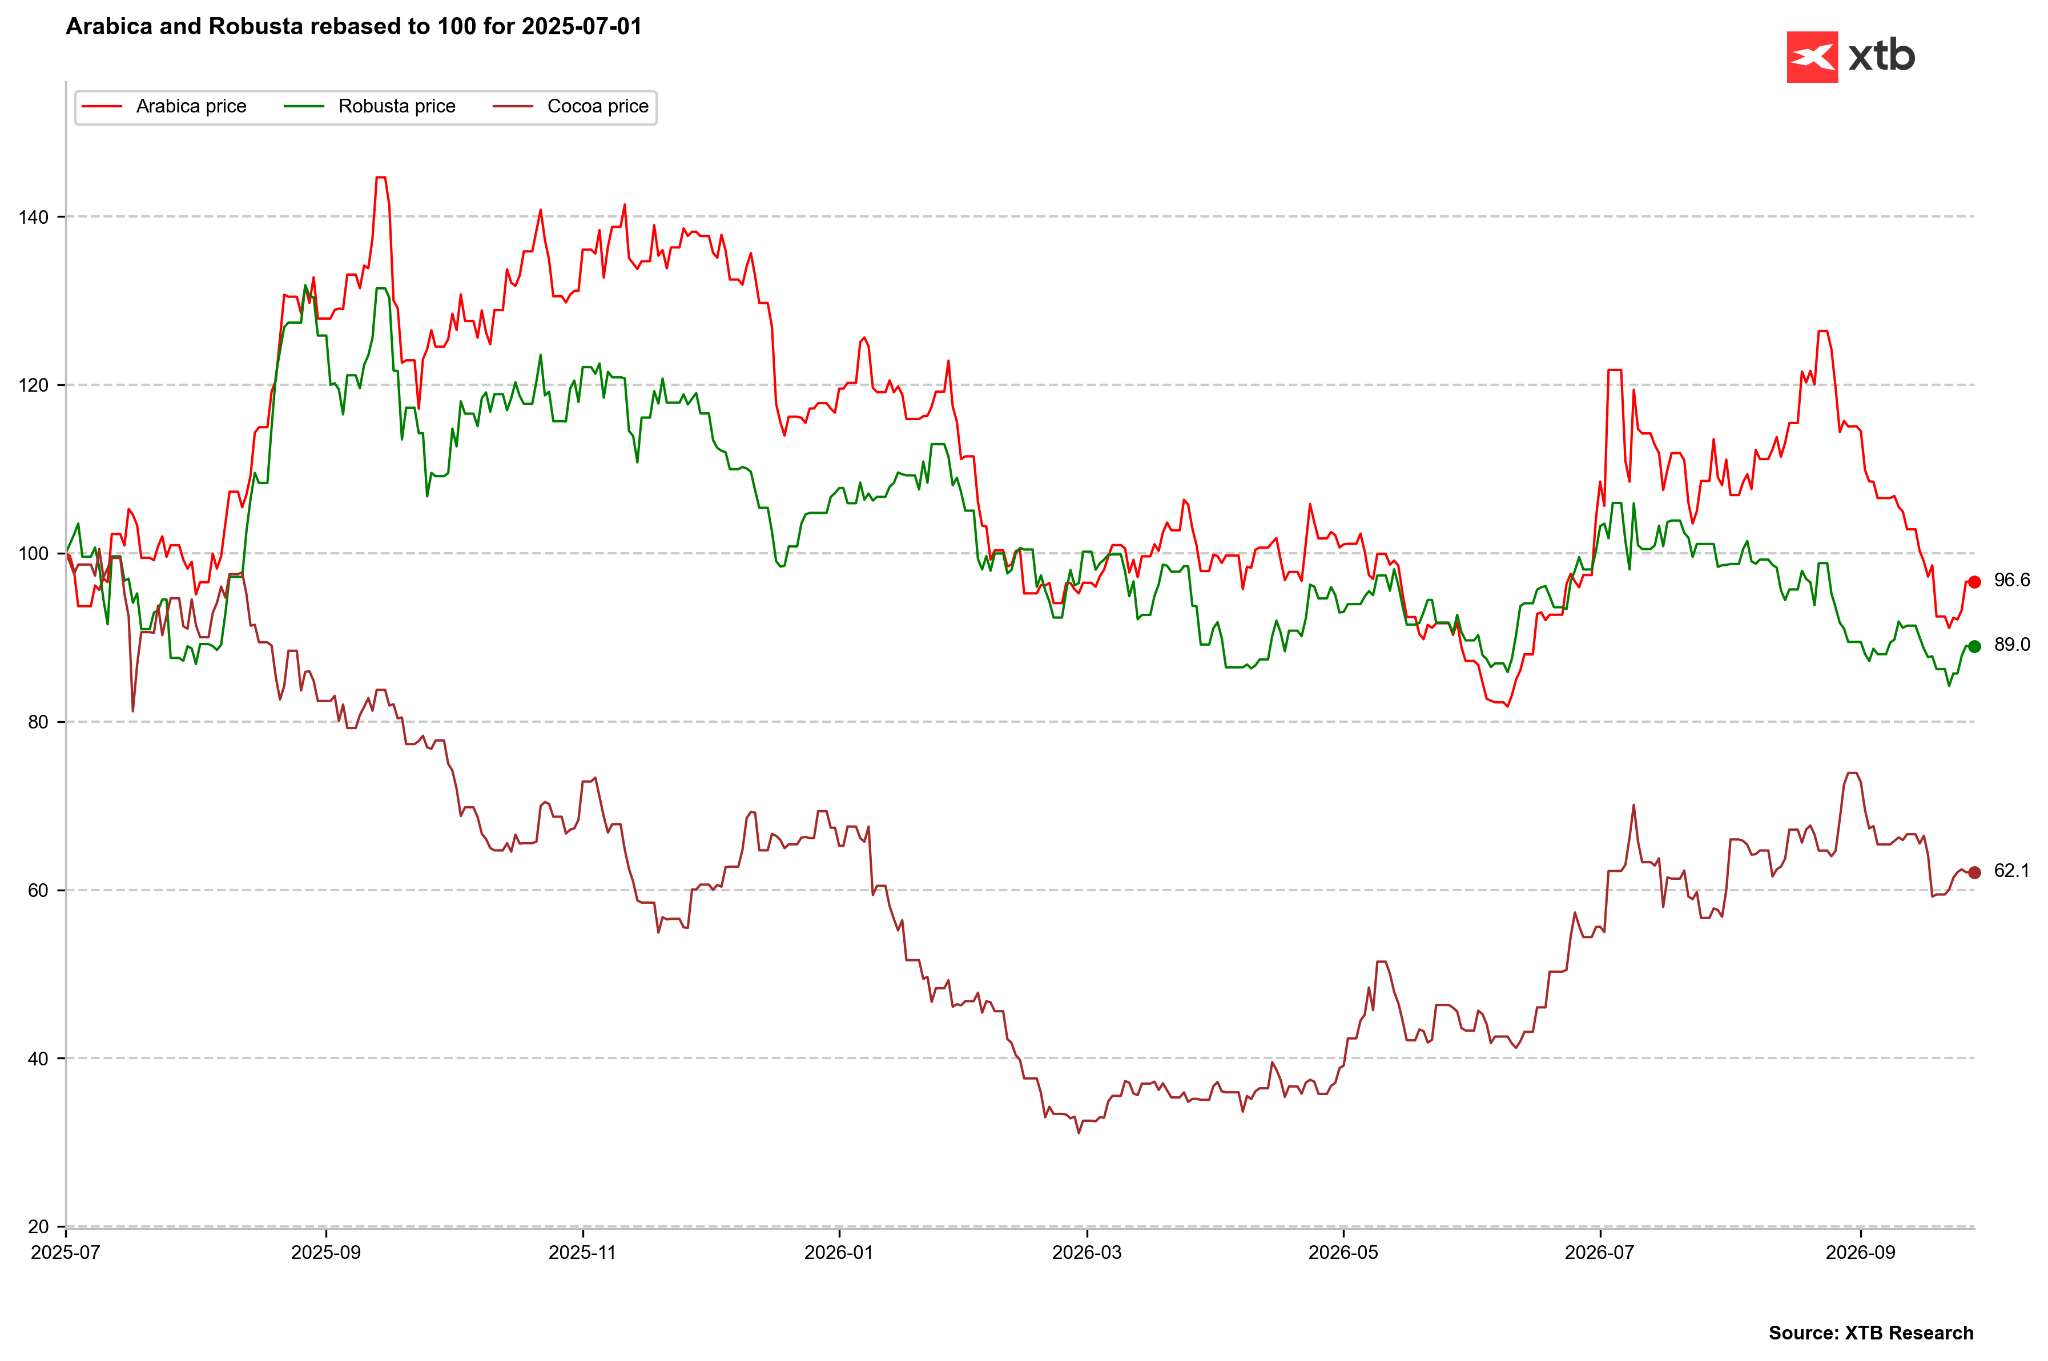
Arabica prices adjusted to match previously sharp declines in Robusta. However, it is worth remembering that Robusta could potentially face upside risks given El Niño’s impact on crops in Vietnam and Indonesia. Source: Bloomberg Finance LP, XTB
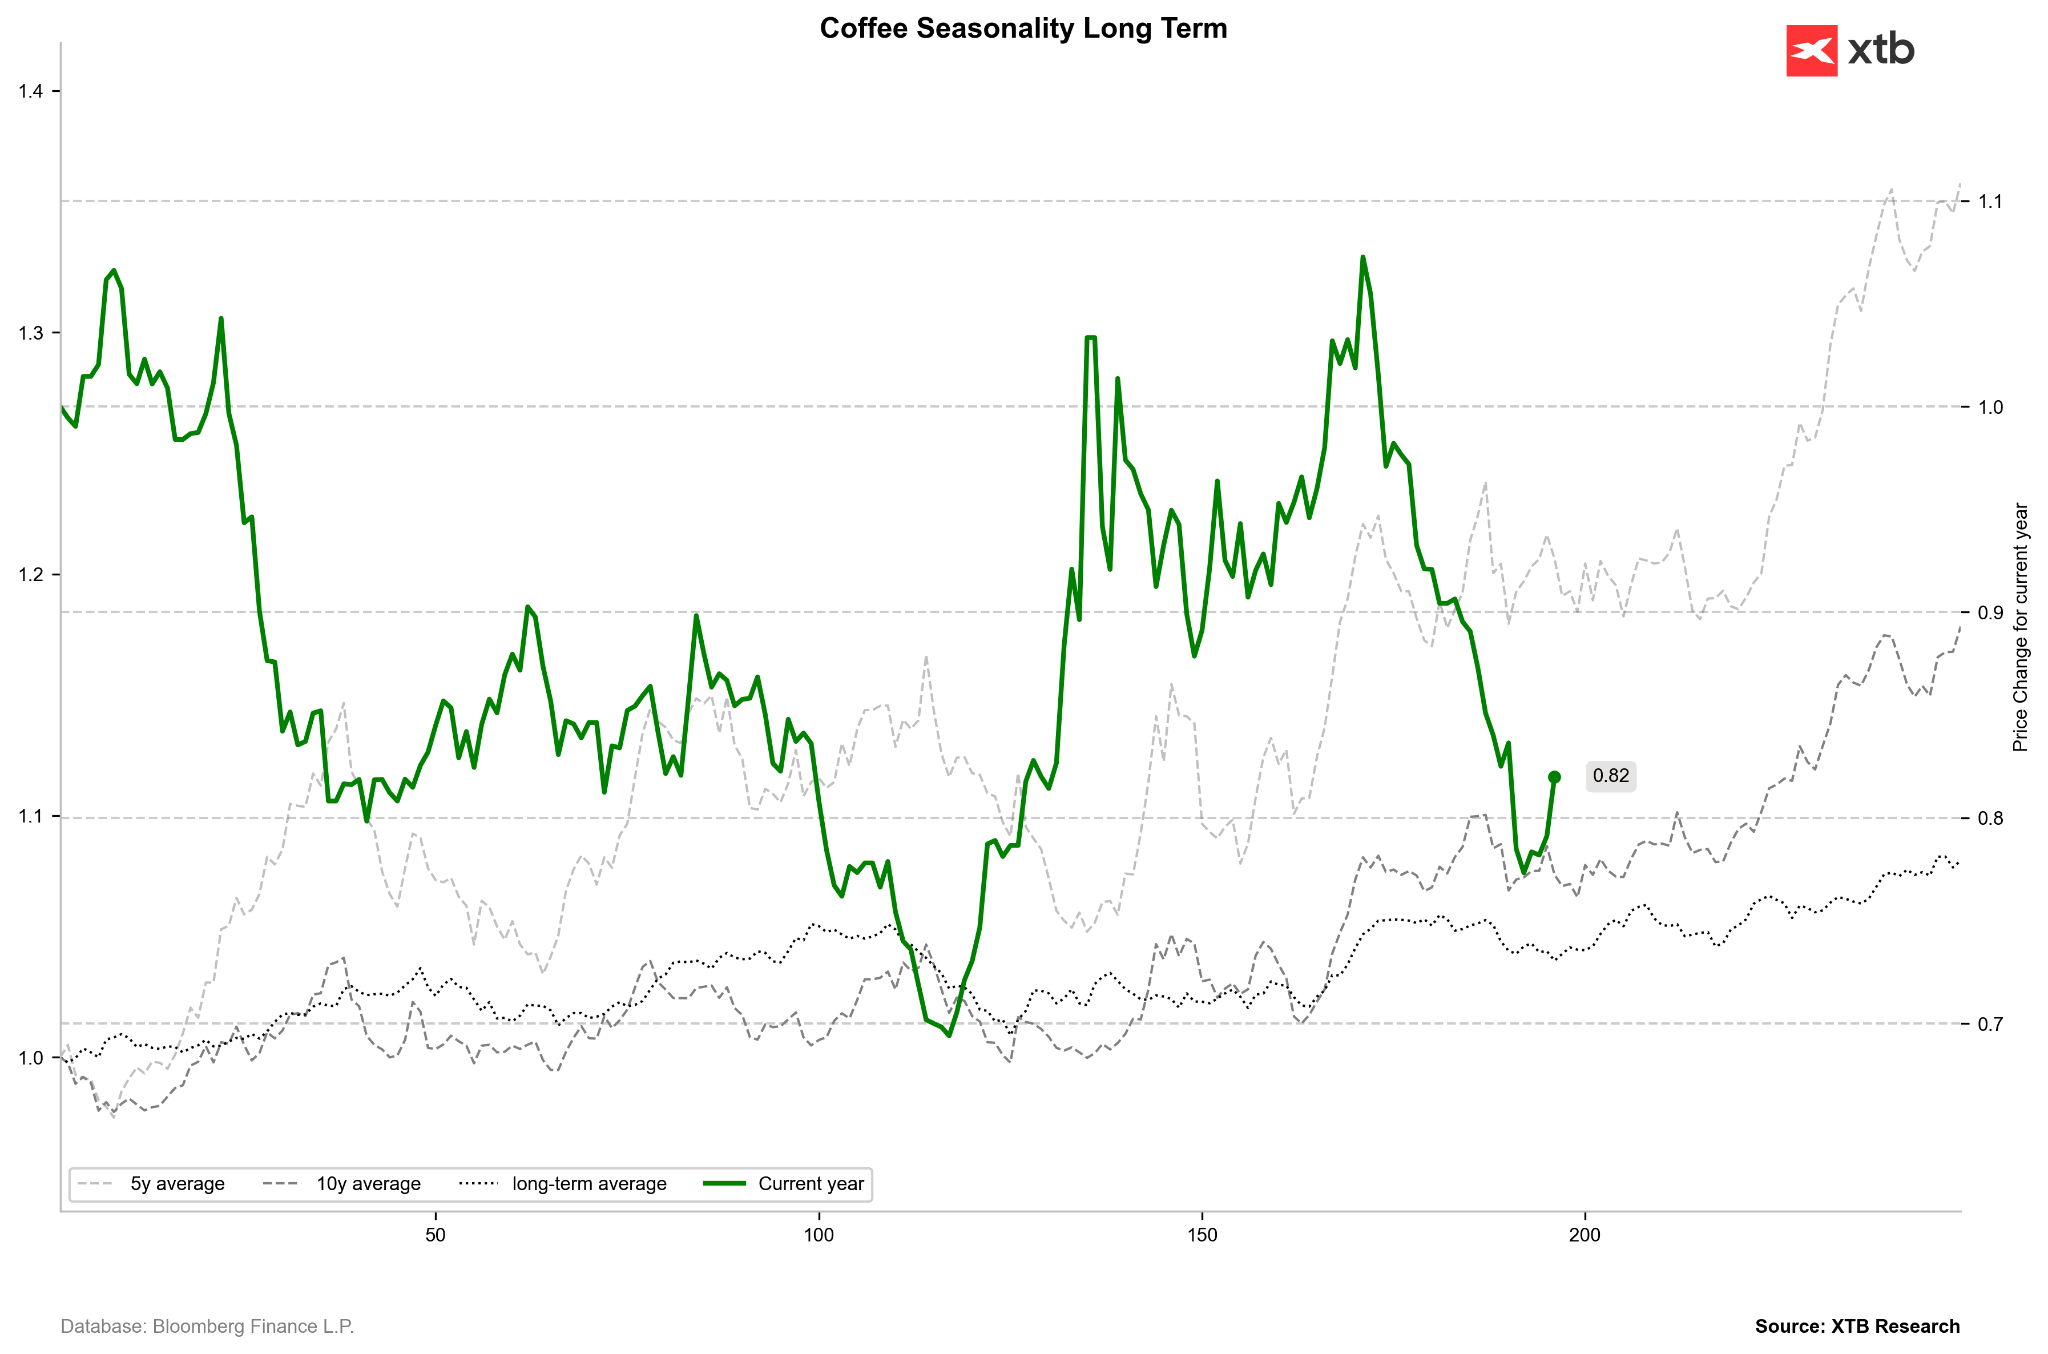
Looking at historical coffee price behavior, the very end of the year has typically been good for coffee. Seasonality shows consolidation through late November. Source: Bloomberg Finance LP, XTB
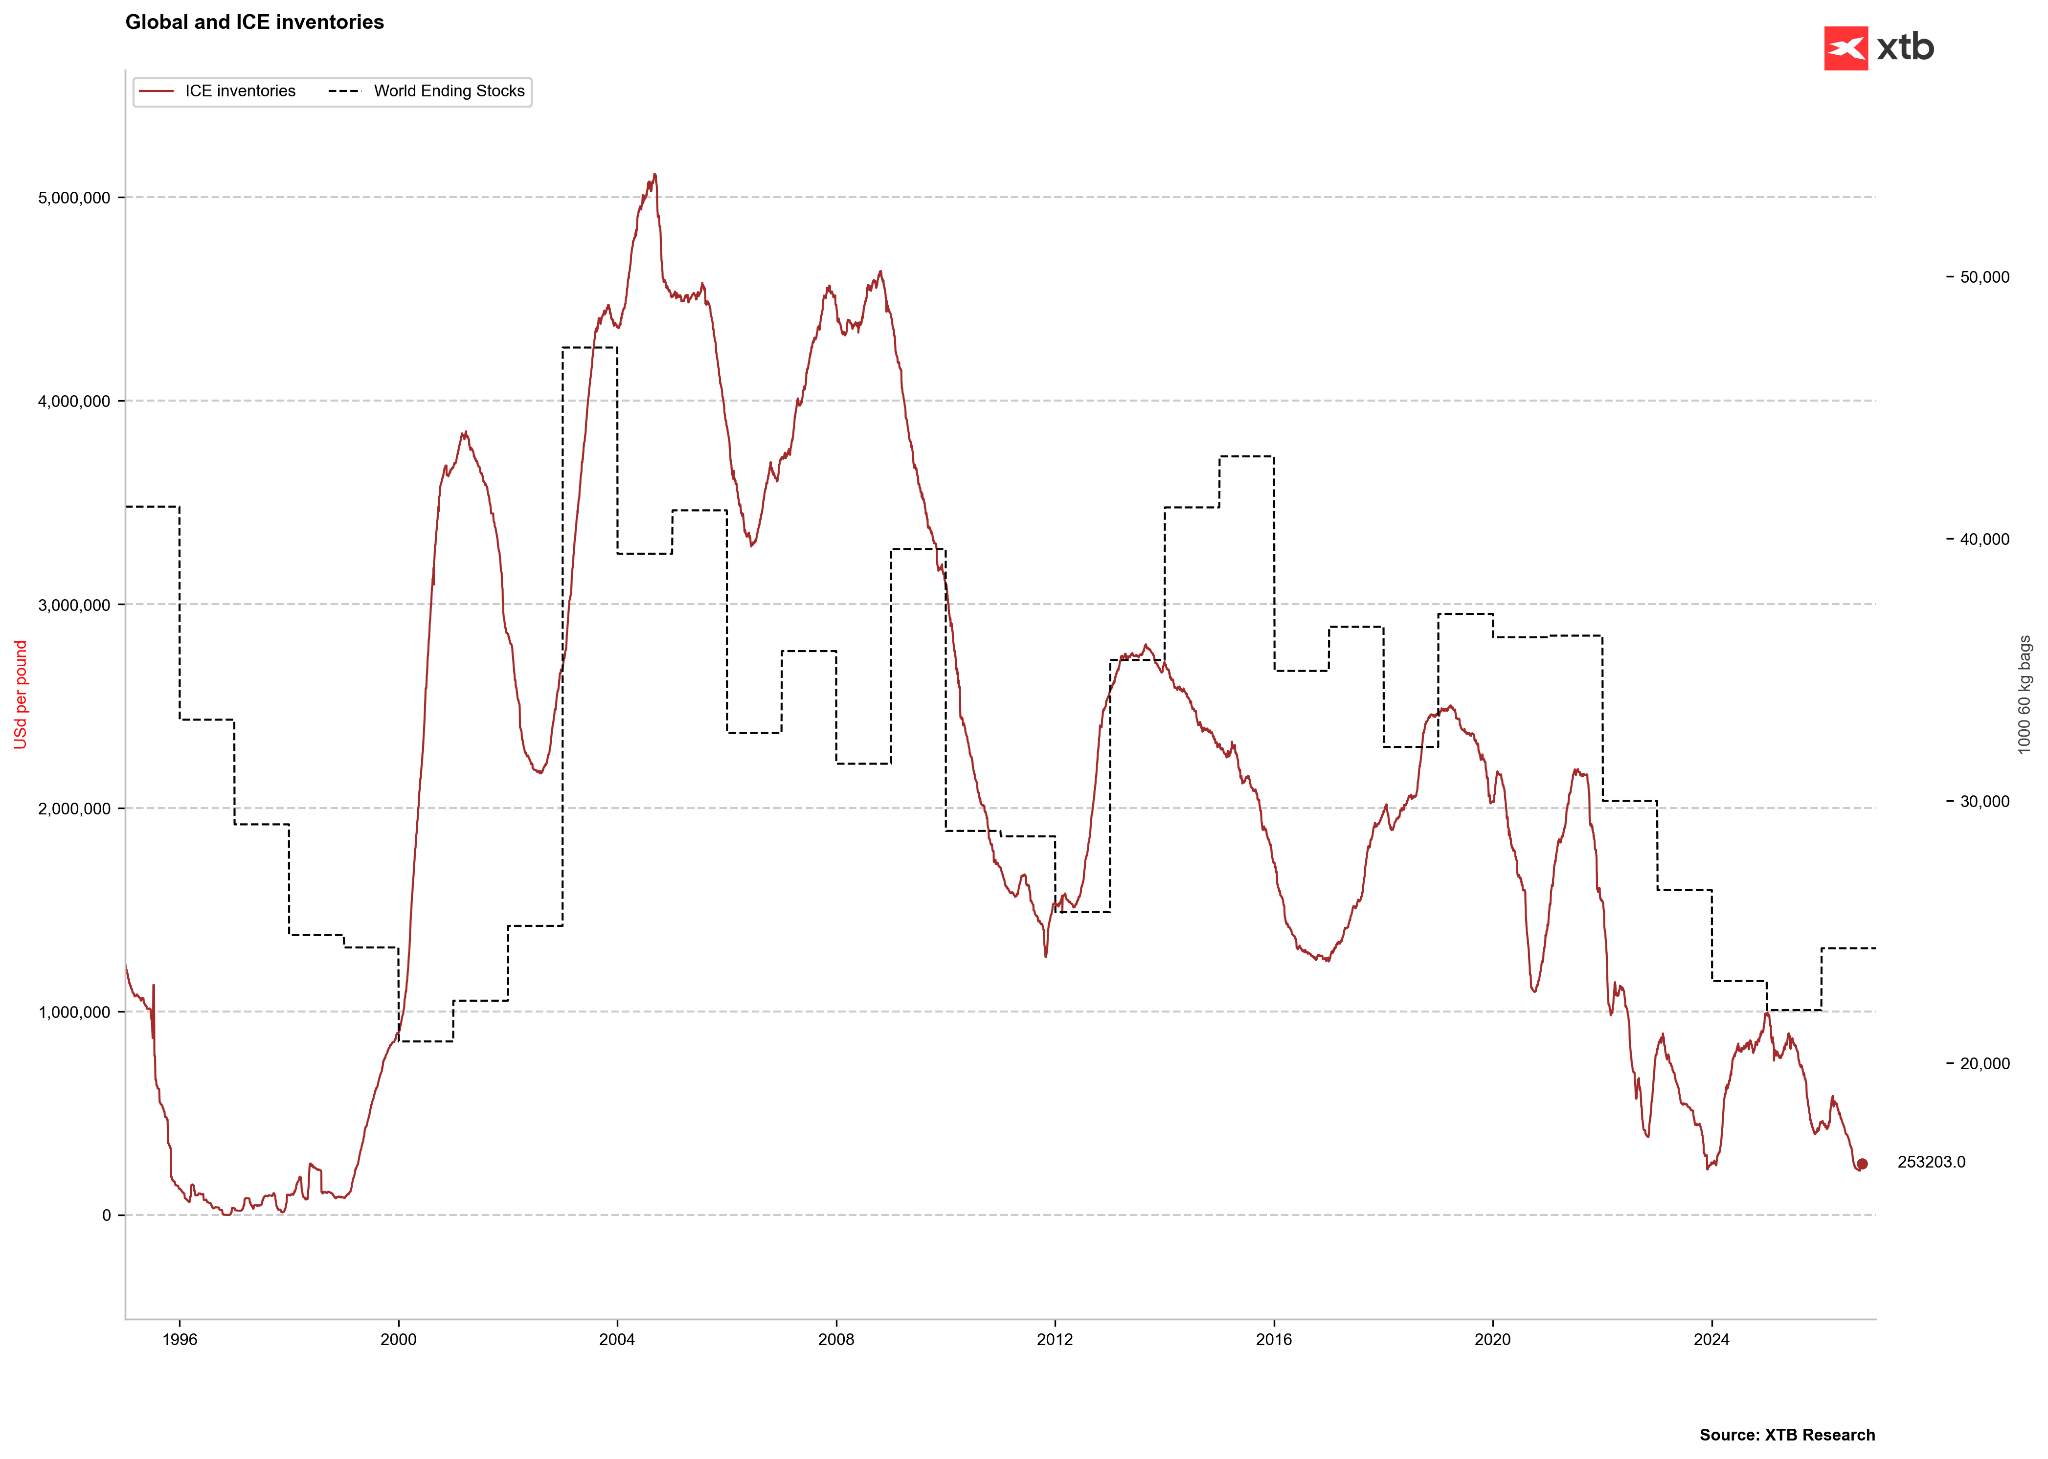
The 26/27 season is projected to bring the first increase in global inventories in many years, which could also spur a rebound in exchange stocks. Source: Bloomberg Finance LP, XTB
Historical Valuation (Z-score) and CFTC Positioning
- The Z-score for coffee stands at -0.74 on a 1-year horizon, -0.85 on a 2-year horizon, and +0.52 on a 5-year horizon.
- Analyzing 5-year Z-score dynamics over the past six months shows that it stood at +0.96 six months ago, dropped to +0.43 three months ago, rebounded to +0.83 one month ago, and has now settled at +0.52.
- According to CFTC data as of September 22, 2026, net speculative positioning stood at +10,273 contracts, with a Z-score of -1.52 and a percentile of 50.3%.
- On a weekly basis, a reduction in speculative exposure of 5,197 contracts was recorded, with the long position share reaching 57.0%.
- The above data points to moderate speculative fund positioning sitting right in the middle of the historical range (percentile near 50%).
- This balance generally confirms a moderate valuation based on the medium-term price Z-score, presenting no immediate risk of forced position unwinding or short squeezes, leaving the market in a technical consolidation phase driven by ongoing weather factors in South America.
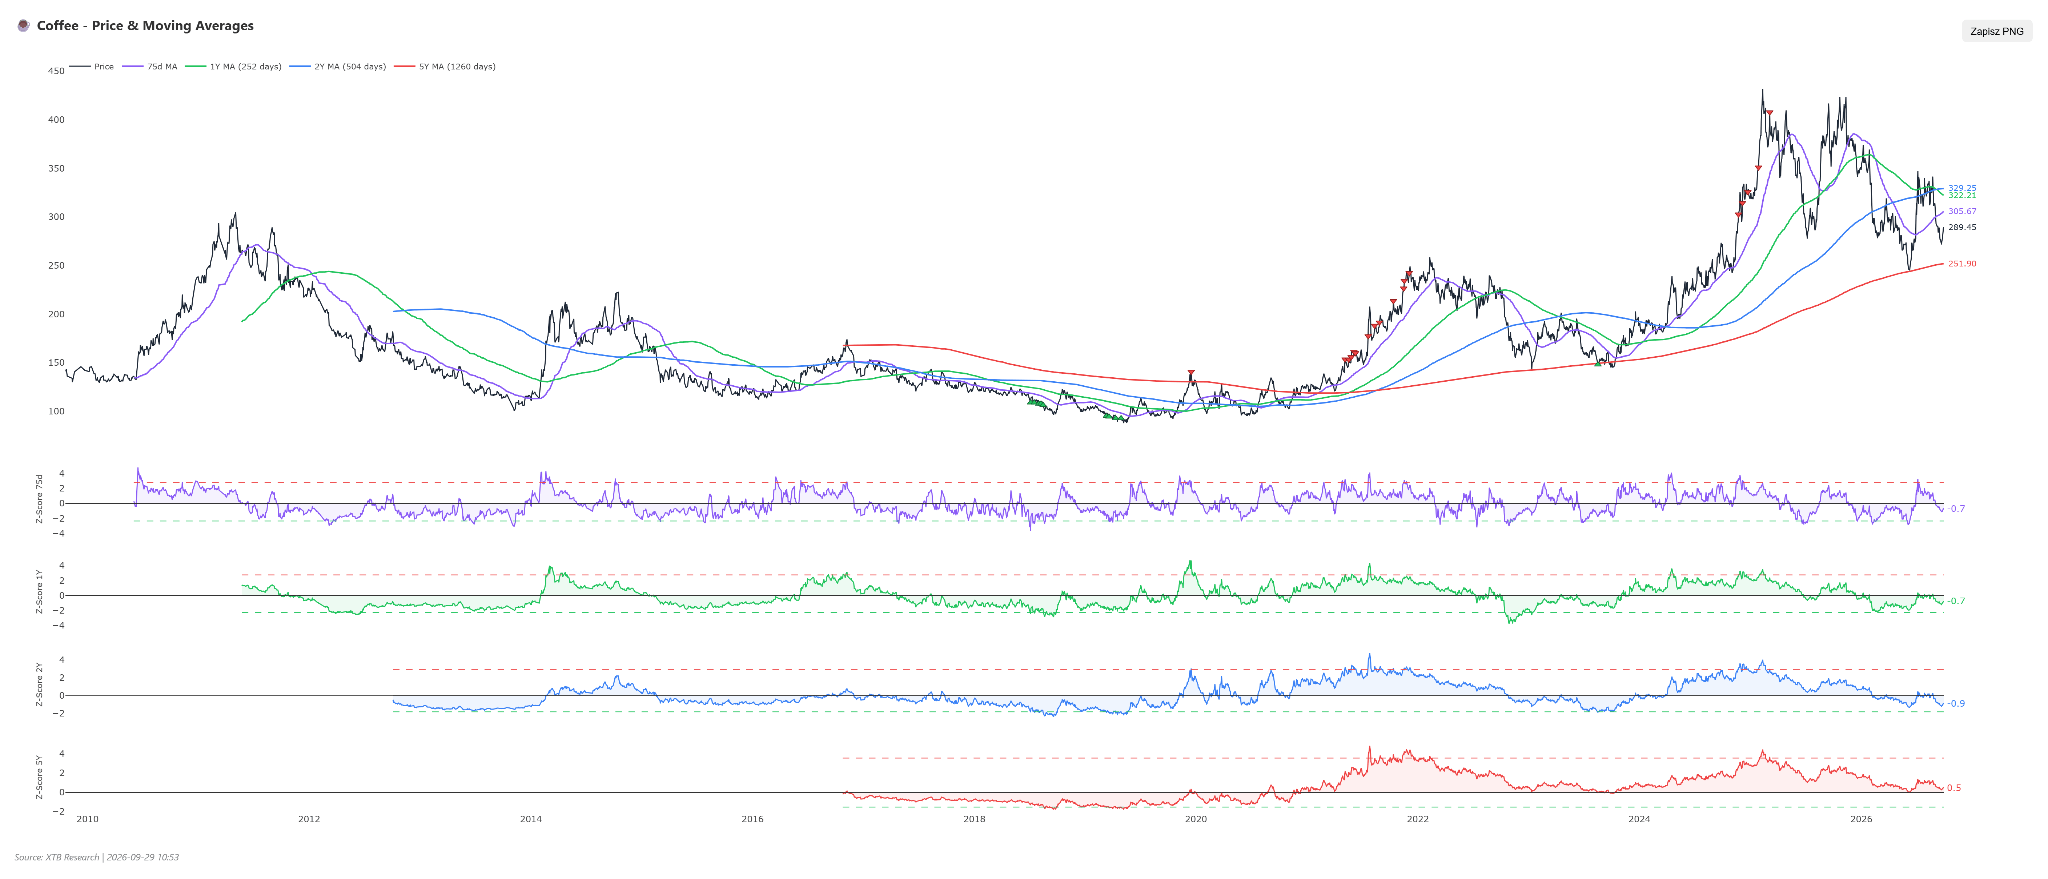
Coffee shows negative deviations from 3-month to 2-year moving averages and sits very close to the 5-year average. Source: Bloomberg Finance LP, XTB
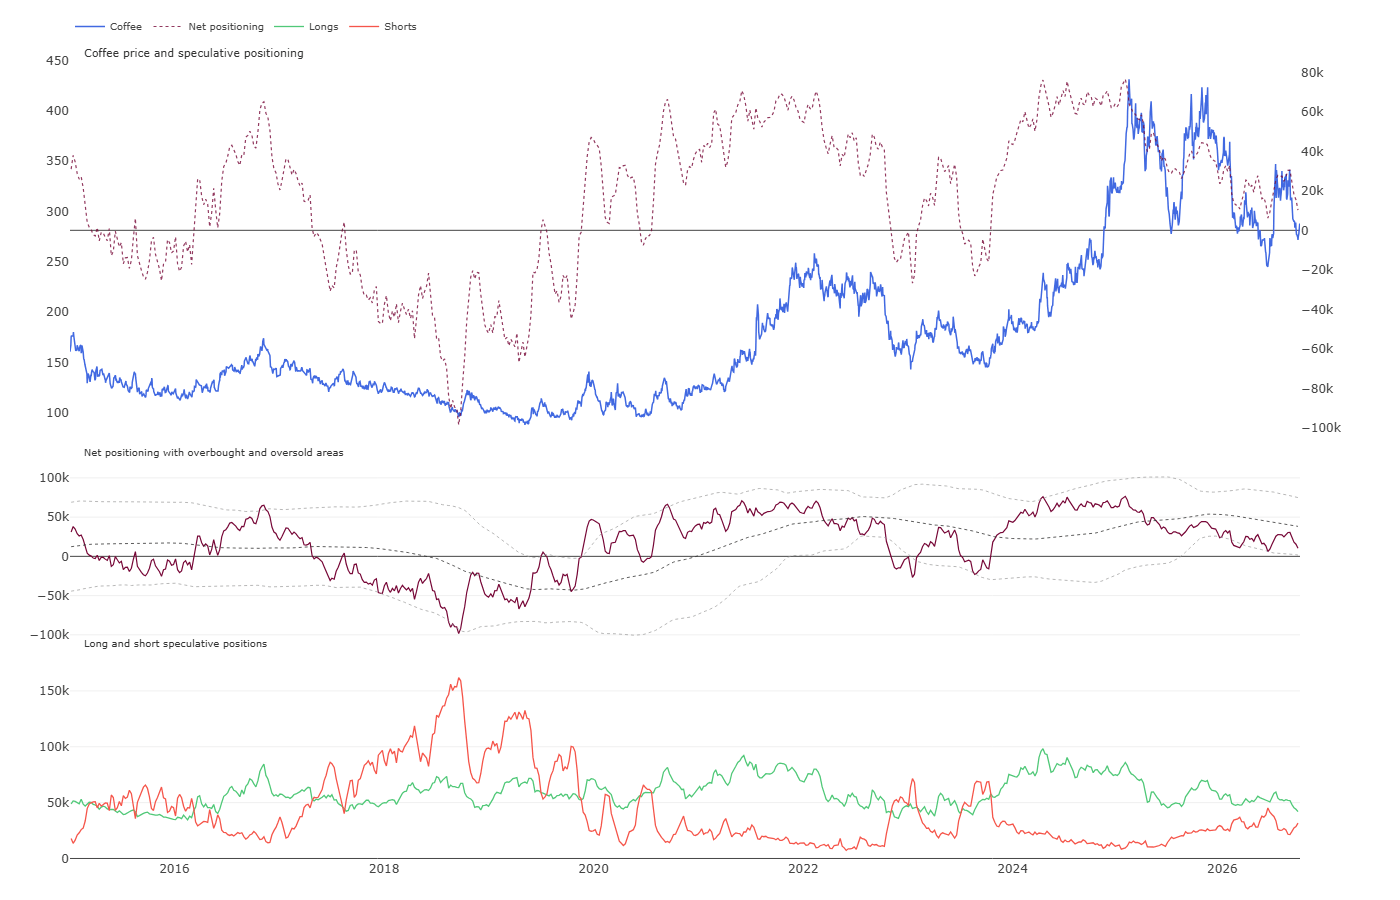
Long positions were recently reduced, falling to their lowest level since 2023. At that time, net positioning was also negative, acting as a contrarian indicator twice three years ago. Source: CFTC, XTB
Scenarios
- Bullish Scenario: This scenario plays out if current technical momentum is sustained following the breakout above key support, combined with additional weather anomalies or periodic droughts in key Brazilian growing regions that could threaten next year’s harvest. A necessary condition is also maintaining neutral-to-bullish momentum indicators alongside no sudden surge in South American export volumes. In such an environment, coffee prices could extend their move toward resistance located around USD 3.10 – 3.25 per pound.
- Bearish Scenario: This case assumes a return to dominant, structural bearish fundamentals, driven by the realization of forecasted abundant rainfall encouraging optimal flowering for the new crop in Brazil, alongside sustained record export pace from the country. Technical conditions require breaking below recent support levels and a price drop under USD 2.75 per pound, which would negate current buy signals from the SMA and MACD. Consequently, coffee prices could slide toward the support zone near USD 2.50 – 2.60 per pound.