S&P 500 — US Large Cap Index
 FTSE 100 — UK Blue Chips
 Euro Stoxx 50 — Eurozone Leaders
 DAX 40 — German Equities
 CAC 40 — French Market Index
 Nikkei 225 — Japan Benchmark
 Hang Seng — Hong Kong Index
 Shanghai Composite — China Mainland
 ASX 200 — Australian Market
 TSX Composite — Canada Index
 Nifty 50 — India Large Cap
 STI Index — Singapore Market
 KOSPI — South Korea Index
 Bovespa — Brazil Equities
 JSE Top 40 — South Africa Index
 IPC Index — Mexico Market
WTI Crude Oil Forecast: Bulls Target $93 as Geopolitical Risk Supports Oil Above Key Fibonacci Levels


WTI crude oil prices recovered toward $93.00 per barrel on Tuesday after falling for four consecutive sessions and briefly slipping below $91.00, marking the lowest level in almost two weeks. The rebound reflects renewed buying interest as geopolitical tensions in the Middle East continue to provide support to the oil market.
The latest recovery comes as Iran’s Islamic Revolutionary Guard Corps warned that it could expand the geographical scope of the conflict if the United States escalates its involvement. The threat keeps a significant geopolitical risk premium embedded in crude prices and provides a fundamental tailwind for WTI.
However, improving energy shipments through the Strait of Hormuz and growing expectations of potential US-Iran discussions at the United Nations General Assembly could limit the upside. Traders are therefore balancing renewed geopolitical risks against the possibility of improved regional stability and energy flows.
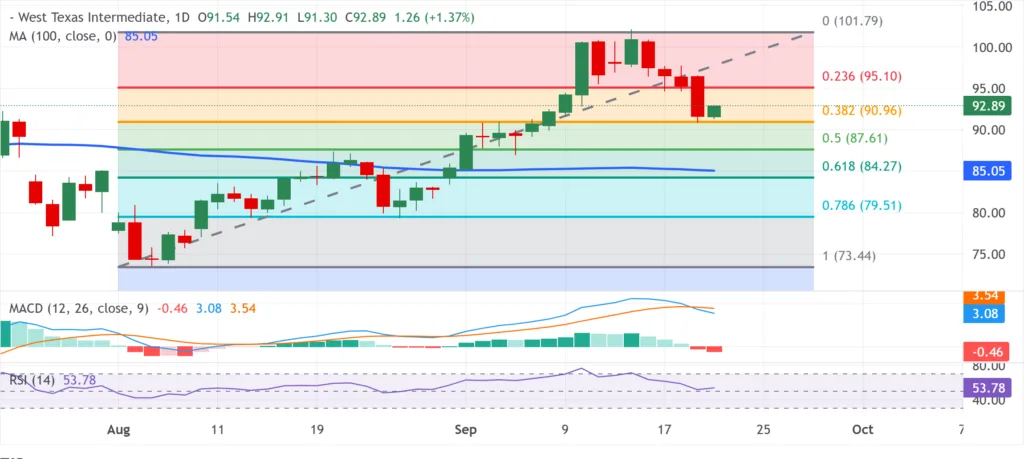
Technically, WTI retains a bullish structure while prices remain above the key 38.2% Fibonacci retracement at $90.96 and the 100-day SMA at $85.05. The latest decline therefore continues to look more like a correction within a broader recovery rather than a confirmed trend reversal.
WTI Crude Oil Market Snapshot
| Market Factor | Current Situation |
|---|---|
| WTI Price | Just below $93.00 |
| Daily Move | Around +1.40% |
| Recent Low | Below $91.00 |
| Short-Term Bias | Bullish recovery |
| Key Fibonacci Support | $90.96 |
| Secondary Fibonacci Support | $87.61 |
| Major Fibonacci Support | $84.27 |
| 100-Day SMA | $85.05 |
| Immediate Resistance | $95.10 |
| Major Resistance | $101.79 |
| RSI | Around 54 |
| MACD | Below signal line |
| Main Fundamental Driver | Middle East geopolitical risk |
WTI Price Today: Crude Rebounds Toward $93
WTI gained around 1.40% during Tuesday’s Asian session, snapping a four-session losing streak that had taken prices below $91.00.
The recovery suggests that buyers remain willing to defend the broader bullish structure, particularly as geopolitical developments continue to create uncertainty around Middle Eastern energy supplies.
The immediate test is whether WTI can reclaim and sustain prices around $93.00. A stronger recovery above this level would bring the next technical resistance areas into focus.
Middle East Tensions Keep the Oil Risk Premium Alive
Geopolitical risk remains one of the principal supports for crude oil.
Iran’s Islamic Revolutionary Guard Corps warned that the geography of the conflict could change if the United States escalates its involvement. Such warnings increase uncertainty surrounding regional energy infrastructure and shipping routes.
Oil markets typically respond quickly to the possibility of supply disruption because even a relatively small interruption can have a significant impact on global inventories and prices.
As a result, geopolitical developments remain capable of producing sharp upside moves in WTI even after recent profit-taking.
Strait of Hormuz Flows Limit the Upside
While geopolitical risks remain elevated, improving shipments through the Strait of Hormuz are providing an important counterweight.
The Strait is a critical global energy corridor, meaning continued movement of oil and other energy products through the waterway can reduce immediate concerns about physical supply shortages.
If flows continue improving and diplomatic efforts gain traction, some of the geopolitical premium currently incorporated into crude prices could unwind.
This creates a key tension for WTI: escalating geopolitical risk supports prices, while improving physical flows and diplomacy could cap gains.
US-Iran Diplomacy Becomes a Key Market Catalyst
Markets are closely monitoring the possibility of US-Iran talks during the United Nations General Assembly.
Any meaningful progress toward negotiations could reduce fears of a wider conflict and put downward pressure on the geopolitical premium embedded in crude.
Conversely, a deterioration in diplomatic relations or further escalation could quickly increase concerns over supply routes and energy infrastructure.
For oil traders, diplomatic headlines could therefore become as important as traditional supply-and-demand data over the coming sessions.
WTI Technical Analysis: $90.96 Fibonacci Support Holds
The technical structure remains constructive despite the recent four-session decline.
WTI continues to trade above the 38.2% Fibonacci retracement at $90.96 and the 100-day SMA at $85.05.
The 61.8% Fibonacci retracement at $84.27 also forms part of the broader structural support zone.
Momentum has moderated, however. The 14-day RSI is around 54, which indicates a relatively neutral-to-positive momentum environment rather than an overbought market.
Meanwhile, the MACD has slipped below its signal line and turned negative on the histogram, reflecting the recent correction.
The combination suggests that short-term momentum has weakened but has not yet invalidated the broader bullish technical structure.
WTI Support Levels
The first major downside level is the 38.2% Fibonacci retracement at $90.96.
A decisive break below this level could expose the 50.0% retracement at $87.61, followed by the 61.8% retracement at $84.27.
The 100-day SMA at $85.05 sits close to this deeper support region and could provide an additional layer of demand.
Below the 100-day average, further Fibonacci anchors are located at $79.51 and $73.44.
WTI Resistance Levels
On the upside, immediate resistance is located at the 23.6% Fibonacci retracement at $95.10.
A sustained break above $95.10 could expose the cycle-high region around $101.79.
The $101.79 area is particularly important because traders could begin taking profits if WTI returns toward the recent cycle highs.
Bullish Sentiment
1. Geopolitical Risk Supports Crude
Continued tensions involving Iran and the United States are keeping a geopolitical risk premium embedded in oil prices.
2. WTI Holds Above $90.96
The 38.2% Fibonacci retracement at $90.96 remains an important technical defence level. Holding above it preserves the broader bullish structure.
3. WTI Remains Above the 100-Day SMA
Prices remain comfortably above the 100-day SMA at $85.05, reinforcing the longer-term constructive technical structure.
4. Potential Supply Disruption Risks
Any deterioration in the Middle East conflict could threaten regional energy flows and rapidly increase the value of the geopolitical premium.
5. Break Above $95.10 Could Accelerate the Recovery
A sustained move above $95.10 would strengthen the bullish technical setup and put the $101.79 cycle-high region back into focus.
Bearish Sentiment
1. Improving Strait of Hormuz Shipments
Continued energy flows through the Strait of Hormuz could reduce immediate supply concerns and limit geopolitical risk premiums.
2. US-Iran Talks Could Reduce Risk Premium
Successful diplomatic discussions could encourage traders to remove some of the premium currently associated with the Middle East conflict.
3. MACD Momentum Has Turned Negative
The MACD has moved below its signal line and the histogram has turned negative, highlighting weakening short-term momentum.
4. Break Below $90.96 Would Weaken the Bullish Structure
A decisive move below the 38.2% Fibonacci retracement at $90.96 would expose deeper support at $87.61 and $84.27.
5. Profit-Taking Near $101.79
If WTI returns toward the cycle high around $101.79, traders could begin locking in gains, potentially limiting additional upside.
WTI Crude Oil Price Forecast: What Traders Are Watching
The immediate WTI outlook is centred on whether buyers can reclaim $93.00 and subsequently challenge the $95.10 Fibonacci resistance.
A sustained break above $95.10 would strengthen the recovery and could put the $101.79 cycle high back into focus.
On the downside, $90.96 is the critical near-term support level. A decisive break below it would increase the probability of a deeper correction toward $87.61, with $84.27 and the 100-day SMA at $85.05 forming a broader structural support area.
The fundamental picture remains closely tied to developments in the Middle East, particularly the balance between geopolitical escalation and diplomatic progress.
WTI Crude Oil Supply Outlook
The supply outlook remains highly dependent on regional developments.
Continued energy shipments through the Strait of Hormuz are currently helping to prevent the market from pricing an immediate severe supply disruption.
However, the possibility of further escalation means that traders remain sensitive to any threat involving regional production, transportation infrastructure or shipping routes.
The oil market is therefore likely to retain a substantial geopolitical component even if physical supply remains available.
WTI Crude Oil Demand Outlook
Demand expectations will remain linked to the broader global economic outlook.
A deterioration in global growth could reduce fuel consumption expectations and create a counterweight to geopolitical supply risks.
Conversely, resilient economic activity would provide a stronger underlying demand environment, particularly if geopolitical risks simultaneously restrict available supply.
The interaction between physical demand and geopolitical supply risk will therefore remain central to WTI’s medium-term direction.
WTI Market Outlook for the Coming Sessions
WTI has regained momentum after defending the $90.96 Fibonacci support, but the recovery still faces significant resistance above the market.
The first major upside test is $95.10, followed by the $101.79 cycle-high region.
On the downside, a failure to hold $90.96 would shift attention toward $87.61, $84.27 and the 100-day SMA at $85.05.
Fundamentally, the market remains caught between two opposing forces: geopolitical escalation supporting crude prices and improving energy flows plus diplomatic efforts limiting the upside.
This combination could produce elevated volatility, with geopolitical headlines capable of rapidly changing the balance between bullish and bearish forces.
Currency Hedger View
Currency Hedger monitors crude oil because movements in energy prices can have significant implications for inflation, interest-rate expectations, trade balances and major currency pairs.
For businesses exposed to international energy costs or cross-border currency movements, sharp changes in crude prices can alter both operating costs and foreign-exchange requirements.
Currency Hedger provides managed FX services for business and personal clients, helping clients manage international currency requirements and navigate changing foreign-exchange conditions.
Today Markets View
WTI crude oil has recovered toward $93.00 after defending the critical $90.96 Fibonacci support, keeping the broader technical structure constructive.
The immediate upside target is $95.10, with a sustained break potentially opening the way toward the $101.79 cycle high.
However, the market remains highly sensitive to Middle East developments. Improving energy shipments through the Strait of Hormuz and hopes for US-Iran talks could limit the geopolitical premium, while any escalation could rapidly strengthen crude prices.
For traders, the key technical battle remains $90.96 support versus $95.10 resistance, with the outcome likely to determine whether the current recovery develops into another leg higher or gives way to a deeper correction.
Louis Roche, Analyst, Today Markets