S&P 500 — US Large Cap Index
 FTSE 100 — UK Blue Chips
 Euro Stoxx 50 — Eurozone Leaders
 DAX 40 — German Equities
 CAC 40 — French Market Index
 Nikkei 225 — Japan Benchmark
 Hang Seng — Hong Kong Index
 Shanghai Composite — China Mainland
 ASX 200 — Australian Market
 TSX Composite — Canada Index
 Nifty 50 — India Large Cap
 STI Index — Singapore Market
 KOSPI — South Korea Index
 Bovespa — Brazil Equities
 JSE Top 40 — South Africa Index
 IPC Index — Mexico Market


- Silver price rebounds to near $54.50 from its YTD low of $53.46.
- The outlook of the Silver price remains uncertain due to higher oil prices.
- Investors expect the Fed to hold interest rates steady on Wednesday.
Silver price (XAG/USD) claws back a majority of its early losses and rebounds to near $54.50 in the early European trade on Friday. The white metal bounces back after posting a fresh Year-Till-Date (YTD) low near $53.46.
The outlook of the Silver price remains uncertain amid rising oil prices due to energy supply risks. Higher oil prices stimulate global inflation expectations, a scenario that prompts expectations of higher interest rates by central banks. Such a case diminishes the appeal of non-yielding assets, like Silver. At press time, the WTI Oil price is up 1.5% above $100.
Energy supply risks have increased due to fears of fresh escalation in Middle East tensions. This week, the US State Department ordered non-emergency personnel and family members to leave American embassies in Saudi Arabia, Reuters reported.
Going forward, the major trigger for the Silver price will be the Federal Reserve’s (Fed) monetary policy announcement on Wednesday. The Fed is almost certain to leave interest rates unchanged in the 3.75%-4.00% range. Investors will pay close attention to Fed’s guidance on inflation and the economic outlook.
The CME FedWatch tool shows that the Fed will hike interest rates in December after holding them steady this month.
Silver Technical Analysis
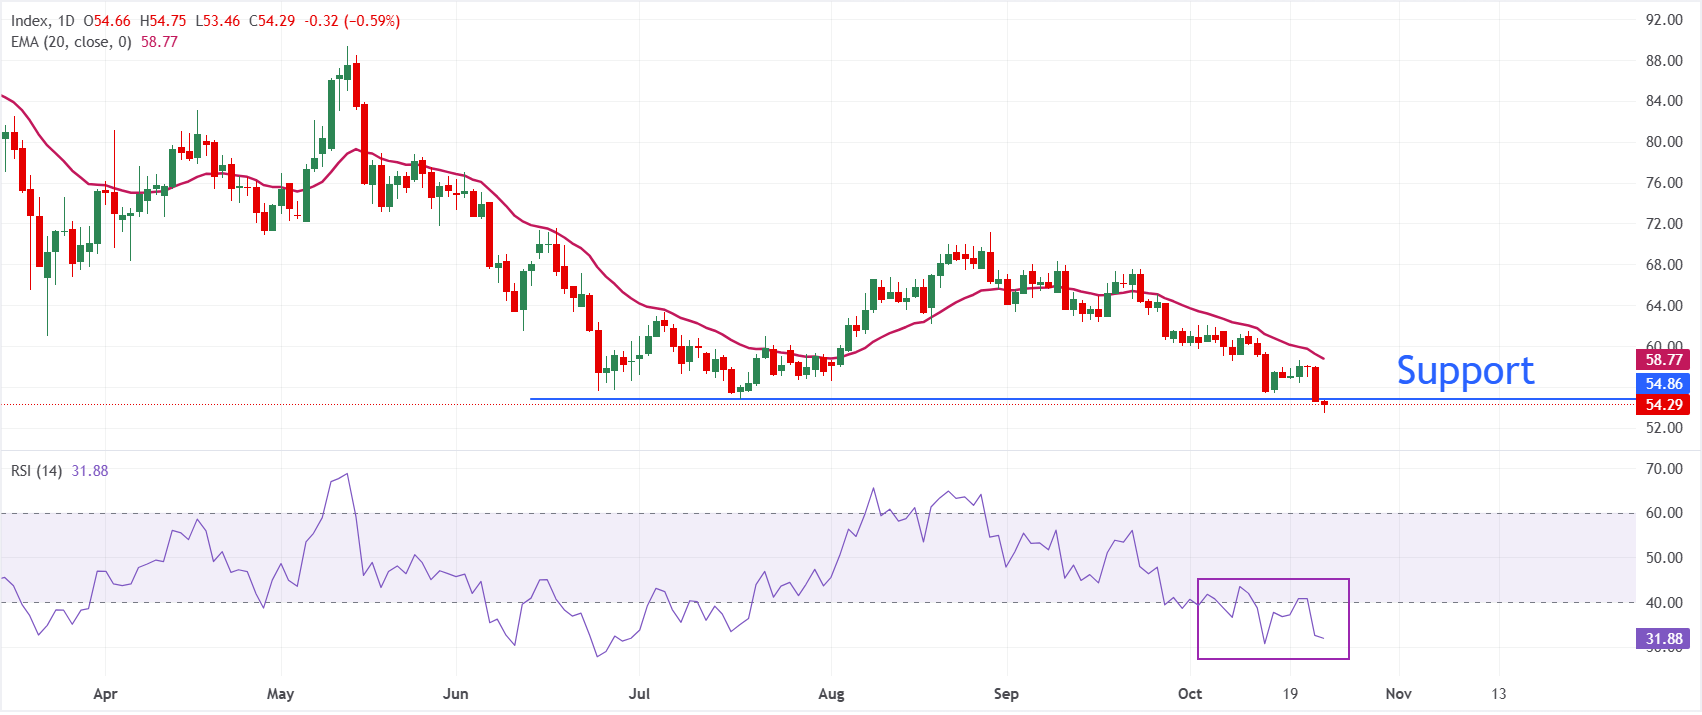
In the daily chart, XAG/USD trades at $54.29, maintaining a bearish near-term bias as price holds well below the 20-day Exponential Moving Average (EMA) at $58.77. The metal remains pressured after its recent slide, while the Relative Strength Index (14) hovers near 32, hinting at lingering downside momentum but approaching oversold territory that could slow further losses.
On the topside, the 20-day EMA at $58.77 is the first meaningful resistance, and a sustained recovery above this barrier would be needed to ease the current bearish tone. With no nearby structural supports derived from the provided dataset, traders will likely watch the RSI’s behavior for signs that selling pressure is exhausting, though the broader configuration still favors sellers while XAG/USD trades under the key EMA cap.