S&P 500 — US Large Cap Index
 FTSE 100 — UK Blue Chips
 Euro Stoxx 50 — Eurozone Leaders
 DAX 40 — German Equities
 CAC 40 — French Market Index
 Nikkei 225 — Japan Benchmark
 Hang Seng — Hong Kong Index
 Shanghai Composite — China Mainland
 ASX 200 — Australian Market
 TSX Composite — Canada Index
 Nifty 50 — India Large Cap
 STI Index — Singapore Market
 KOSPI — South Korea Index
 Bovespa — Brazil Equities
 JSE Top 40 — South Africa Index
 IPC Index — Mexico Market

XAG/USD hits fresh yearly low near $45.60 as US Dollar extends rally


- Silver price tumbles to near $45.60 as the US Dollar extends its gains.
- Fed’s hawkish rhetoric has strengthened the US Dollar.
- Investors keenly await FOMC minutes of the October policy meeting.
Silver price (XAG/USD) slides to a fresh yearly low near $45.60 during the European trading session on Wednesday. The white metal tumbles as the US Dollar (USD) rises further due to fears of prolonged Federal Reserve’s (Fed) monetary tightening cycle.
In the European trade, the US Dollar Index (DXY), which gauges the Greenback’s value against six major currencies, posts a fresh 19-month high at 103.82.
US Dollar Price Today
The table below shows the percentage change of US Dollar (USD) against listed major currencies today. US Dollar was the strongest against the British Pound.
| USD | EUR | GBP | JPY | CAD | AUD | NZD | CHF | |
|---|---|---|---|---|---|---|---|---|
| USD | 0.34% | 0.35% | -0.06% | 0.23% | 0.26% | 0.13% | 0.19% | |
| EUR | -0.34% | -0.00% | -0.42% | -0.12% | -0.09% | -0.22% | -0.15% | |
| GBP | -0.35% | 0.00% | -0.40% | -0.12% | -0.09% | -0.21% | -0.15% | |
| JPY | 0.06% | 0.42% | 0.40% | 0.30% | 0.33% | 0.19% | 0.26% | |
| CAD | -0.23% | 0.12% | 0.12% | -0.30% | 0.03% | -0.10% | -0.04% | |
| AUD | -0.26% | 0.09% | 0.09% | -0.33% | -0.03% | -0.12% | -0.07% | |
| NZD | -0.13% | 0.22% | 0.21% | -0.19% | 0.10% | 0.12% | 0.07% | |
| CHF | -0.19% | 0.15% | 0.15% | -0.26% | 0.04% | 0.07% | -0.07% |
The heat map shows percentage changes of major currencies against each other. The base currency is picked from the left column, while the quote currency is picked from the top row. For example, if you pick the US Dollar from the left column and move along the horizontal line to the Japanese Yen, the percentage change displayed in the box will represent USD (base)/JPY (quote).
Technically, a higher US Dollar makes the Silver price an unfavorable risk-reward bet for investors.
Dollar support seen as Fed stays hawkish
Strategists at OCBC argue that the foreign exchange backdrop remains broadly constructive for the Greenback, with “resilient US growth, sticky inflation and rising Fed rate expectations” expected to “support further modest USD gains.”
According to the CME FedWatch tool, the Fed is almost certain to deliver back-to-back interest rate hikes in the December and January policy meetings. The odds of the Fed raising interest rates again in the March meeting are 47.7%.
Theoretically, higher interest rates by the Fed bode poorly for non-yielding assets, such as Silver.
For fresh cues regarding Fed’s monetary policy outlook, investors await Federal Open Market Committee (FOMC) minutes of the October meeting, which will be published at 19:00 GMT.
Silver Technical Analysis
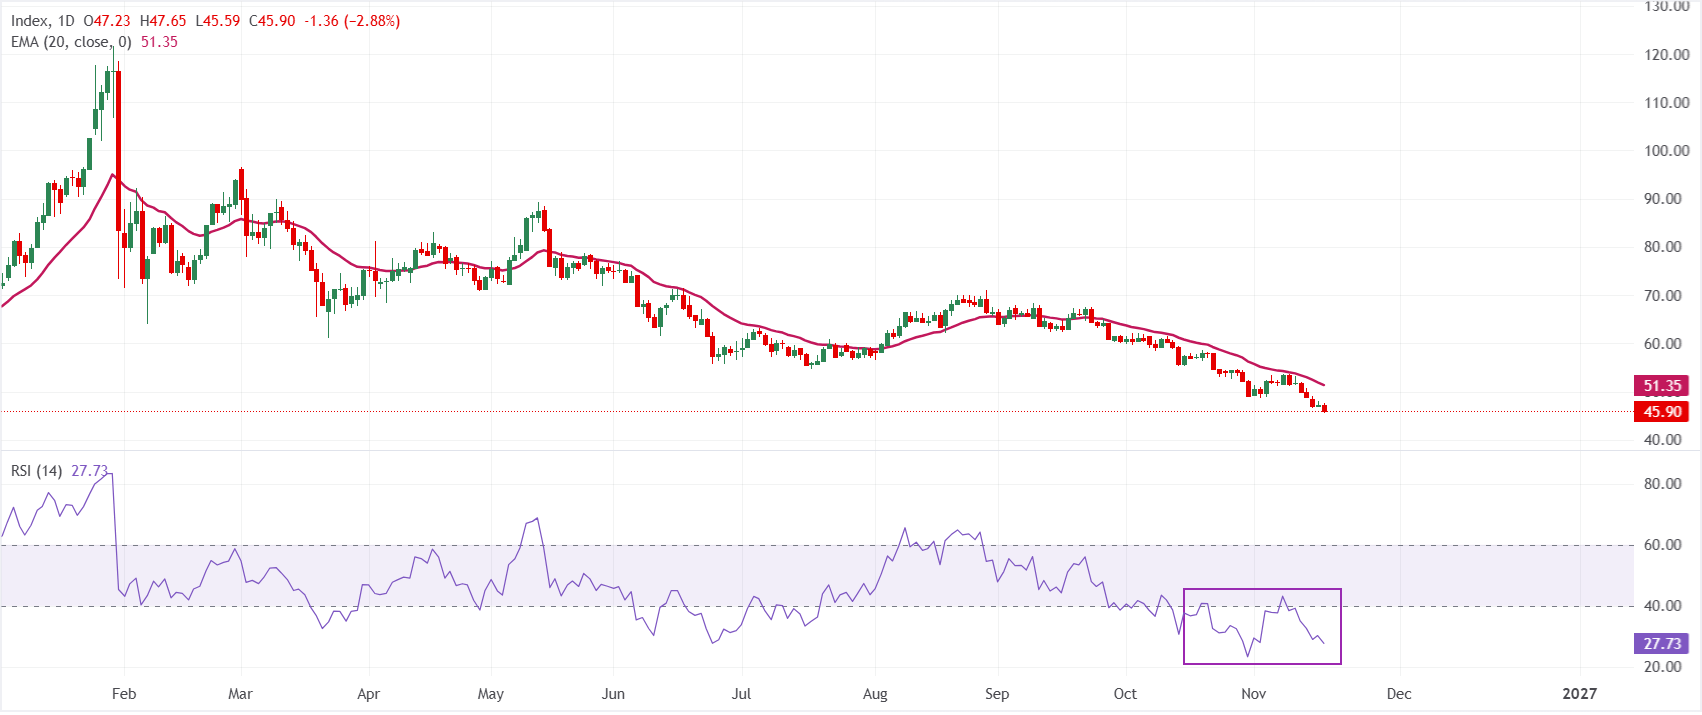
In the daily chart, XAG/USD trades at $45.90, extending a bearish phase as price holds well below the 20-day exponential moving average (EMA) at $51.35. The gap between spot and this short-term EMA suggests sustained downside pressure, while the Relative Strength Index (14) at 27.72 sits in oversold territory, hinting that the latest slide may be stretched but not yet decisively exhausted.
On the topside, initial resistance is located at the 20-day EMA near $51.35, and a daily close above this barrier would be needed to ease the current bearish bias and signal a more durable rebound. On the downside, with no nearby structural levels from the dataset, attention stays on momentum conditions, as the oversold RSI near 28 warns that further declines from $45.90 could become increasingly vulnerable to short-covering bounces even while the broader tone remains heavy.