S&P 500 — US Large Cap Index
 FTSE 100 — UK Blue Chips
 Euro Stoxx 50 — Eurozone Leaders
 DAX 40 — German Equities
 CAC 40 — French Market Index
 Nikkei 225 — Japan Benchmark
 Hang Seng — Hong Kong Index
 Shanghai Composite — China Mainland
 ASX 200 — Australian Market
 TSX Composite — Canada Index
 Nifty 50 — India Large Cap
 STI Index — Singapore Market
 KOSPI — South Korea Index
 Bovespa — Brazil Equities
 JSE Top 40 — South Africa Index
 IPC Index — Mexico Market
- XRP gains momentum with the short-term $1.10 support holding on Friday.
- XRP experiences a resurgence of inflows into US-listed ETFs while futures Open Interest rises only marginally to 2.2 billion XRP.
- XRP flaunts a positive near-term technical picture, buoyed by momentum indicators and key moving average support.
Ripple (XRP) exhibits strong recovery prospects, trading above $1.10 on Friday. This rebound aligns with the broader crypto market and can be attributed to easing geopolitical tensions in the Middle East and growing appetite for risk assets.
Improving sentiment lifts XRP demand
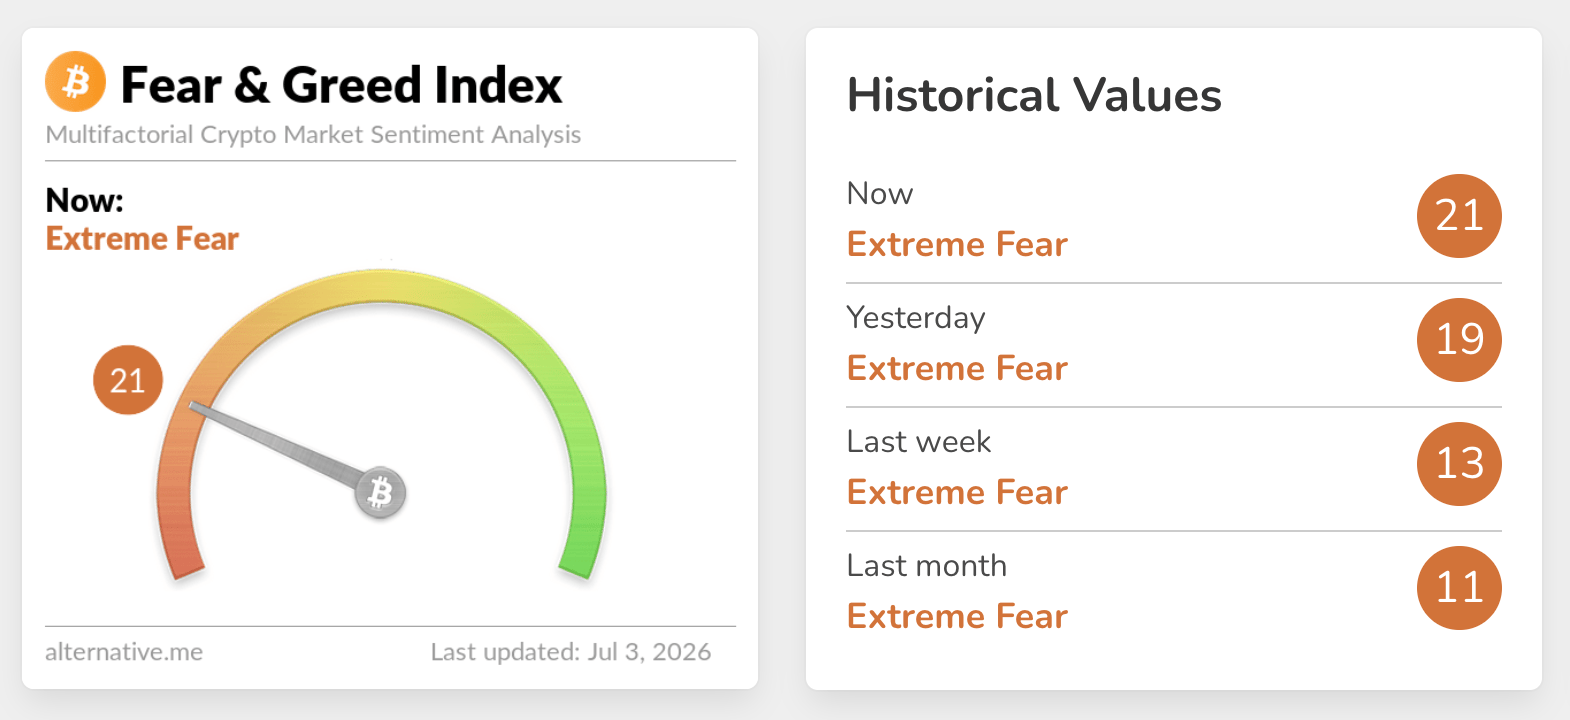
Appetite for XRP digital investment products has strengthened, supported by improvement in sentiment across the cryptocurrency market, as evidenced by the Fear and Greed Index. Current data shows the index embedded in the Extreme Fear territory at 21 on Friday, up only slightly from 19 the day before and significantly higher than June’s average of 11.
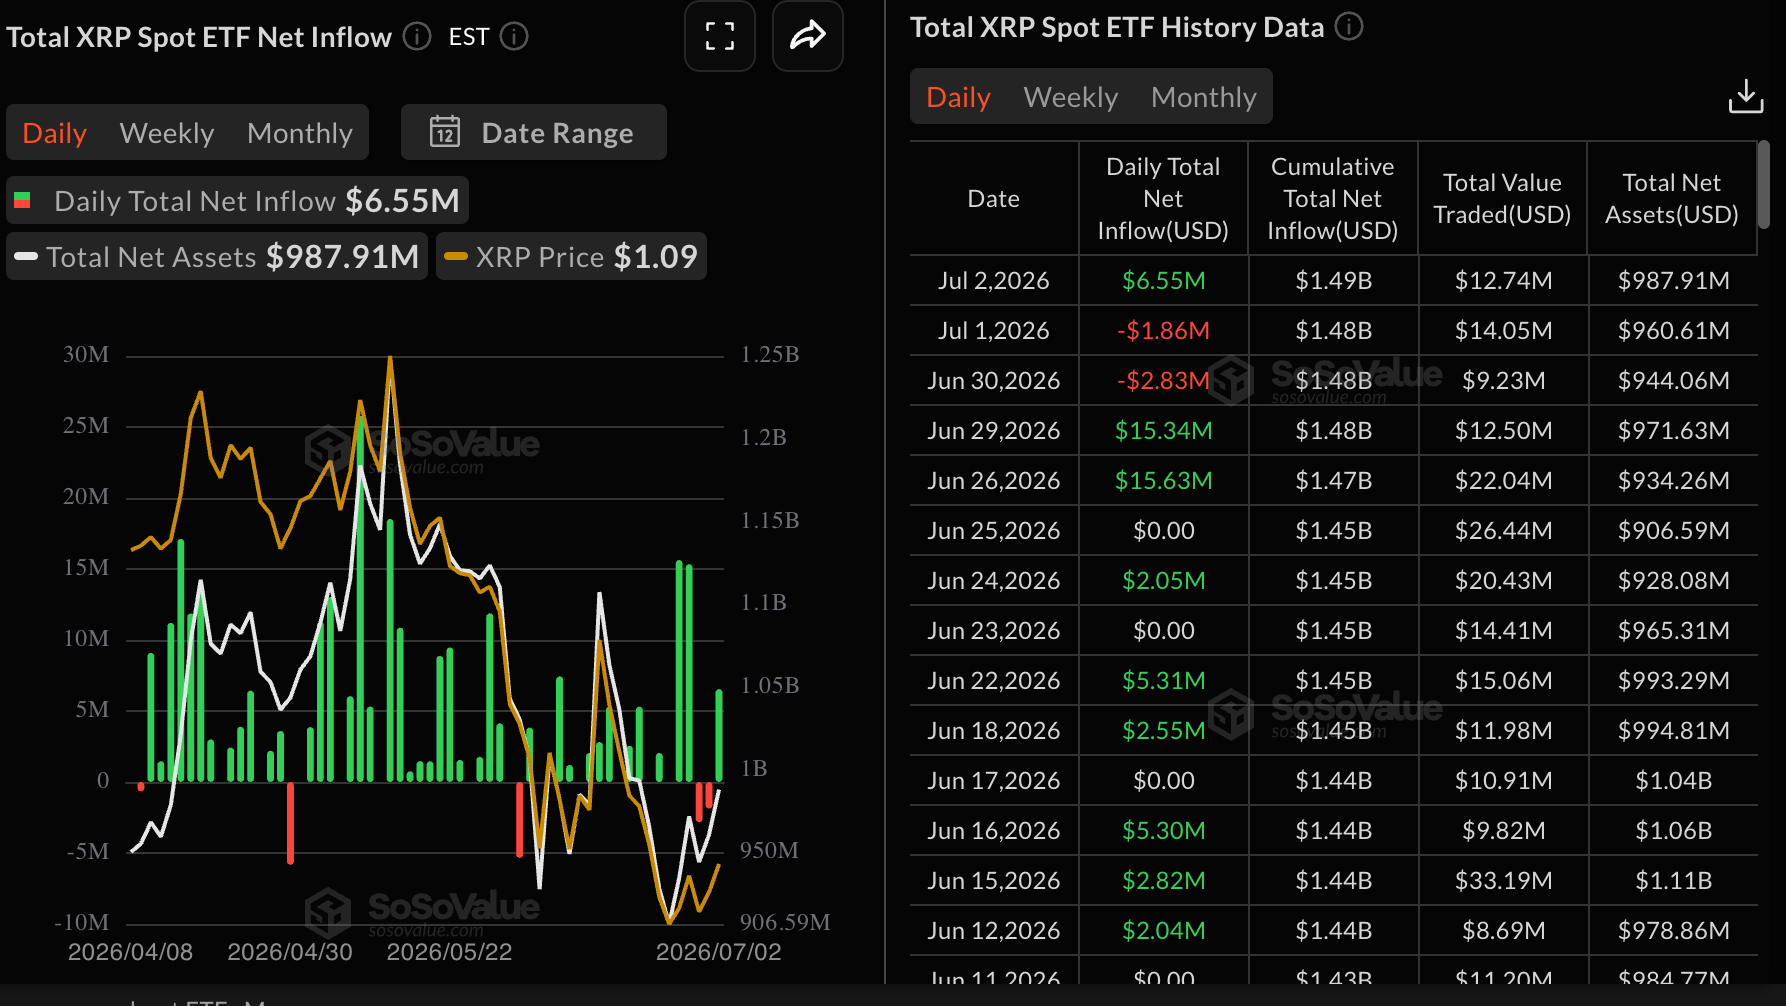
Renewed interest in XRP spot Exchange-Traded Funds (ETFs) reinforces the broader market sentiment. After two consecutive days of outflows, inflows resumed on Thursday at nearly $7 million. Overall, demand for ETFs has remained relatively steady, given cumulative inflows now stand at $1.49 billion, up from $1.43 billion on June 1. Total assets under management average $988 million.
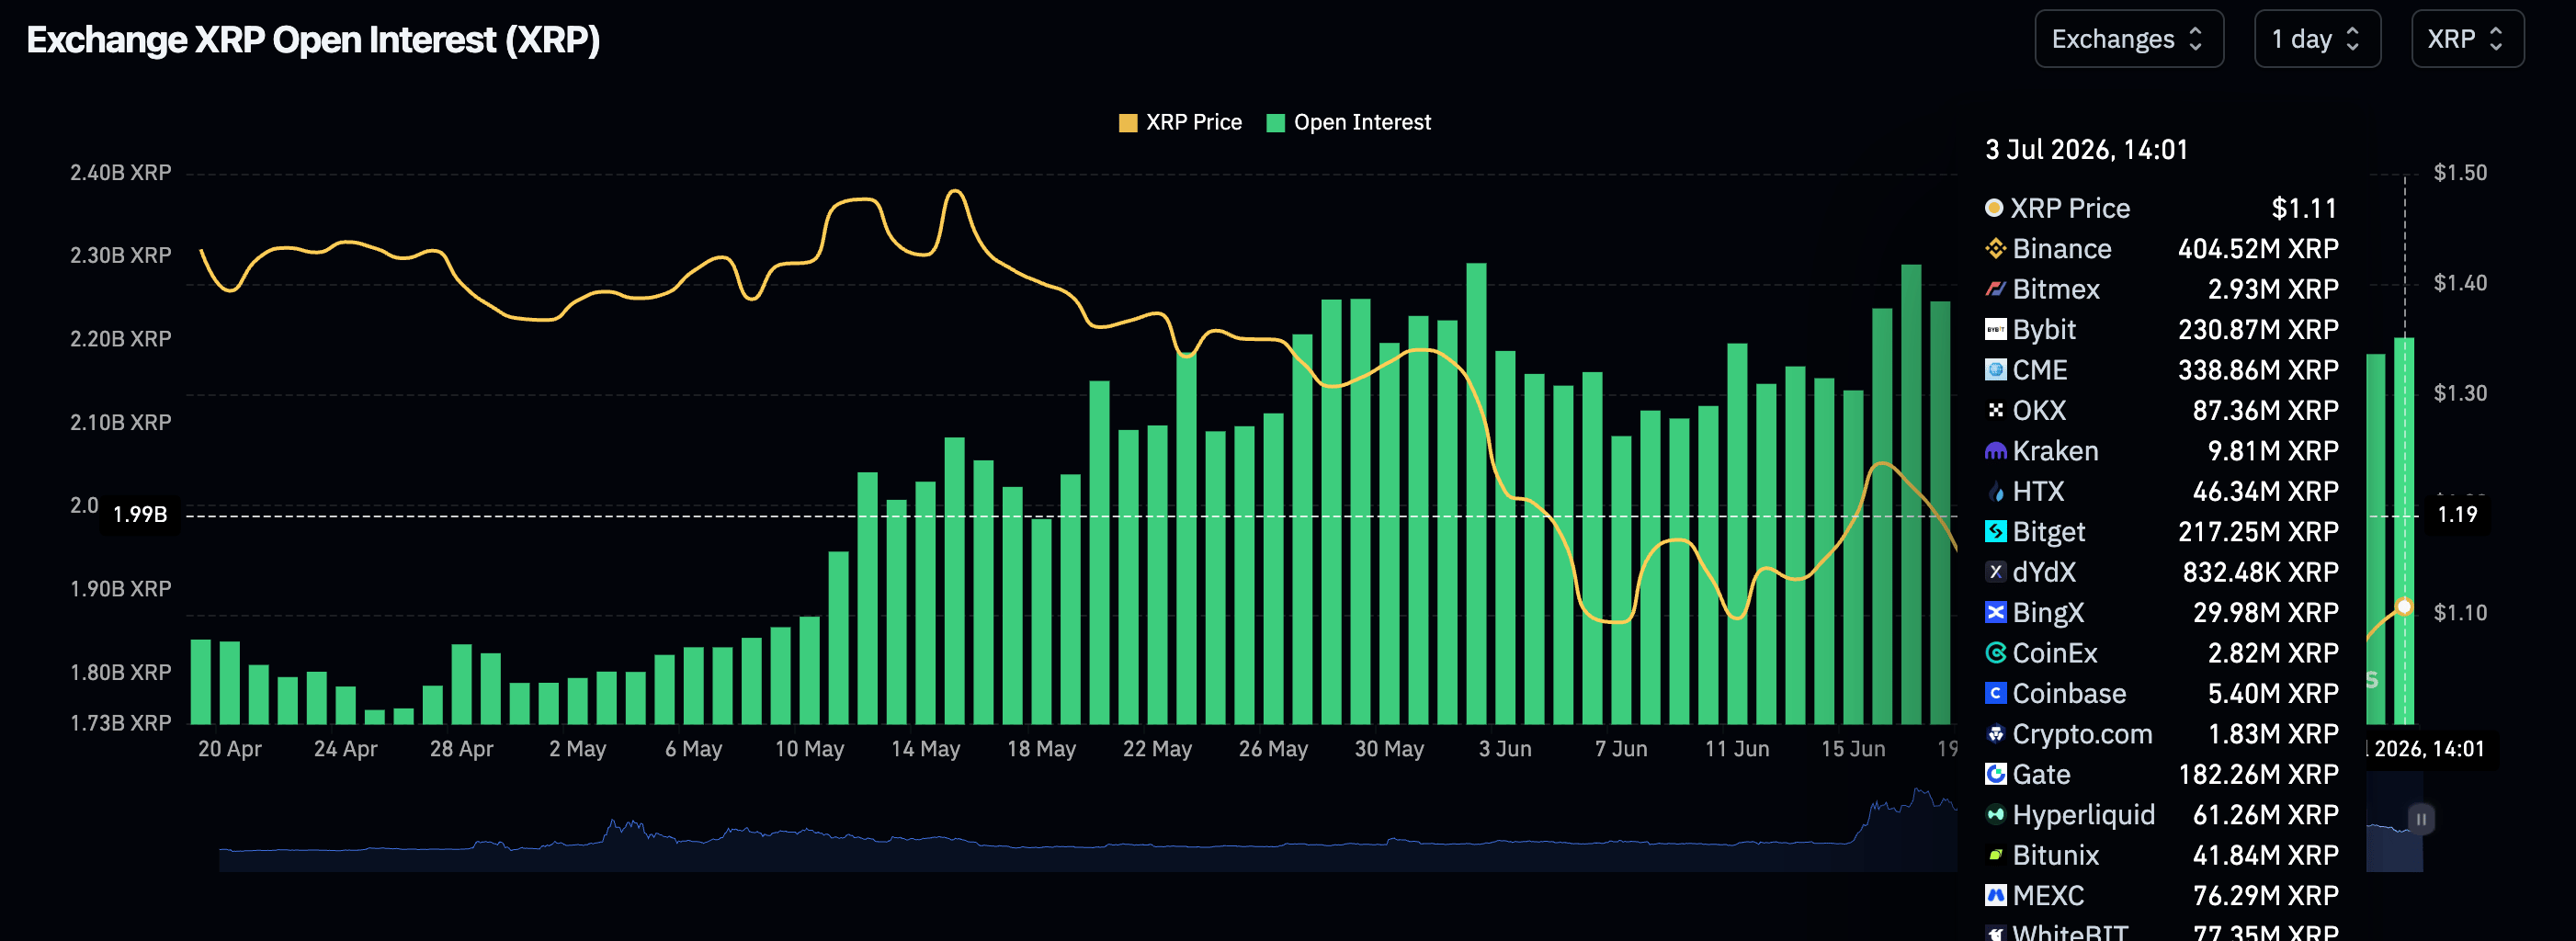
Retail demand also shows marginal improvement, as perpetual futures Open Interest (OI) expands to 2.2 billion XRP on Friday, up from 2.18 billion XRP the previous day.
Despite the mild increase, CoinGlass data shows that the OI holds below the June peak of 2.28 billion XRP. This implies that steady retail demand is critical to stabilizing XRP’s short- to medium-term outlook.
Price analysis: XRP reinforces short-term recovery
XRP extends its recovery above $1.10, reflecting growing interest in the token that swept liquidity at the $1.03 support earlier in the week. The short-term technical outlook upholds a constructive bullish bias as the spot price stands above the 50-day and 100-day Exponential Moving Averages (EMAs) at $1.07 and $1.09, while also remaining well supported by the Bollinger Bands middle layer near $1.06.
The upper Bollinger Band at $1.11 sits just above spot as immediate resistance, hinting at a market pressing against the upper volatility envelope.
Meanwhile, the Moving Average Convergence Divergence (MACD) histogram stays positive and gently expanding on the daily chart, with the MACD line above the signal line, reinforcing steady upside momentum. At the same time, the Relative Strength Index (RSI) hovers in the mid-60s on the same chart, suggesting firm bullish pressure without yet entering overbought territory.
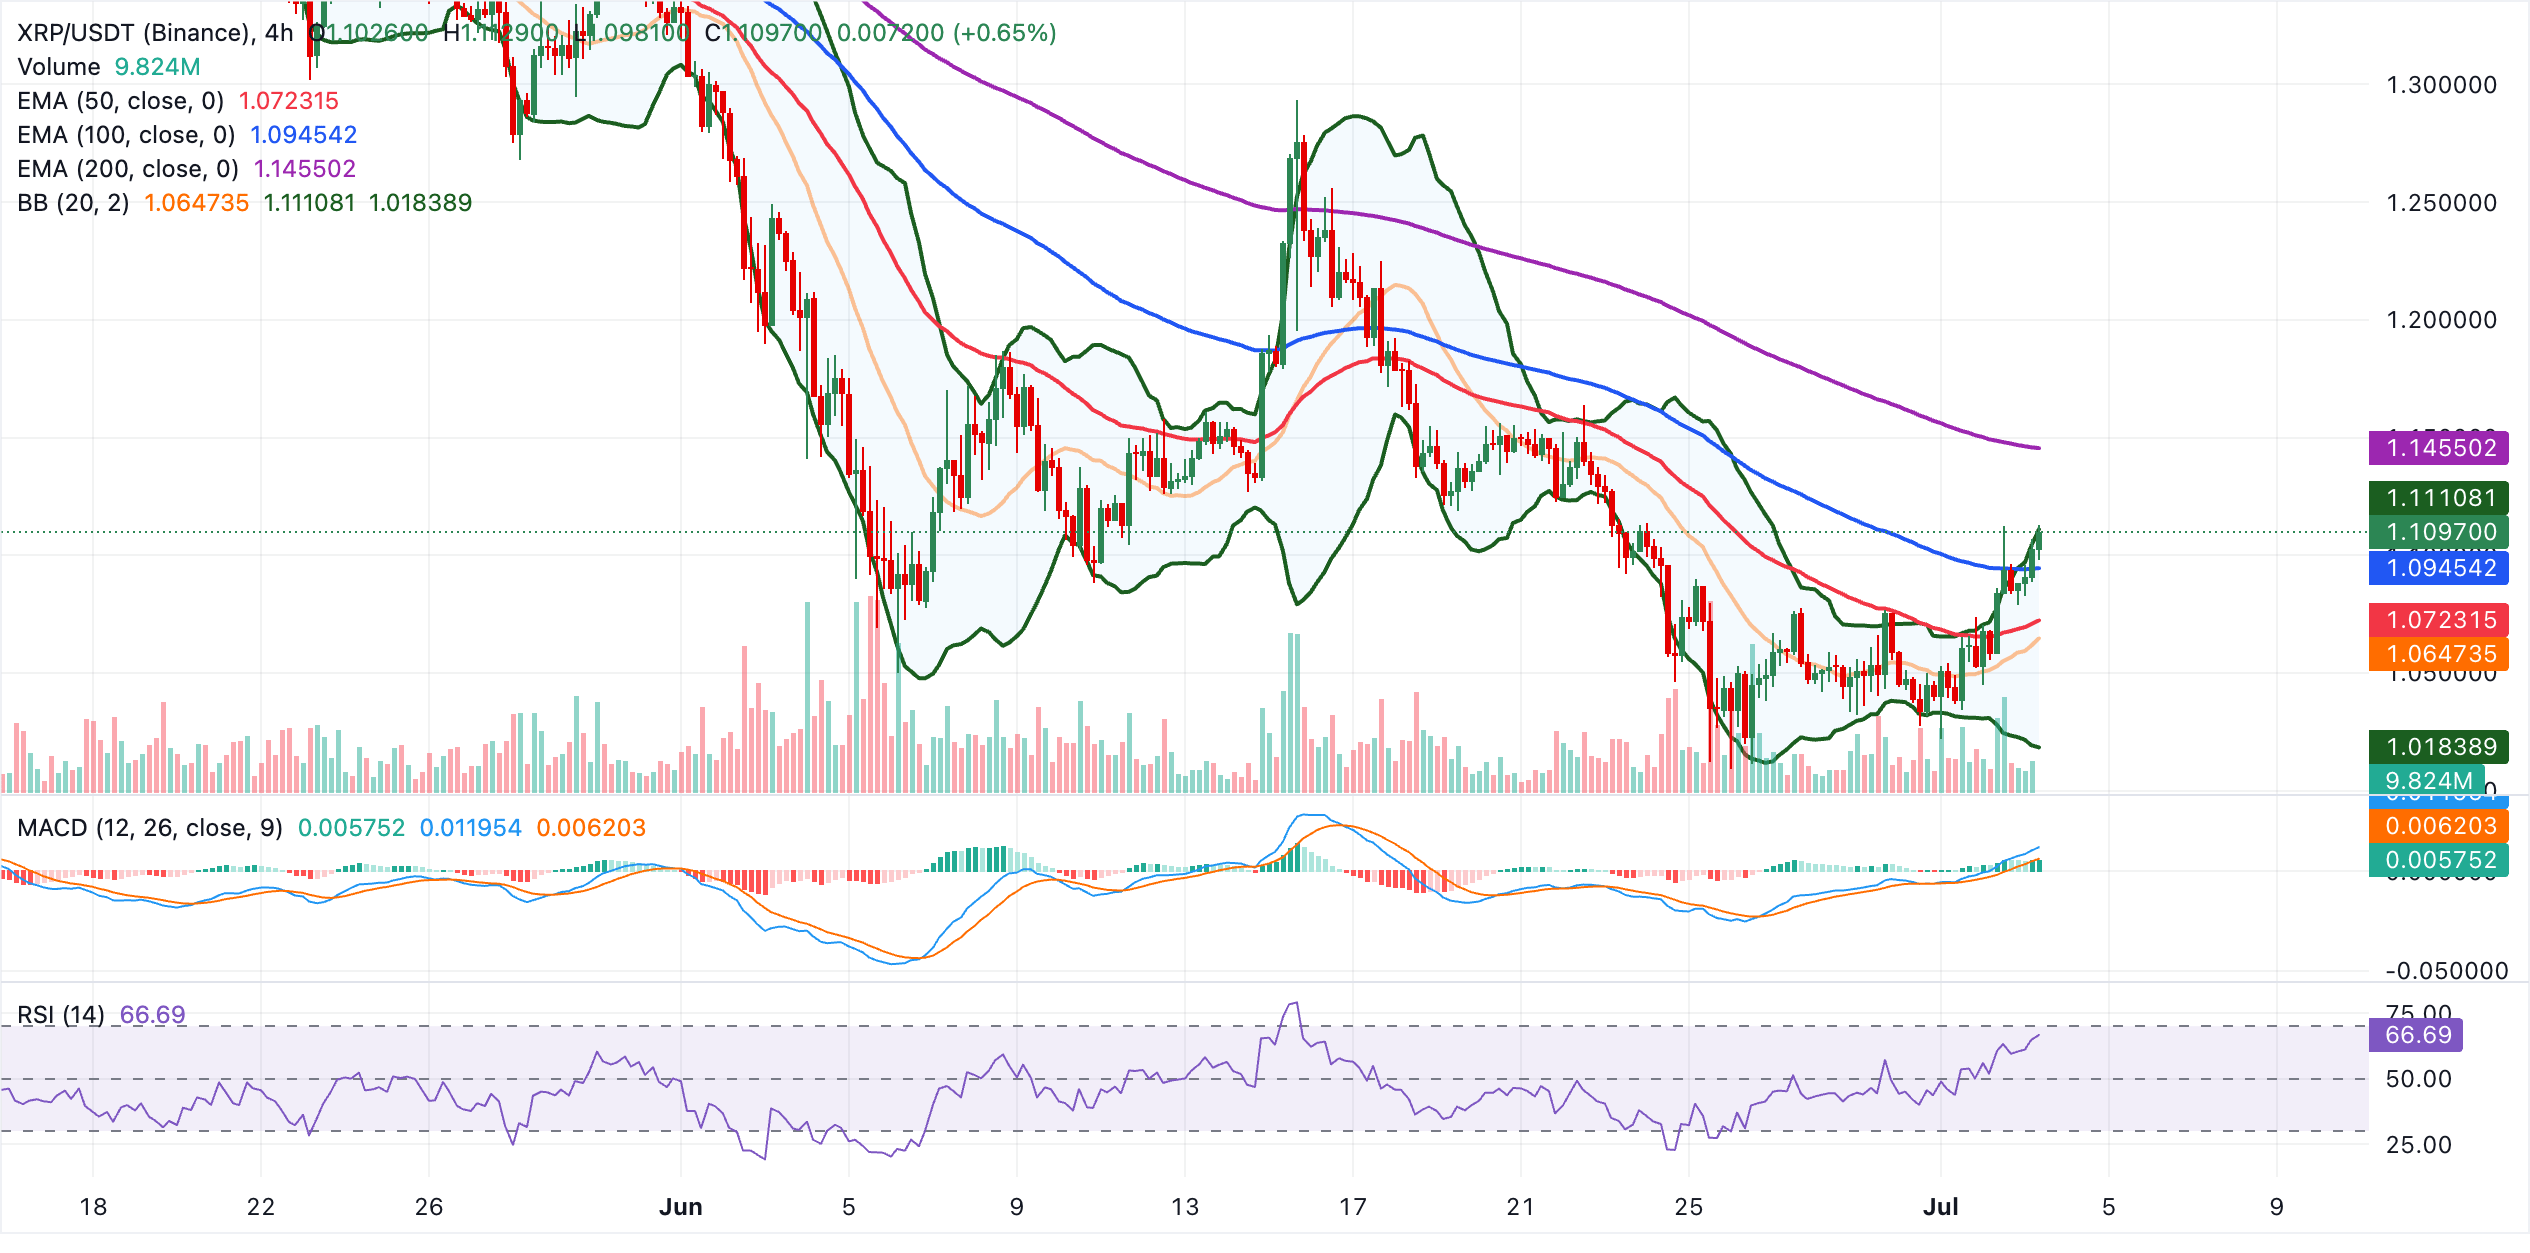
Initial resistance is aligned at the upper Bollinger Band around $1.11. A break of which would expose the more significant 200-day EMA near $1.14 as the next upside barrier. On the flip side, the first area of demand emerges at the 100-day EMA around $1.09, followed by layered support from the 50-day EMA and the Bollinger midline band clustered between roughly $1.07 and $1.06, with the lower Bollinger Band far below at $1.02 acting as a deeper downside cushion if a sharper correction unfolds.