S&P 500 — US Large Cap Index
 FTSE 100 — UK Blue Chips
 Euro Stoxx 50 — Eurozone Leaders
 DAX 40 — German Equities
 CAC 40 — French Market Index
 Nikkei 225 — Japan Benchmark
 Hang Seng — Hong Kong Index
 Shanghai Composite — China Mainland
 ASX 200 — Australian Market
 TSX Composite — Canada Index
 Nifty 50 — India Large Cap
 STI Index — Singapore Market
 KOSPI — South Korea Index
 Bovespa — Brazil Equities
 JSE Top 40 — South Africa Index
 IPC Index — Mexico Market

- AUD/USD declines to near 0.6935 as the US Dollar outperforms its peers.
- Growing French fiscal risks have improved the US Dollar’s safe-haven appeal.
- The odds of the Fed raising interest rates in the October meeting have diminished significantly.
The Australian Dollar (AUD) is down 0.15% to near 0.6935 against the US Dollar (USD) in the Asian trade on Monday. The Aussie pair faces selling pressure as the US Dollar outperforms due to escalate France fiscal woes.
US Dollar Price Today
The table below shows the percentage change of US Dollar (USD) against listed major currencies today. US Dollar was the strongest against the Euro.
| USD | EUR | GBP | JPY | CAD | AUD | NZD | CHF | |
|---|---|---|---|---|---|---|---|---|
| USD | 0.68% | 0.28% | 0.05% | 0.23% | 0.12% | 0.54% | 0.25% | |
| EUR | -0.68% | -0.36% | -0.60% | -0.42% | -0.38% | -0.20% | -0.39% | |
| GBP | -0.28% | 0.36% | -0.23% | -0.05% | -0.02% | 0.14% | -0.02% | |
| JPY | -0.05% | 0.60% | 0.23% | 0.17% | 0.15% | 0.39% | 0.21% | |
| CAD | -0.23% | 0.42% | 0.05% | -0.17% | -0.01% | 0.19% | 0.00% | |
| AUD | -0.12% | 0.38% | 0.02% | -0.15% | 0.00% | 0.17% | -0.02% | |
| NZD | -0.54% | 0.20% | -0.14% | -0.39% | -0.19% | -0.17% | -0.19% | |
| CHF | -0.25% | 0.39% | 0.02% | -0.21% | -0.00% | 0.02% | 0.19% |
The heat map shows percentage changes of major currencies against each other. The base currency is picked from the left column, while the quote currency is picked from the top row. For example, if you pick the US Dollar from the left column and move along the horizontal line to the Japanese Yen, the percentage change displayed in the box will represent USD (base)/JPY (quote).
At press time, the US Dollar Index (DXY), which gauges the Greenback’s value against six major currencies, trades 0.5% higher to near 102.50, the highest level seen in over 17 months.
French fiscal worries as financial markets doubt that the country’s 2027 budget bill presented by Finance Minister (FM) Roland Lescure last week would be cleared at the Parliament.
Brown Brothers Harriman’s (BBH) Elias Haddad highlights mounting fiscal challenges in France, signaling caution that they “doubt the proposal will clear parliament without significant concessions,” underscoring the political hurdles to meaningful consolidation. Haddad argues that “a rollover of the 2026 budget is the most likely outcome given the limited appetite for compromise before the presidential election on April 18, 2027.”
Escalated French fiscal concerns have improved the safe-haven appeal of the US Dollar.
On the monetary policy front, traders have trimmed hawkish Federal Reserve (Fed) bets for the October meeting further after the United States (US) Nonfarm Payrolls (NFP) data for September showed moderate job growth.
AUD/USD Technical Analysis
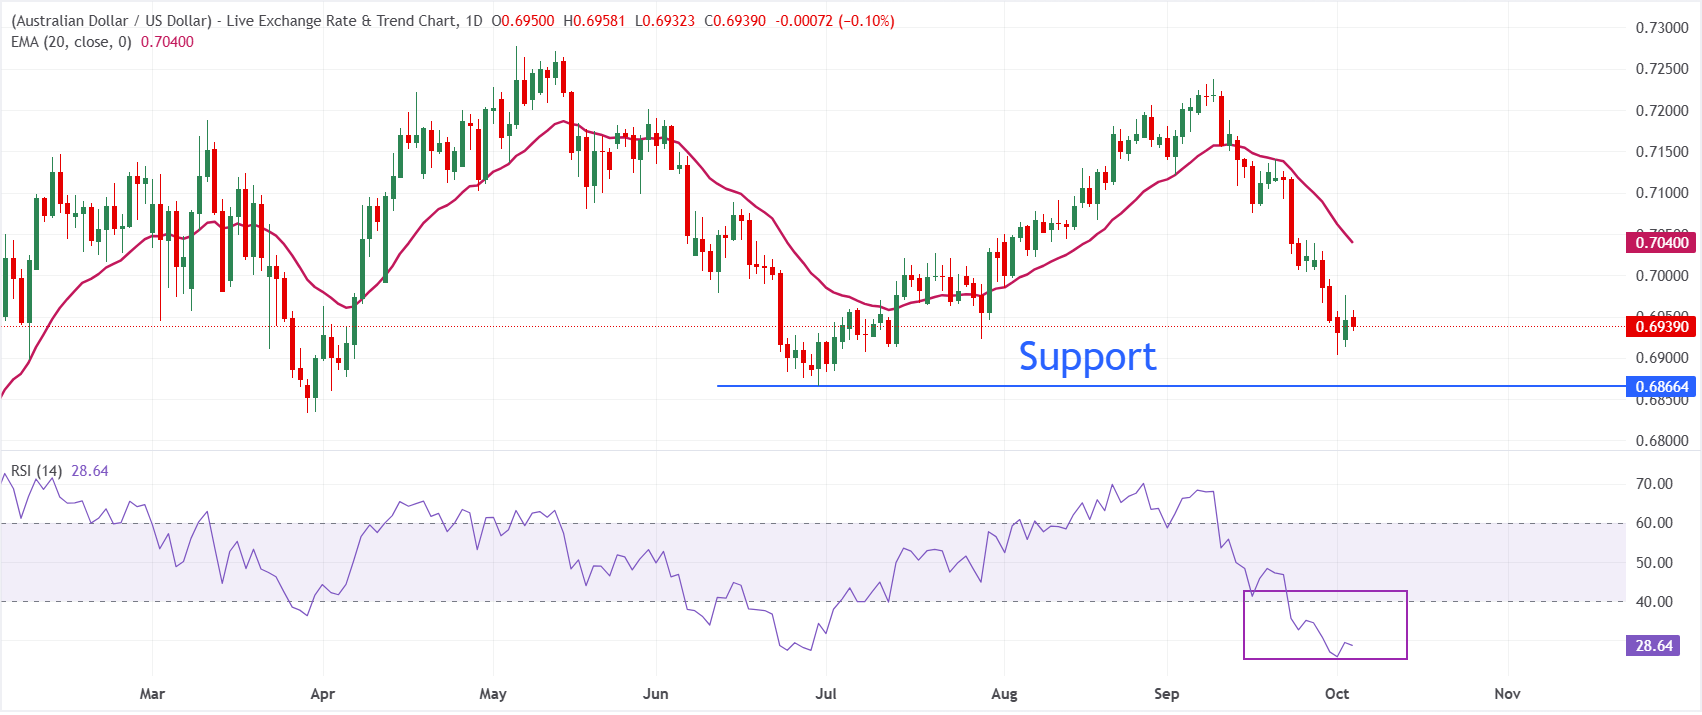
In the daily chart, AUD/USD trades at 0.6939, keeping a bearish near-term tone as spot holds beneath the 20-day Exponential Moving Average (EMA) at 0.7040. The pair remains pressured while it stays under this dynamic barrier, though the Relative Strength Index (14) around 28 suggests oversold conditions that could slow immediate downside momentum rather than signal a clear reversal.
On the topside, initial resistance is located at the 20-day EMA at 0.7040, which caps recovery attempts and defines the level bulls would need to reclaim to ease the present bearish bias. Before the dynamic barrier, the pscyhological level of 0.7000 would act as key hurdle. Looking down, the pair could extend its downside towards 0.6866 if if fails to hold the immedaite support at 0.6900.