S&P 500 — US Large Cap Index
 FTSE 100 — UK Blue Chips
 Euro Stoxx 50 — Eurozone Leaders
 DAX 40 — German Equities
 CAC 40 — French Market Index
 Nikkei 225 — Japan Benchmark
 Hang Seng — Hong Kong Index
 Shanghai Composite — China Mainland
 ASX 200 — Australian Market
 TSX Composite — Canada Index
 Nifty 50 — India Large Cap
 STI Index — Singapore Market
 KOSPI — South Korea Index
 Bovespa — Brazil Equities
 JSE Top 40 — South Africa Index
 IPC Index — Mexico Market
Bitcoin, Ethereum, Ripple – BTC dips, ETH consolidates, XRP stalls


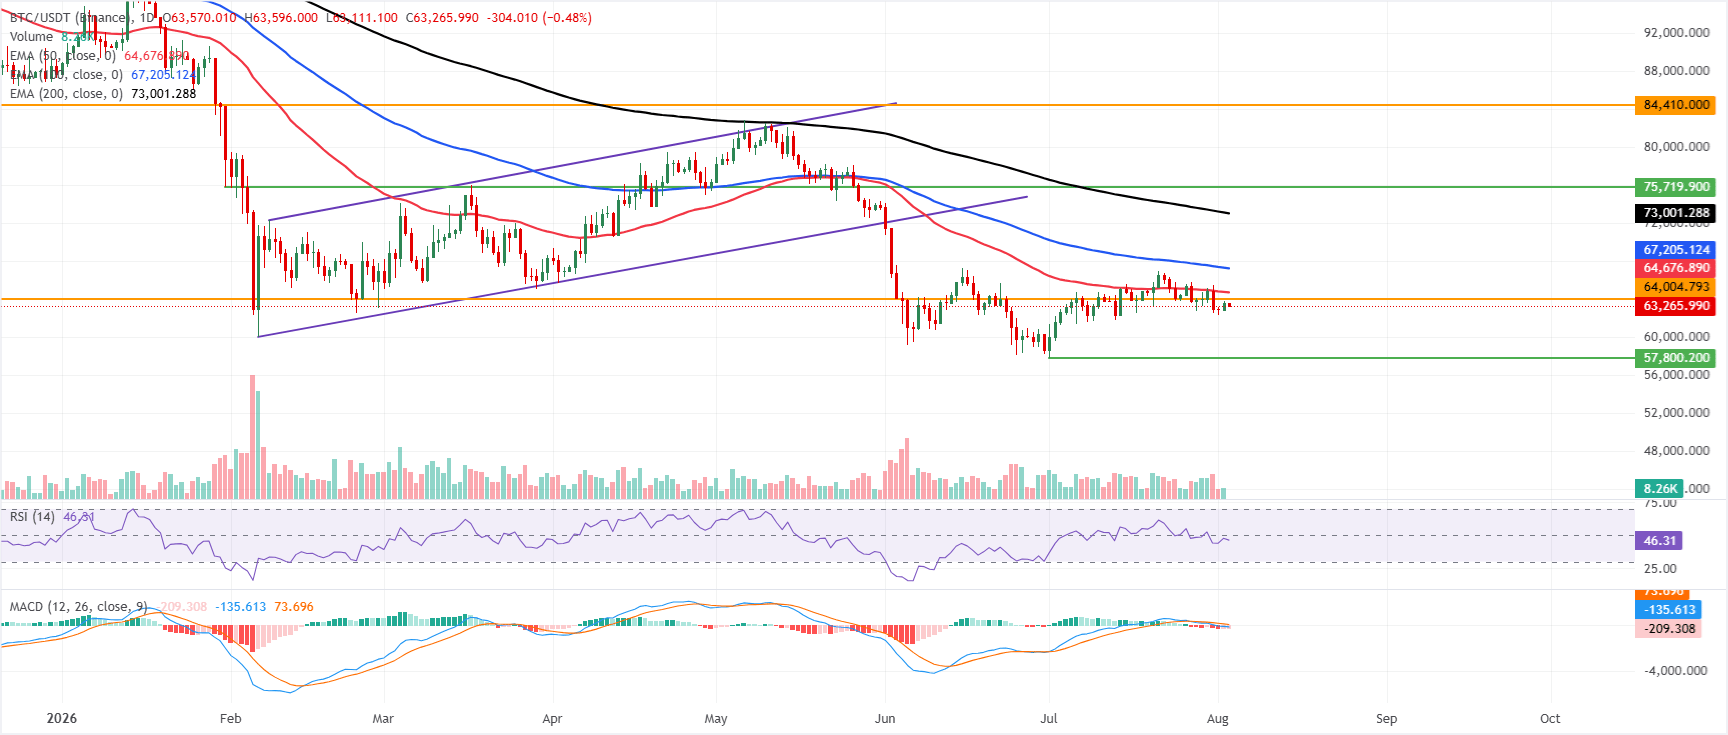
- Bitcoin is trading around $63,200 on Monday after correcting over 2.8% in the previous week.
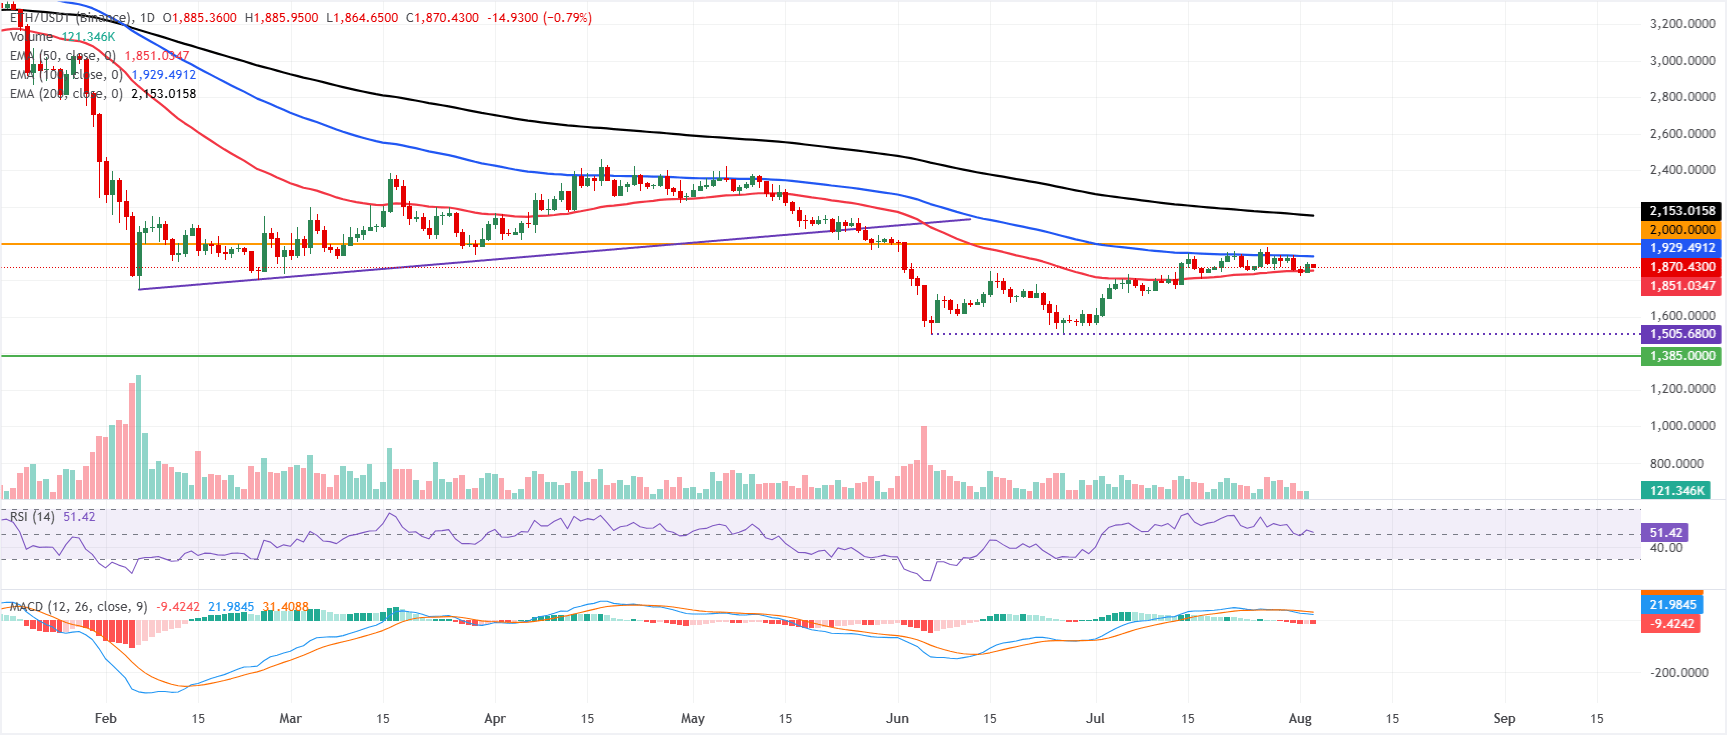
- Ethereum consolidates between the 50-day and 100-day EMAs, signaling indecision among traders.
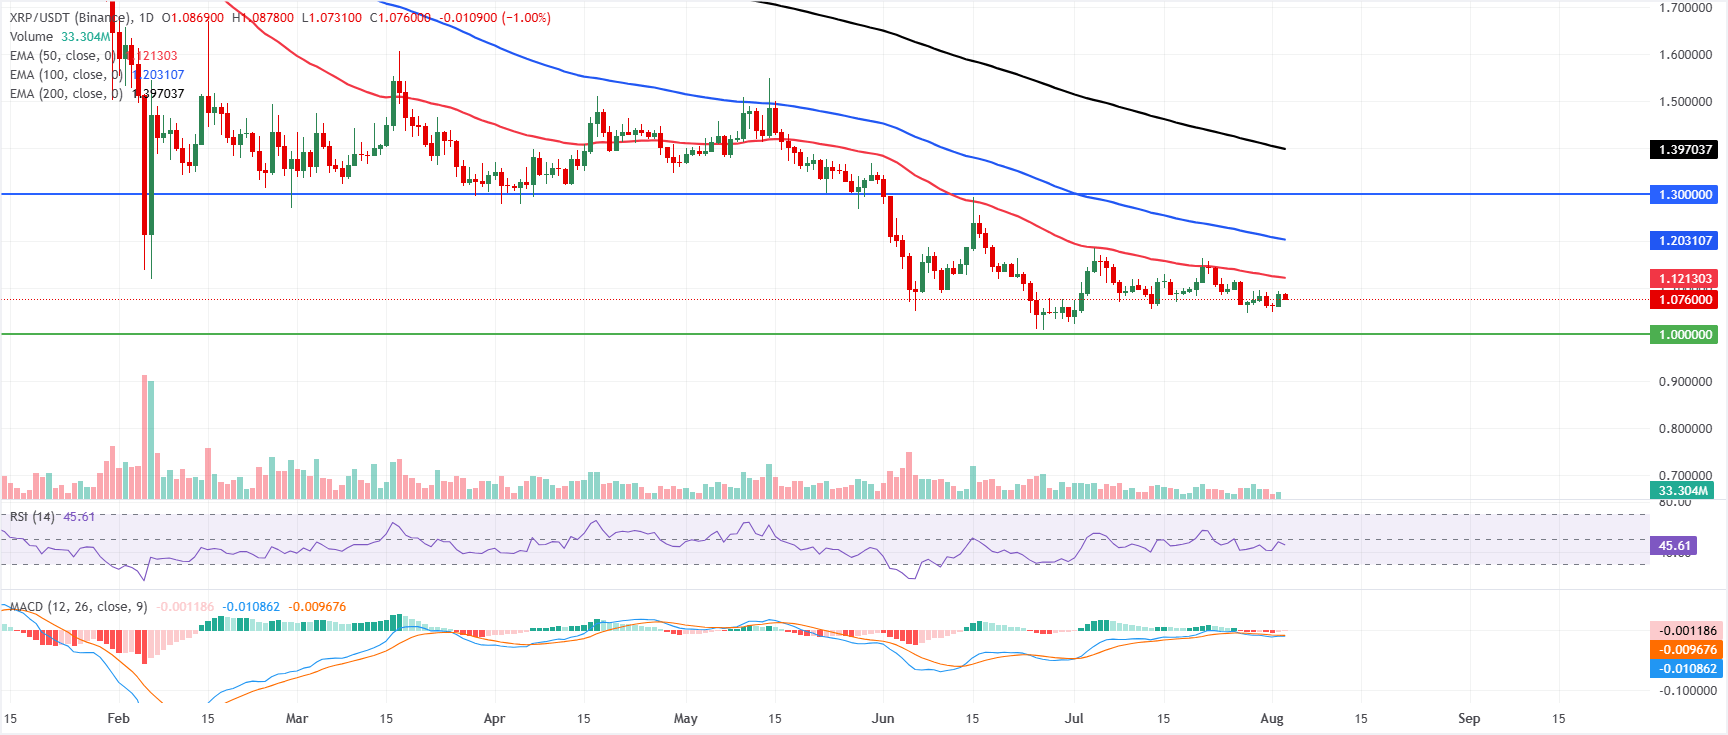
- XRP trades near $1.07 after falling 2.35% last week, with weakening momentum.
Bitcoin (BTC), Ethereum (ETH) and Ripple (XRP) steadied on Monday after falling over 2.8%, 3.55% and 2.35%, respectively, the previous week. BTC trades below the key resistance level, ETH consolidates between the 50-day and 100-day Exponential Moving Averages (EMAs). Meanwhile, XRP steadies above the key support zone, with all three top cryptocurrencies near crucial technical levels; the next breakout or breakdown could determine their near-term direction.
Bitcoin slips below key support zone
Bitcoin price trades at $63,265 on Monday, keeping a bearish near-term tone as price holds below the 50-day, 100-day and 200-day EMAs at $64,676, $67,205 and $73,001 respectively. The dense overhead EMA stack suggests rallies remain corrective. At the same time, the Relative Strength Index (RSI) at 46 leans slightly bearish, and the Moving Average Convergence Divergence (MACD) stays below zero with a negative reading, hinting at persistent downside pressure.
On the topside, initial resistance appears at the nearby horizontal level around $64,004, followed by the 50-day EMA at $64,676, which caps the first meaningful recovery attempts. Higher up, the 100-day EMA at $67,205 and the 200-day EMA at $73,001 define a broader supply zone before the major horizontal barrier near $84,410, leaving immediate downside levels undefined and suggesting any fresh selling would explore new support areas below the current price.
Ethereum consolidates between 50-day and 100-day EMAs
Ethereum price trades at $1,870 on Monday, with the pair capped below the 100-day and 200-day EMAs at $1,929 and $2,153, respectively, which keeps the broader bias mildly bearish despite holding above the 50-day EMA at $1,851.
The RSI sits near a neutral 51, hinting at consolidative momentum, while the MACD remains below zero with a negative reading, suggesting downside pressure is not yet fully exhausted.
On the topside, initial resistance appears at the 100-day EMA around $1,929, ahead of the psychological and structural barrier at $2,000, with the 200-day EMA near $2,153 acting as a deeper hurdle for any sustained recovery.
On the downside, immediate support is provided by the 50-day EMA at $1,851, and a more distant structural floor emerges at the prior horizontal support level near $1,385.00.
XRP’s momentum indicators show weakening signs
XRP price trades at $1.076 on Monday, holding below the 50-day, 100-day, and 200-day EMAs at $1.121, $1.203, and $1.397, respectively, which keeps the broader tone bearish and rallies capped.
The RSI at 45 sits just under the midline. At the same time, the MACD is marginally negative, together hinting at subdued upside momentum and a market that remains vulnerable to further softening while these overhead EMAs are not reclaimed.
On the topside, initial resistance emerges at the 50-day EMA near $1.121, followed by the 100-day EMA at $1.203 and the horizontal barrier at $1.300, before a stronger structural ceiling at the 200-day EMA around $1.397 and the distant resistance line at $1.900.
On the downside, immediate support is aligned with the horizontal level at $1.000, where buyers would be expected to show interest; a daily close below this floor would reinforce the bearish bias and open the door to a deeper corrective phase.