S&P 500 — US Large Cap Index
 FTSE 100 — UK Blue Chips
 Euro Stoxx 50 — Eurozone Leaders
 DAX 40 — German Equities
 CAC 40 — French Market Index
 Nikkei 225 — Japan Benchmark
 Hang Seng — Hong Kong Index
 Shanghai Composite — China Mainland
 ASX 200 — Australian Market
 TSX Composite — Canada Index
 Nifty 50 — India Large Cap
 STI Index — Singapore Market
 KOSPI — South Korea Index
 Bovespa — Brazil Equities
 JSE Top 40 — South Africa Index
 IPC Index — Mexico Market

Brent Crude Oil Forecast: Can Prices Fall to $100 as Bearish Momentum Builds?


Today Markets Analysis
Brent crude oil enters the new week under pressure after falling more than 3% over the past five trading sessions and slipping below $110 per barrel. Short-term technical indicators have deteriorated, with the MACD and momentum signals pointing towards further downside risk.
However, the decline is approaching an important technical support area. The $109.00 level could attract buying interest, potentially slowing the retreat. A recovery above $110.40 would begin to challenge the immediate bearish outlook and could open the way towards the recent highs around $112.30.
Despite the latest weakness, the broader trend remains positive. Brent is still approximately 11% higher over the past month, with geopolitical tensions in the Middle East continuing to support a substantial risk premium in the oil price.
The immediate catalyst for the latest pullback has been reports that the United States and Iran could resume diplomatic efforts aimed at ending the conflict. The prospect of negotiations has reduced some of the geopolitical premium embedded in crude prices. However, without a concrete peace proposal or clear evidence of progress, the market may be reluctant to remove that premium entirely.
The key question for traders this week is whether Brent can stabilise around $109 or whether further selling pressure will develop towards the longer-term support zone near $101.50.
Market Snapshot
| Indicator | Brent Crude Oil |
|---|---|
| Recent Price Area | Below $110 per barrel |
| Five-Session Performance | More than -3% |
| One-Month Performance | Approximately +11% |
| Immediate Support | $109.00 |
| Short-Term Resistance | $110.40 |
| Previous High | $112.30 |
| Major Long-Term Support | $101.50 |
| Key Technical Indicator | 200-day SMA |
| Short-Term Momentum | Bearish |
Brent Crude Falls as US-Iran Diplomatic Prospects Weigh on Prices
The latest decline in Brent crude has followed reports that Washington and Tehran may resume diplomatic efforts to bring the conflict to an end.
The prospect of renewed negotiations has reduced some of the immediate geopolitical risk premium that had supported oil prices. Markets are particularly sensitive to any indication that tensions could ease and that the risk of disruption to regional energy supplies might diminish.
However, diplomatic discussions do not automatically translate into a lasting reduction in supply risk. A concrete proposal, progress towards an agreement and evidence of reduced disruption would be needed before the market could confidently remove a substantial portion of the existing premium.
For now, the diplomatic developments have weakened short-term sentiment, but the broader geopolitical situation remains an important source of uncertainty.
Technical Analysis: Bearish Momentum Builds Below $110
The short-term technical picture has deteriorated as Brent has fallen more than 3% over the past five trading sessions.
The MACD and shorter-term momentum indicators are pointing towards a bearish environment, suggesting that downside pressure has been building.
This creates a near-term challenge for buyers. Although the broader monthly trend remains positive, the latest price action indicates that sellers currently have the short-term advantage.
The next important test is the $109.00 support level. If buyers defend this area, Brent could enter a period of consolidation or attempt a recovery. A sustained break below it would increase the risk of a deeper correction.
Key Brent Crude Oil Levels to Watch
$109.00: Immediate Support
The $109.00 level represents the first important technical support area.
Given the recent decline, this price could attract short-term buying interest from traders looking for a stabilisation in the market. A successful defence would provide an opportunity for Brent to recover towards the $110.40 resistance level.
However, repeated tests of support can weaken its effectiveness. A decisive move below $109 would strengthen the bearish technical outlook.
$110.40: Short-Term Resistance
The $110.40 level represents the first significant resistance area on a potential recovery.
A move above this level would suggest that the recent selling pressure is beginning to ease. It could also encourage short-term buyers to return to the market.
If Brent can establish itself above $110.40, attention would turn towards the recent highs around $112.30.
$112.30: Previous High
The $112.30 area represents the recent high from earlier in the week.
A recovery towards this level would indicate a more substantial reversal of the latest weakness. However, buyers would first need to overcome resistance at $110.40.
$101.50: Major Long-Term Support
If diplomatic progress between the United States and Iran leads to a more sustained reduction in geopolitical risk, the market could begin testing deeper support levels.
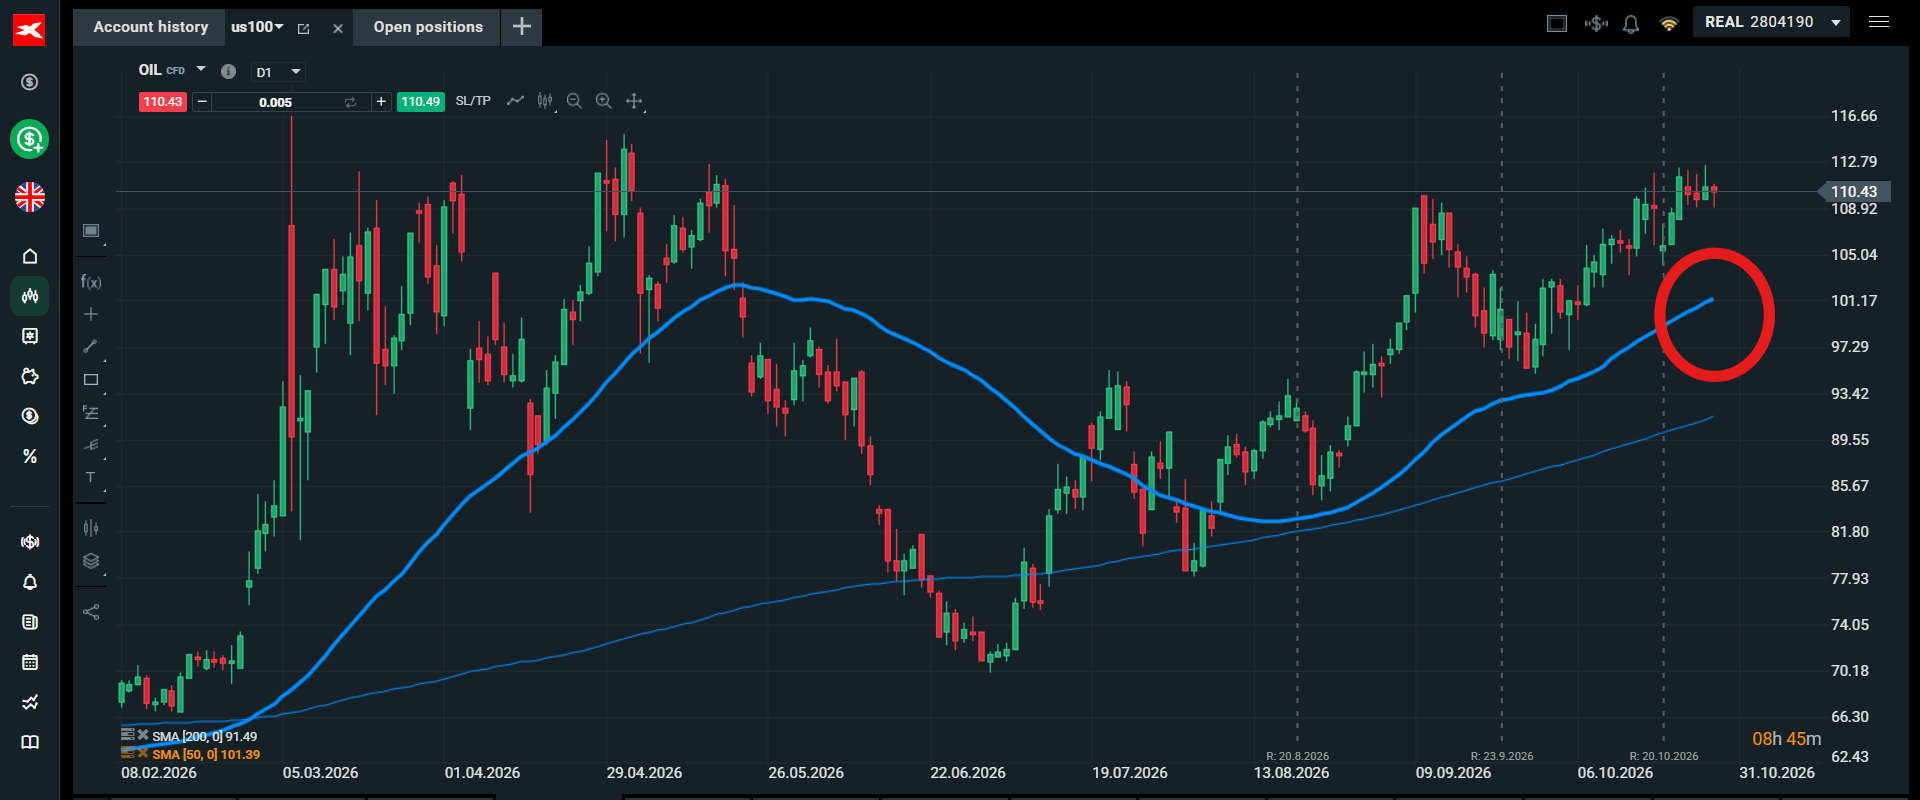
The $101.50 area is particularly important as it represents the 200-day simple moving average.
Chart 1: Brent crude daily chart, with 200-day and 50-day smas.
Past performance is not a reliable indicator of future results.
This longer-term technical indicator could become a major battleground if selling pressure accelerates. A move towards this level would represent a significant correction from recent prices, although it would not necessarily end the broader uptrend.
The Longer-Term Oil Trend Remains Positive
Despite the recent pullback, Brent crude remains approximately 11% higher over the past month.
This demonstrates that the broader market has retained considerable strength, supported by geopolitical uncertainty and the risk of disruption to global energy supplies.
The Northern Hemisphere’s approach to the winter season also adds an important seasonal consideration to the energy outlook.
The key distinction for traders is between the short-term technical correction and the longer-term fundamental picture. Bearish momentum is building in the near term, but the underlying geopolitical risk premium continues to provide support.
For a sustained move towards $100, selling pressure would need to increase significantly and overcome the major support area around $101.50.
Bullish Sentiment
- Support at $109.00: The immediate support area could attract buying interest and slow the recent decline.
- Longer-term uptrend remains intact: Brent is still approximately 11% higher over the past month, indicating that the broader trend remains positive.
- Geopolitical risk premium: Continued uncertainty surrounding the Middle East could keep a substantial premium embedded in oil prices.
- Winter demand considerations: The approaching Northern Hemisphere winter provides an additional factor for energy-market participants to monitor.
- Recovery above $110.40: A sustained move above short-term resistance could open the way towards the $112.30 recent high.
Bearish Sentiment
- Negative short-term momentum: MACD and shorter-term technical indicators point towards further downside risk.
- US-Iran diplomatic developments: Renewed negotiations have reduced some of the immediate geopolitical premium supporting crude prices.
- Recent selling pressure: Brent has fallen more than 3% over five trading sessions and is trading below $110.
- Risk of support failure: A sustained break below $109 could accelerate selling and expose deeper technical support.
- Potential test of the 200-day average: If the geopolitical premium continues to unwind, the $101.50 level could become an important downside target.
Monday Brent Crude Oil Outlook: What Traders Should Watch at the Open
Brent begins the new week with a bearish short-term technical bias, although the $109.00 support level could make further downside more difficult in the immediate term.
Bullish scenario: If Brent holds above $109.00 and buying interest returns, the first recovery target is $110.40. A sustained break above this resistance would improve the short-term outlook and bring the recent $112.30 high back into focus.
Bearish scenario: A decisive break below $109.00 would confirm that selling pressure remains dominant. Continued progress towards US-Iran diplomatic negotiations could further reduce the geopolitical premium, potentially opening the way towards deeper support. The $101.50 200-day moving average would be the major longer-term level to watch.
Monday’s directional bias: Cautiously bearish. Technical momentum favours further downside, but the $109.00 support area could attract buyers and create a period of consolidation. The market needs a clear break of either $109.00 or $110.40 to provide stronger confirmation of its next short-term direction.
Price Forecast: Will Brent Crude Fall Towards $100?
The possibility of Brent moving towards $100 will depend on whether the current technical weakness develops into a broader unwinding of the geopolitical risk premium.
The first hurdle for sellers is $109.00. A break below this level would increase the probability of a deeper correction, with $101.50 representing the next major technical reference point.
However, the 200-day moving average is likely to be an important test. For Brent to move back towards double figures, selling pressure would need to be strong enough to break through this support area.
On the upside, a recovery above $110.40 would weaken the immediate bearish outlook. A move towards $112.30 would then become a more realistic possibility.
The current balance therefore favours further short-term downside, but a move towards $100 is not yet confirmed.
Market Outlook for the Coming Sessions
Brent crude faces a critical technical and fundamental test in the coming sessions.
The short-term indicators point towards continued weakness, while renewed diplomatic activity between the United States and Iran has reduced some of the premium previously supporting oil prices.
Nevertheless, the broader trend remains positive, with Brent still approximately 11% higher over the past month. Geopolitical uncertainty continues to provide an important underlying source of support.
The $109.00 level is the immediate price to watch. A successful defence could produce a recovery towards $110.40 and potentially $112.30. A sustained break lower would shift attention towards the $101.50 200-day moving average.
For now, the risk of further downside remains elevated, but traders should distinguish between a short-term correction and a confirmed reversal of the longer-term trend.
Currency Hedger View
Oil-price volatility has important implications for businesses exposed to energy procurement, transportation, manufacturing and international trade.
A sustained decline in Brent could reduce input-cost pressure for energy-intensive businesses and oil-importing economies. However, a renewed geopolitical escalation could quickly reverse that improvement and increase the cost of energy purchases.
Currency movements add another layer of exposure. Since crude oil is priced internationally in US dollars, businesses operating in euros, pounds or other currencies may experience changes in their effective energy costs even when the dollar oil price is relatively stable.
Currency Hedger encourages businesses with significant energy-related payment obligations to assess both commodity-price and foreign-exchange exposure when planning future purchases and cash flow.
Manage your international currency exposure with Currency Hedger. Visit Currency Hedger or open an account.
Disclaimer: This article is for informational and educational purposes only and does not constitute investment advice, financial advice or a recommendation to buy or sell any financial instrument. Commodity, energy and currency markets involve risk, and past performance is not indicative of future results. Technical levels and market scenarios are analytical reference points, not guaranteed price targets. Readers should conduct their own research and seek independent professional advice before making financial decisions.