S&P 500 — US Large Cap Index
 FTSE 100 — UK Blue Chips
 Euro Stoxx 50 — Eurozone Leaders
 DAX 40 — German Equities
 CAC 40 — French Market Index
 Nikkei 225 — Japan Benchmark
 Hang Seng — Hong Kong Index
 Shanghai Composite — China Mainland
 ASX 200 — Australian Market
 TSX Composite — Canada Index
 Nifty 50 — India Large Cap
 STI Index — Singapore Market
 KOSPI — South Korea Index
 Bovespa — Brazil Equities
 JSE Top 40 — South Africa Index
 IPC Index — Mexico Market
Chart of The Day – EUR/USD Awaits Germany CPI Reacting to Possible ECB Policy Change


g toward EURUSD. If the ECB ultimately decides to raise rates, the euro could benefit in the short term, although the central bank would risk further weakening economic activity in exchange for making additional progress in the fight against inflation. On the other hand, a decision to leave rates unchanged—despite markets being almost fully convinced of a hike—could weigh on the euro and pressure EURUSD, which is currently trading within an interesting technical formation.
Technical Analysis (D1 Timeframe)
On the daily chart, EURUSD remains trapped within a medium-term symmetrical triangle , a consolidation pattern that has been developing since March. The pair is now trading very close to the apex of the formation, suggesting that a breakout and a stronger directional move may be approaching. Price is currently oscillating around the 50-day EMA (1.1695) and the 200-day EMA (1.1670) . The two moving averages are trading very close to each other, confirming the lack of a clear trend and highlighting the market’s transition into a balanced, range-bound environment. EURUSD remains slightly below the 50-day EMA but above the 200-day EMA, maintaining a broadly neutral technical setup. The upper boundary of the triangle is currently located around 1.1680–1.1700 , while key support can be found near 1.1630–1.1650 . The market has respected both boundaries multiple times, with April and May highs repeatedly stalling near resistance and March and May lows establishing a rising support line. From a technical perspective, breakouts from symmetrical triangles often lead to sharp directional moves, particularly when they occur close to the apex of the pattern. MACD and RSI The MACD remains below the zero line, although the histogram is clearly reducing its negative readings. This suggests:
- Fading bearish momentum,
- The potential emergence of a bullish signal if the MACD line crosses above the signal line.
While this is not yet a definitive buy signal, selling pressure appears to be weakening. Meanwhile, the RSI is hovering around 48 , almost exactly at neutral territory. This leaves room for both an upside breakout and a downside move without indicating either overbought or oversold conditions. Key Levels to Watch Support:
- 1.1640–1.1650 (lower boundary of the triangle)
- 1.1600
- 1.1540
Resistance:
- 1.1680–1.1700 (upper boundary of the triangle)
- 1.1760
- 1.1820–1.1850
Bullish Scenario
A break above 1.1700 accompanied by a daily close above the upper boundary of the triangle would represent the first major signal of renewed bullish momentum. In such a scenario, EURUSD could initially target the 1.1760 area before potentially retesting April highs near 1.1820–1.1850 . Bearish Scenario If the pair fails to overcome resistance and instead breaks below support around 1.1640 , the risk of a move toward 1.1600 and subsequently 1.1540 would increase significantly. Such a breakout would also be supported by the MACD remaining below the zero line.
Conclusion
From a technical standpoint, EURUSD is currently at an equilibrium point. The most important feature on the chart remains the narrowing symmetrical triangle, which points to an approaching breakout. As long as the pair remains trapped between 1.1640 and 1.1700 , neither bulls nor bears have a clear advantage. However, the gradual fading of bearish momentum on the MACD slightly increases the probability of an upside breakout attempt in the coming sessions.
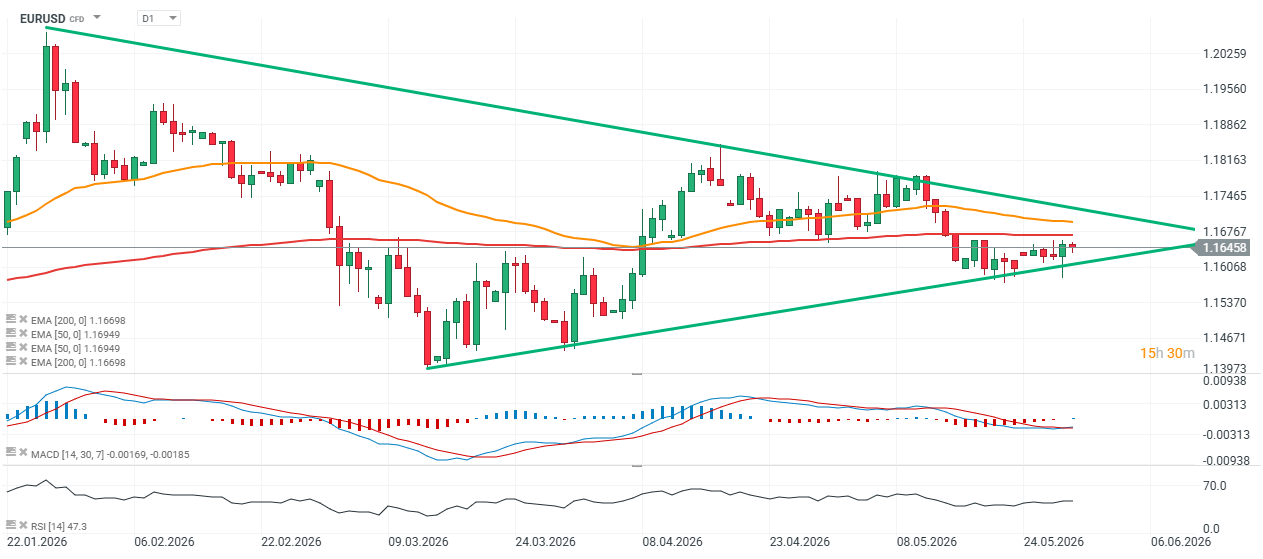
Source: xStation5
The material on this page does not constitute financial advice and does not take into account your level of understanding, investment objectives, financial situation or any other specific needs. All information provided, including opinions, market research, mathematical results and technical analyzes published on the Website or transmitted To you by other means, it is provided for information purposes only and should in no way be construed as an offer or solicitation for a transaction in any financial instrument, nor should the information provided be construed as advice of a legal or financial nature on which any investment decisions you make should be based exclusively To your level of understanding, investment objectives, financial situation, or other specific needs, any decision to act on the information published on the Website or sent to you by other means is entirely at your own risk if you In doubt or unsure about your understanding of a particular product, instrument, service or transaction, you should seek professional or legal advice before trading. Investing in CFDs carries a high level of risk, as they are leveraged products and have small movements Often the market can result in much larger movements in the value of your investment, and this can work against you or in your favor. Please ensure you fully understand the risks involved, taking into account investments objectives and level of experience, before trading and, if necessary, seek independent advice.