S&P 500 — US Large Cap Index
 FTSE 100 — UK Blue Chips
 Euro Stoxx 50 — Eurozone Leaders
 DAX 40 — German Equities
 CAC 40 — French Market Index
 Nikkei 225 — Japan Benchmark
 Hang Seng — Hong Kong Index
 Shanghai Composite — China Mainland
 ASX 200 — Australian Market
 TSX Composite — Canada Index
 Nifty 50 — India Large Cap
 STI Index — Singapore Market
 KOSPI — South Korea Index
 Bovespa — Brazil Equities
 JSE Top 40 — South Africa Index
 IPC Index — Mexico Market

Today’s market attention is primarily focused on Germany, where key labor market and inflation figures could shape expectations ahead of the European Central Bank’s next policy meeting. Markets are currently pricing in a 25-basis-point ECB rate hike with nearly 85% probability , making today’s inflation releases particularly important for policymakers and investors alike. Earlier in the session, traders will assess German labor market data, with the unemployment rate expected to remain unchanged at 6.4% and the number of unemployed projected to increase by 10,000 , compared with 20,000 previously. However, the main event will come in the afternoon with Germany’s preliminary inflation figures, where CPI is expected to ease slightly to 2.8% YoY from 2.9% , while HICP is forecast to remain unchanged at 2.9% YoY . Any upside surprise in inflation could reinforce expectations of further ECB tightening despite signs of slowing economic activity across the euro area. A more hawkish ECB outlook could, at least in theory, create some pressure on Germany’s DAX index futures. Economic Calendar Europe
- 7 AM GMT – Switzerland: KOF Leading Indicator (Forecast: 98.0 , Previous: 97.9 )
- 7 AM GMT – Spain: Preliminary CPI YoY (Previous: 3.2% )
- 7 AM GMT – Spain: Preliminary CPI MoM (Forecast: 0.2% , Previous: 0.4% )
Germany
- 7:55 AM GMT – Germany: Unemployment Rate (Forecast: 6.4% , Previous: 6.4% )
- 7:55 AM GMT – Germany: Change in Unemployment, SA (Forecast: +10K , Previous: +20K )
- 7:55 AM GMT – Germany: Total Unemployed, SA (Previous: 3.006M )
Italy
- 8 AM GMT – Italy: Unemployment Rate (Forecast: 5.3% , Previous: 5.2% )
German Regional Inflation Releases
- 8 AM GMT – Saxony: CPI YoY (Previous: 2.9% )
- 8 AM GMT – Saxony: CPI MoM (Previous: 0.6% )
- 8 AM GMT – North Rhine-Westphalia: CPI YoY (Previous: 2.7% )
- 8 AM GMT – North Rhine-Westphalia: CPI MoM (Previous: 0.4% )
- 8 AM GMT – Bavaria: CPI YoY (Previous: 2.9% )
- 8 AM GMT – Bavaria: CPI MoM (Previous: 0.5% )
Italy Inflation Data
- 9 AM GMT – Italy: Preliminary HICP YoY (Forecast: 3.3% , Previous: 2.8% )
- 9 AM GMT – Italy: Preliminary HICP MoM (Forecast: 0.3% , Previous: 1.6% )
- 9 AM GMT – Italy: Preliminary CPI YoY (Forecast: 3.1% , Previous: 2.7% )
- 9 AM GMT – Italy: Preliminary CPI MoM (Forecast: 0.1% , Previous: 1.1% )
Italy GDP
- 10 AM GMT – Italy: Final GDP QoQ (Forecast: 0.2% , Previous: 0.2% )
- 10 AM GMT – Italy: Final GDP YoY (Forecast: 0.7% , Previous: 0.7% )
Germany Inflation Data
- 12 PM GMT – Germany: Preliminary CPI YoY (Forecast: 2.8% , Previous: 2.9% )
- 12 PM GMT – Germany: Preliminary HICP YoY (Forecast: 2.9% , Previous: 2.9% )
- 12 PM GMT – Germany: Preliminary HICP MoM (Forecast: 0.0% , Previous: 0.5% )
- 12 PM GMT – Germany: Preliminary CPI MoM (Forecast: 0.1% , Previous: 0.6% )
North America
- 12:30 PM GMT – Canada: Annualized GDP QoQ (Forecast: 1.5% , Previous: -0.6% )
- 12:30 PM GMT – Canada: GDP MoM (Forecast: 0.0% , Previous: 0.2% )
- 12:30 PM GMT – Canada: GDP QoQ (Previous: -0.2% )
- 12:30 PM GMT – United States: Advance Wholesale Inventories MoM (Forecast: 0.8% , Previous: 1.3% )
- 12:30 PM GMT – United States: Advance Retail Inventories ex Autos (Previous: 0.4% )
- 12:30 PM GMT – United States: Advance Goods Trade Balance (Forecast: -$87.0B , Previous: -$87.45B )
- 12:30 PM GMT – United States: Chicago PMI (Forecast: 50.3 , Previous: 49.2 )
Central Bank Speakers
- 8:20 AM GMT – United Kingdom: BoE Governor Andrew Bailey
- 8:30 AM GMT – Eurozone: ECB Executive Board Member Fabio Panetta
- 10:50 AM GMT – United States: Fed Governor Adriana Kugler
- 11:15 PM GMT – Eurozone: ECB Governing Council Member Olli Rehn
- 1:10 PM GMT – United States: Fed Governor Michael Barr Bowman
- 1:15 PM GMT – United States: Philadelphia Fed President Patrick Harker
- 1:35 PM GMT – Eurozone: ECB Governing Council Member Madis Müller
- 4:40 PM GMT – United States: New York Fed President John Williams
DE40 Technical Analysis (D1) The German DE40 index remains in a strong uptrend , having recovered almost all losses from the March-April correction and once again testing record highs. The index is currently trading near 25,200 points , just below a key resistance zone defined by recent peaks. Trend and Moving Averages
- Price remains above both the 50-day EMA (24,620) and the 200-day EMA (24,215) .
- The 50-day EMA remains comfortably above the 200-day EMA, maintaining a classic bullish structure.
- Recent weeks have produced a series of higher highs and higher lows, confirming continued buyer dominance.
From a technical perspective, the long-term trend remains firmly bullish. Key Resistance Zone The most important resistance area currently lies between: 25,200 – 25,350 points This zone corresponds to both this year’s highs and all-time highs, which have already been tested multiple times during May. A decisive breakout above this area could trigger another leg higher, as there is virtually no historical resistance overhead. MACD The MACD remains above the zero line, while the histogram has started to expand higher again. This suggests:
- Improving bullish momentum
- Continued buyer control
- Potential for a move toward fresh record highs
At present, the indicator does not signal an imminent larger correction. RSI The RSI is currently trading near 60 . This level:
- Remains well below overbought territory
- Continues to support a bullish outlook
- Leaves room for additional upside without requiring a deeper pullback
Key Technical Levels Resistance
- 25,250 – 25,350 (all-time highs)
- 25,500 (psychological target after a breakout)
- 26,000 (extended bullish target)
Support
- 24,900 – 25,000
- 24,600 (50-day EMA)
- 24,200 (200-day EMA)
- 23,700 (April lows)
Scenarios If the index remains above 25,000 and breaks through resistance around 25,300 , the market could enter a new price-discovery phase. Under this scenario, the next upside targets would be located in the 25,500–26,000 region. Failure to break above record highs could trigger profit-taking. The first downside target would be the 24,900–25,000 support zone, while a deeper correction could push the index back toward the 50-day EMA near 24,600 . A sustained move below this level would represent the first meaningful sign of weakening bullish momentum. DE40 remains one of the strongest major equity indices from a technical perspective. Price action continues to hold above key moving averages, MACD supports the bullish trend, and RSI remains comfortably below overbought territory. As long as the index stays above 24,600 , the base-case scenario remains further upside and another attempt to establish new all-time highs.
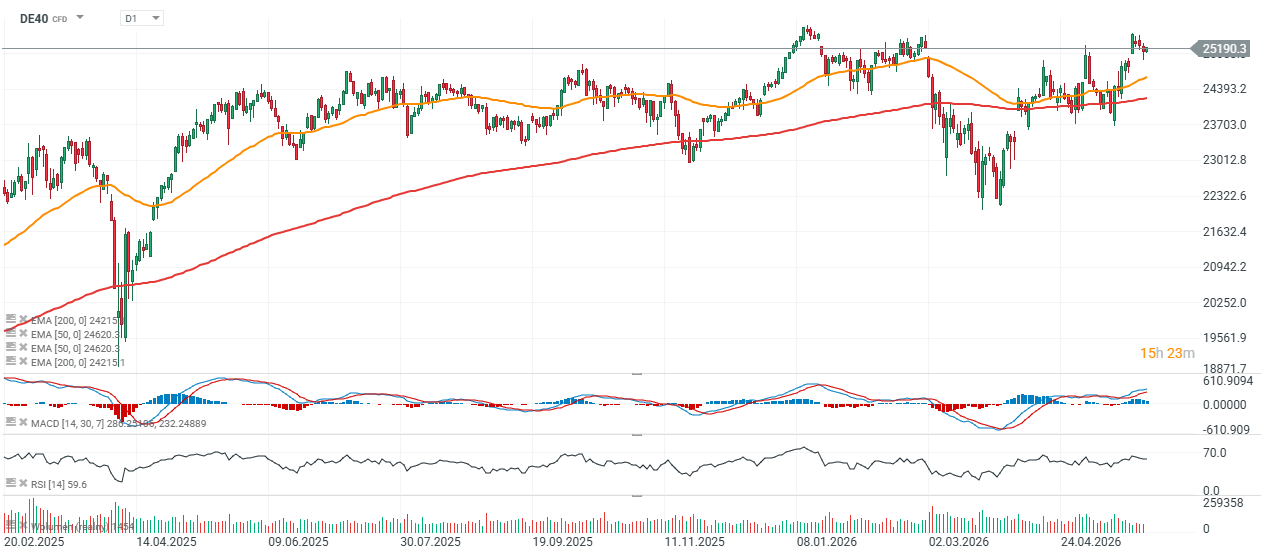
Source: xStation5