Bitcoin, Ethereum, Ripple: BTC struggles for a breakout while ETH and XRP extend losses
- Bitcoin price faces multiple rejections around its 200-day EMA at $85,000; breakout indicates a bullish trend.
- Ethereum’s price extends its losses as it faces resistance at around its $1,700 psychological level.
- XRP price faces a pullback as it fails to close above the $2.23 level.
Bitcoin (BTC) price is stabilizing around $83,500 on Wednesday after it faced multiple rejections around its 200-day EMA at $85,000; a breakout indicates a bullish trend. Ethereum (ETH) and Ripple (XRP) extended their losses after facing resistance around their key levels.
Bitcoin struggles to break out above the $85,000 resistance zone
Bitcoin has faced multiple rejections around its 200-day Exponential Moving Average (EMA) at $85,000 since Sunday. On Tuesday, BTC tried breaking above this level but was rejected again and declined by 1.12%. At the time of writing on Wednesday, it hovers around $83,500.
If BTC closes above $85,000 on a daily basis, it could extend the rally to the key psychological level of $90,000. A successful close above this level could extend an additional rally to test its March 2 high of $95,000.
The Relative Strength Index (RSI) on the daily chart flattens around its neutral level of 50, indicating indecisiveness among traders. The RSI must move above its neutral level for the bullish momentum to be sustained.
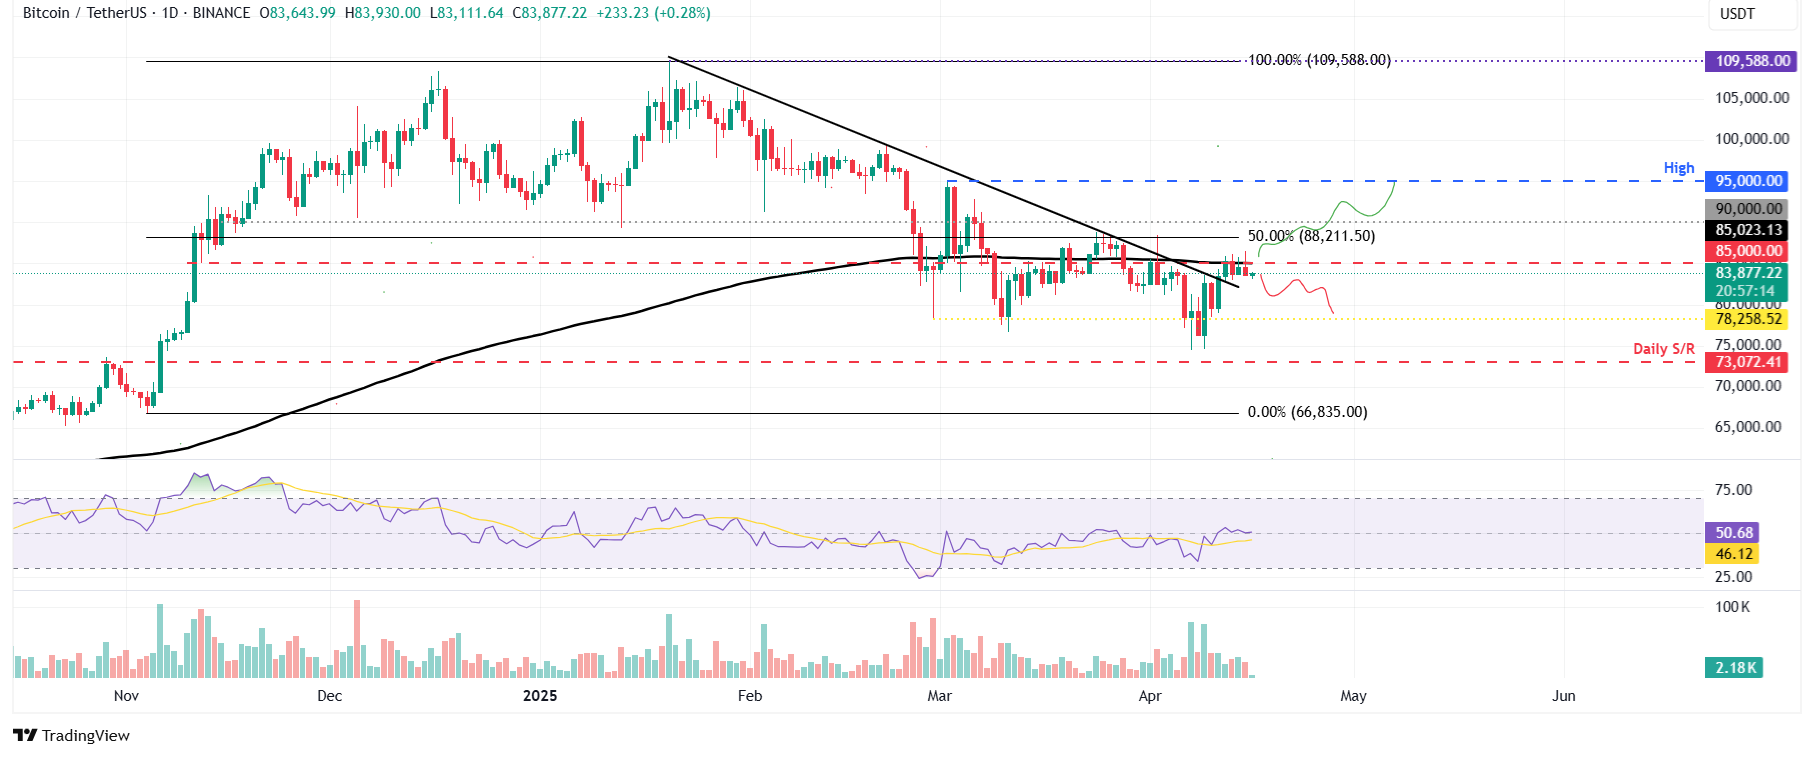
BTC/USDT daily chart
However, if BTC continues its downward trend, it could extend the decline to retest its next daily support level at $78,258.
Ethereum shows signs of weakness as it faces rejection around $1,700
Ethereum price found support around its daily level of $1,449 last week and recovered slightly, but it faced resistance of around $1,700. On Monday, ETH was again rejected around this level and declined by 2.15% the next day. At the time of writing on Wednesday, it hovers around $1,590.
If ETH continues its correction, it could extend the losses to retest its daily support level at $1,449. A successful close below this level could extend an additional decline to retest its important psychological level of $1,300.
The RSI on the daily chart hovers at 40 below its neutral level of 50, indicating bearish momentum.
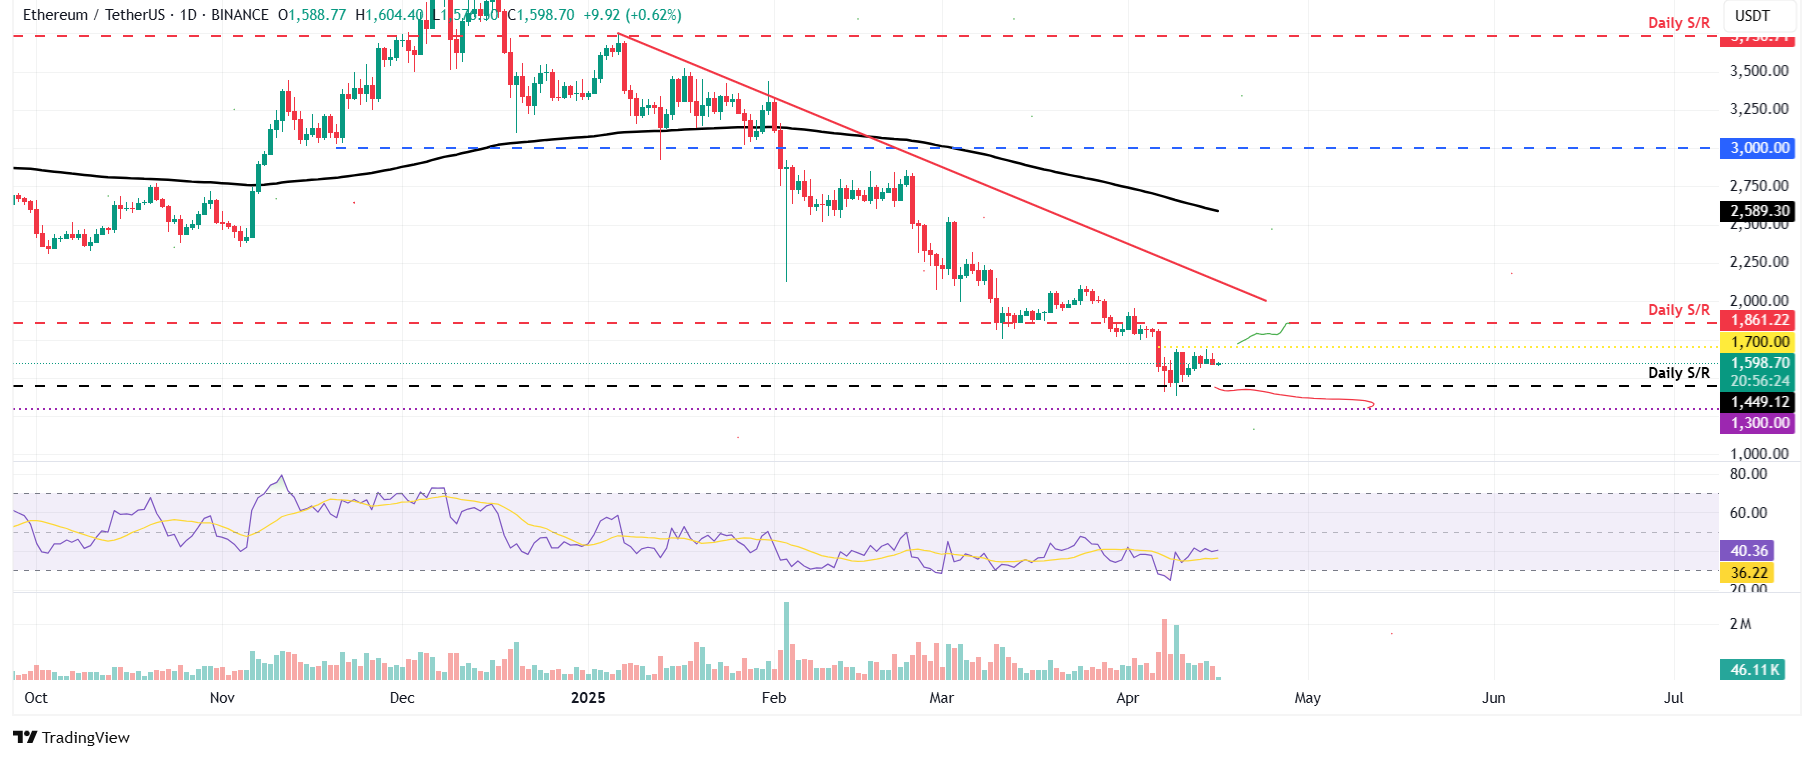
ETH/USDT daily chart
However, if ETH continues its recovery and closes above $1,700, it could extend the rally to retest its next daily resistance at $1,861.
XRP extends losses as it retests the resistance level at $2.23
XRP price broke above the 200-day EMA at $1.95 last week and recovered 11% until Saturday. However, the next day, it faced rejection around the daily level of $2.23 and declined 3.49% until Tuesday. On Wednesday, it hovered around $2.08.
If XRP continues its decline and closes below its 200-day EMA, it could extend the decline to retest its next support level at $1.77.
The RSI on the daily chart had slipped below its neutral level of 50, indicating a rise in bearish momentum.
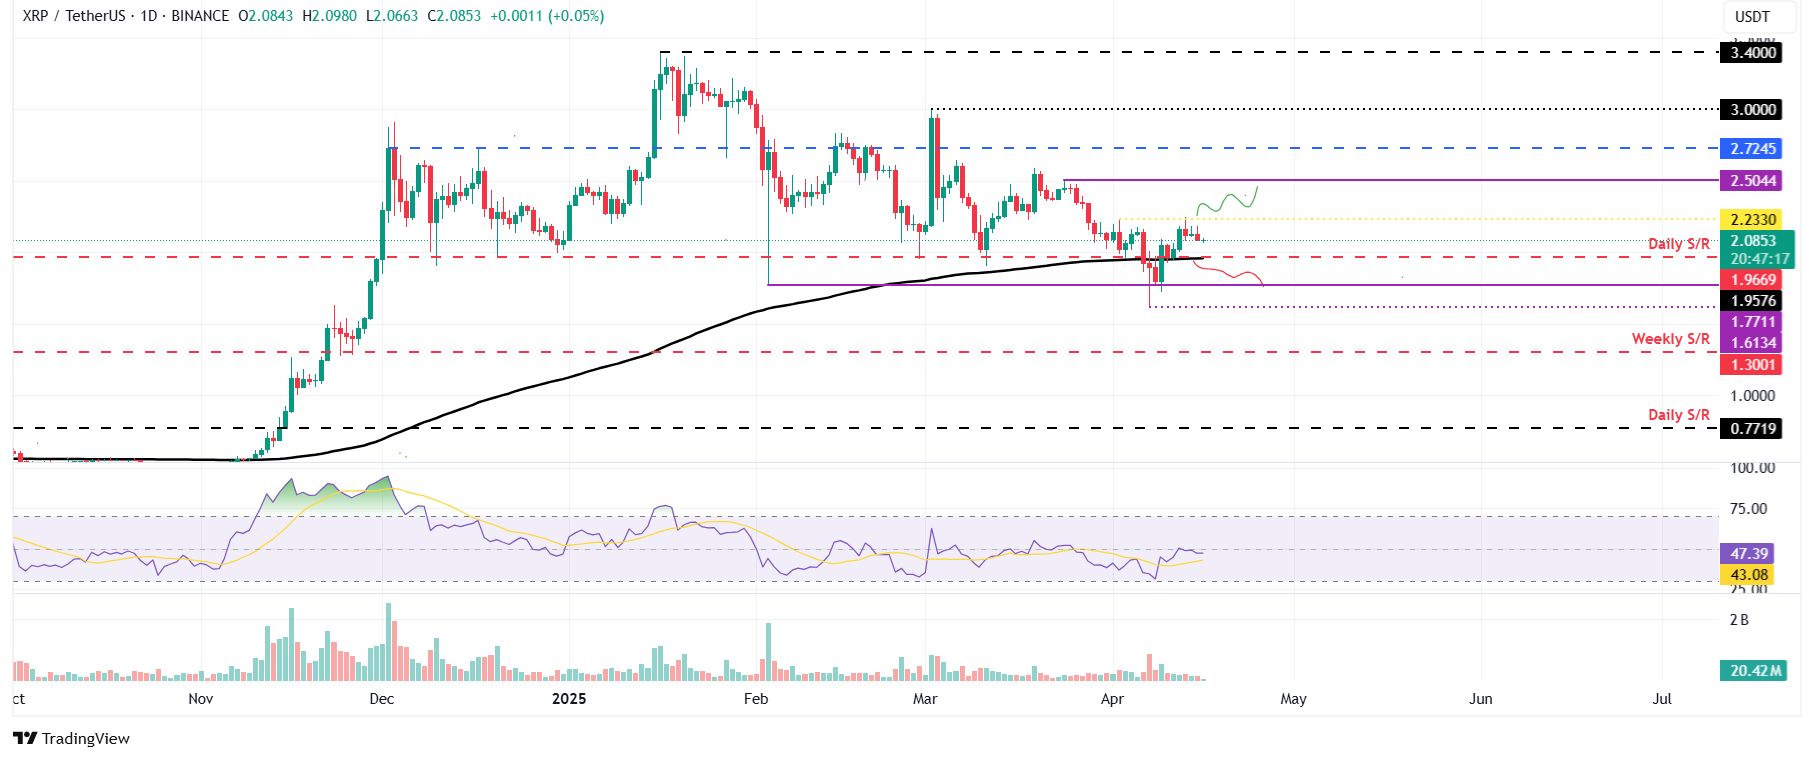
XRP/USDT daily chart
On the other hand, if XRP breaks and closes above $2.23 on a daily basis, it could extend the rally and retest its March 24 high of $2.50.