S&P 500 — US Large Cap Index
 FTSE 100 — UK Blue Chips
 Euro Stoxx 50 — Eurozone Leaders
 DAX 40 — German Equities
 CAC 40 — French Market Index
 Nikkei 225 — Japan Benchmark
 Hang Seng — Hong Kong Index
 Shanghai Composite — China Mainland
 ASX 200 — Australian Market
 TSX Composite — Canada Index
 Nifty 50 — India Large Cap
 STI Index — Singapore Market
 KOSPI — South Korea Index
 Bovespa — Brazil Equities
 JSE Top 40 — South Africa Index
 IPC Index — Mexico Market


Key takeaways
- European natural gas prices reached 95.41 EUR/MWh, hitting the highest level since 2022.
- European gas storage levels stand at 75% capacity, marking the lowest seasonal point since 2009.
- Norwegian supply outages and geopolitical tensions in the Middle East are restricting fuel flows to Europe.
European natural gas (NATGAS.EU, a contract based on Dutch TTF) is trading today at 95.41 EUR/MWh, and in early trading the price reached as high as 97.5 EUR/MWh, the highest level since 2022. This is a continuation of one of the most dynamic price rallies in commodity markets this year: +8.78% weekly, +35.51% month-on-month, +231.28% year-to-date, and +205.21% year-on-year. By comparison, US Henry Hub (NATGAS) is behaving completely opposite, losing 7.09% monthly over the same period and showing levels around 3 USD/MMBtu after the latest rollover, while the November contract fell to 2.5 USD, theoretically the lowest since 2024. The divergence between both sides of the Atlantic has reached sizes rarely seen in the history of both markets.
Bullish fundamentals: lowest seasonal inventories since 2009
At the core of the current move is the storage situation. European gas inventories as of October 24 stand at around 75% capacity (some readings indicate 74.6%), which is the lowest seasonal level since GIE record-keeping began in 2009, compared to a five-year seasonal norm of around 90%. Germany, the continent’s largest market, has inventories at just around 61%, although in volume terms the level rose slightly in the last week (152.07 TWh vs 151.63 TWh previously). France records 108.00 TWh vs 107.82 TWh earlier.
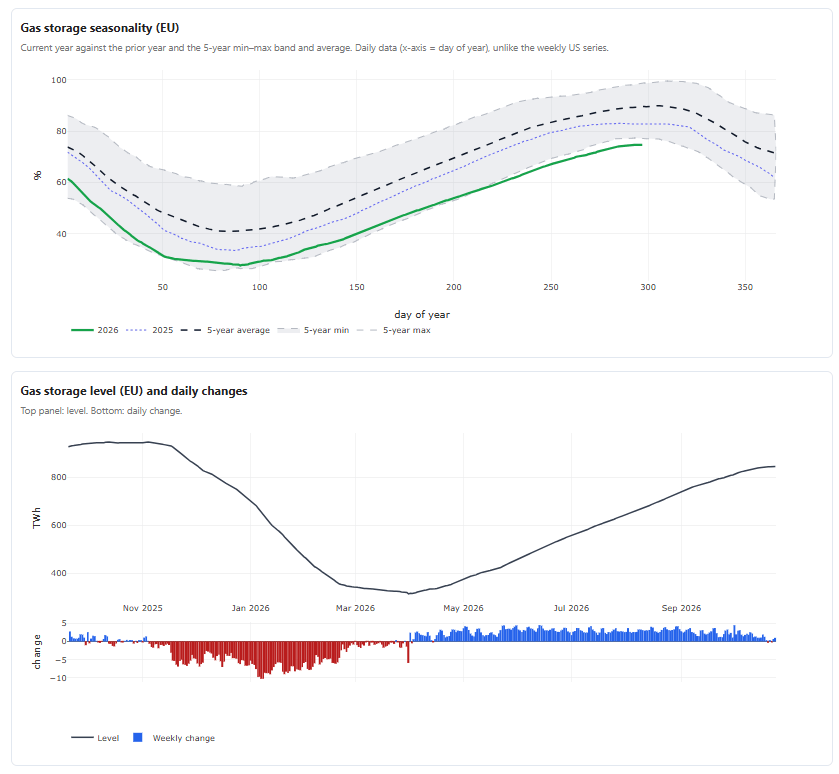
It is worth noting that in recent days there were situations where inventories did not grow, showing that the start of the heating season could lead to stronger price moves. Source: GIE, XTB Added to this is a series of outages on the Norwegian supply side, which right now, at a crucial moment of the season, is limiting flows to the continent. Gassco reports restrictions at the Oseberg field (7.7 mcm/d from October 26), Troll (6.1 mcm/d from October 25), and KárstØ (7.6 mcm/d from October 25), and earlier at Nyhamna (up to 19.8 mcm/d), Åsgard, and Ormen Lange. On top of that, there is a technical issue at the UK’s St. Fergus terminal (Serica Energy), where flow is expected to be restricted through Friday. On top of all this comes geopolitics. LNG shipments from the Middle East to Europe remain down by approx. 80% year-on-year due to shipping disruptions in the Strait of Hormuz, and the market fears that the United States might decide to strike Iran around the mid-term elections date in early November. Trump is reported to have said that a “time of decision” regarding Iran is approaching.
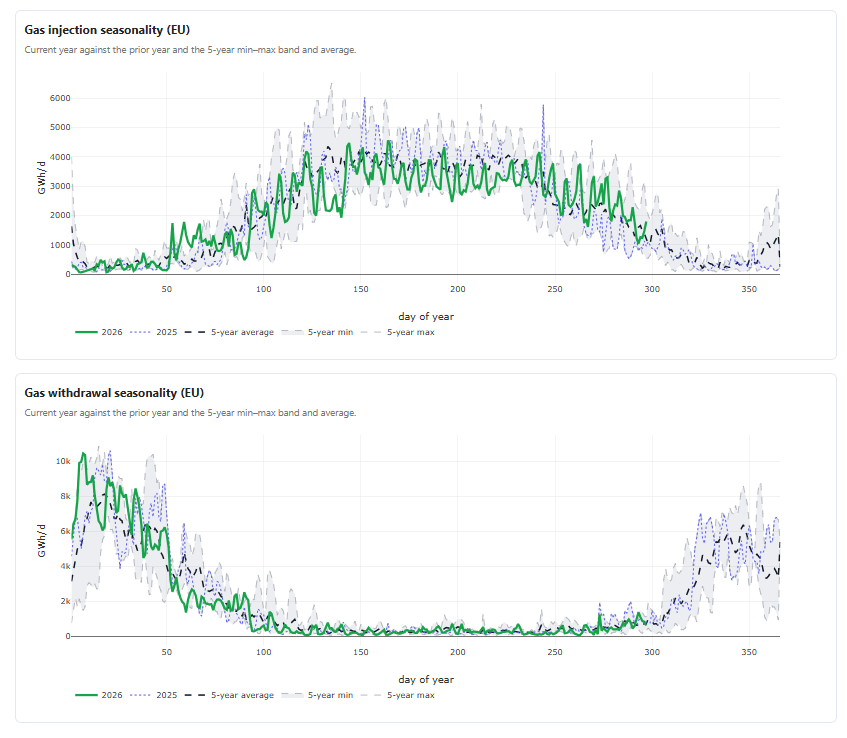
Gas injection into storage is slowing in line with seasonality, but key will be the behavior over the next 2-3 weeks. Source: GIE, XTB The Asian LNG benchmark (JKM) is trading near four-year highs above 30 USD/MMBtu (December contract +2.6% to 31.42 USD, January +4% to 31.54 USD), meaning Europe is physically losing the competition for LNG tanker cargoes to Asian buyers. European LNG imports in October fell below the five-year seasonal norm for the first time since August, despite seasonal expectations for growth.
Technical analysis
The NATGAS.EU daily chart shows a textbook example of a strong uptrend built on two consecutive impulse waves, separated by a correction around June.
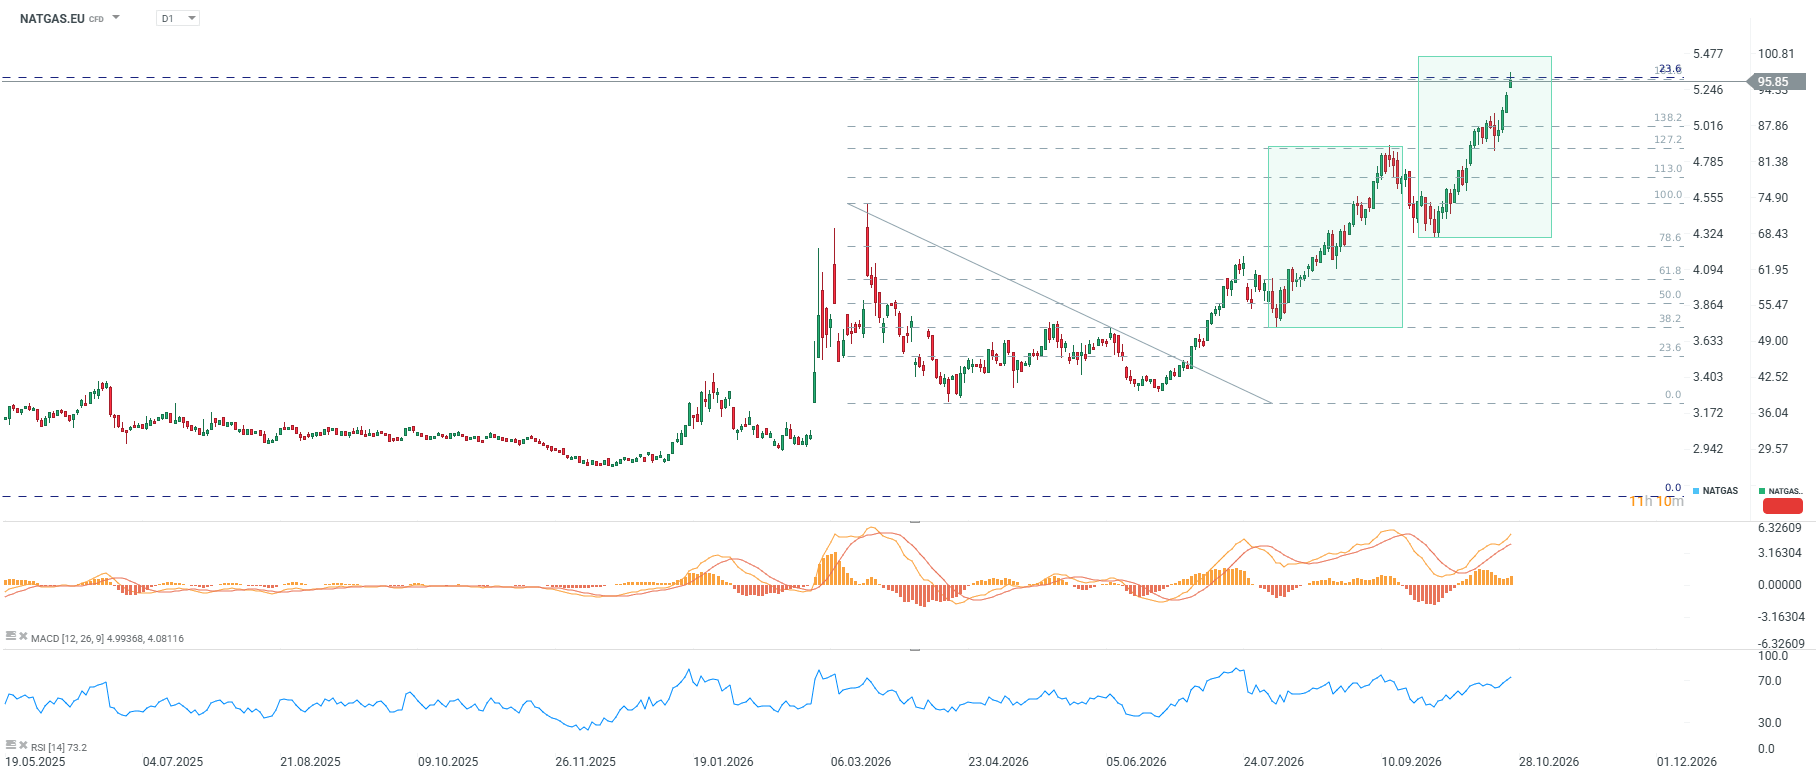
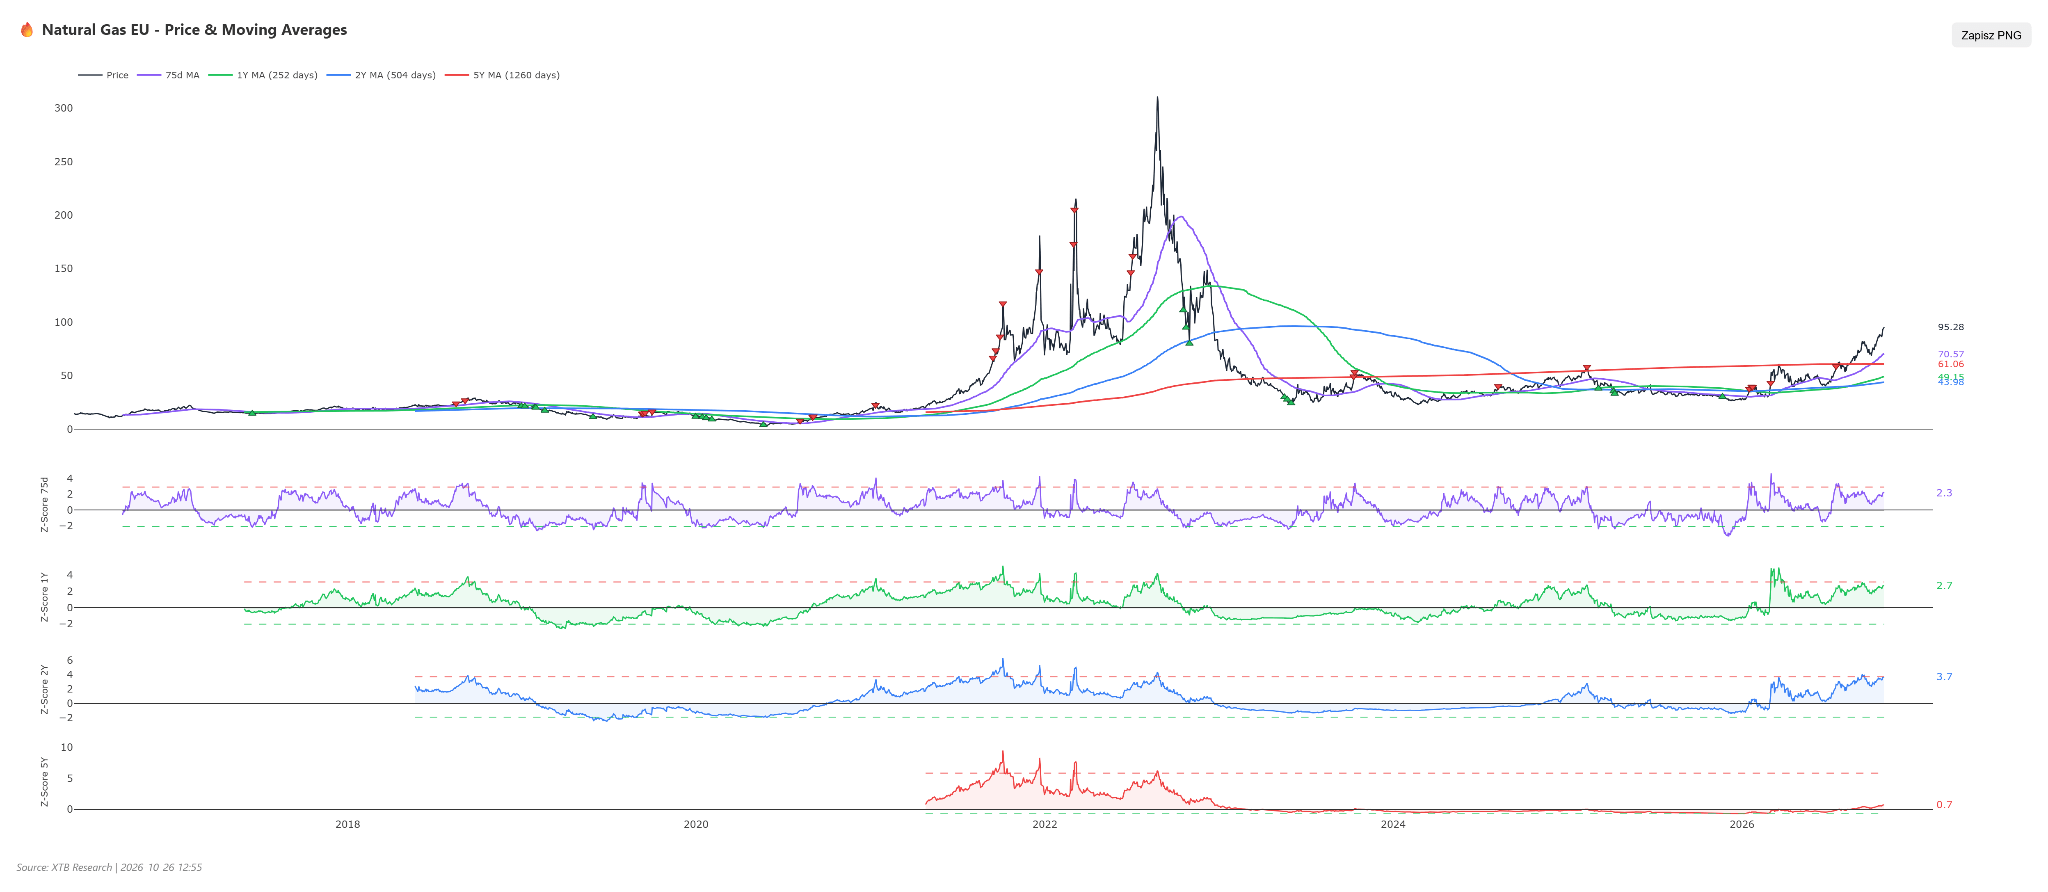
In the current upward impulse since June, we are witnessing the third wave. Comparing it to the second larger one, the range of movement points to a potential for 100 EUR/MWh. At the same time, however, we observe a reaction to the 161.8 retracement of the downward impulse after March and the 23.6 retracement, representing the entire large downward impulse at the end of 2022. Momentum indicators confirm the strength of the move, but also signal clear overbought conditions. RSI(14) stands at 73.3, deep in overbought territory (above 70), which historically preceded at least short-term corrections or consolidations. MACD remains in a bullish structure with a rising histogram and signal lines above zero, although it is worth noting that during the first upward wave in August, the MACD histogram reached significantly higher values than currently at a similar price level. This can be interpreted as an early signal of weakening momentum (divergence), although so far unconfirmed by price action. The price sits 24.59% above the 50-day SMA, an extreme deviation that in itself increases the probability of a technical correction bringing the price closer to the moving average, regardless of fundamentals. Z-score confirms the scale of overvaluation in historical terms: the 1-year Z-score is +2.73, 2-year reaches as high as +3.71, and even the 5-year, which was negative (-0.34) six months ago, climbed to +0.75. This indicates that the current price is a statistically rare event against the backdrop of the past two years of trading.
Scenarios
Bullish scenario. Further escalation around the Strait of Hormuz, actual US military actions against Iran, and a continued Middle Eastern LNG deficit, coupled with colder weather arriving in Europe, would push prices through the 100 EUR barrier towards 112–118 EUR/MWh. The market still needs to replenish record-low inventories, so any demand impulse will translate into aggressive bidding for cargoes against Asian buyers. Bearish scenario. De-escalation of tensions in the Middle East, resumption of safe passage through Hormuz, and mild early winter temperatures would remove the threat of physical shortages and trigger profit-taking after the strong rally. Under this setup, price could fall to support at 88.00 EUR, with potential to deepen declines to 75.50 EUR/MWh, especially given the extreme overbought levels according to RSI and Z-score.
Summary
The European gas market finds itself in a rare situation where extremely tight fundamentals (lowest seasonal inventories since 2009, a series of Norwegian outages, competition for LNG cargoes with Asia) coincide with an equally extreme technical picture (RSI above 73, 1-year Z-score over +2.7, price 24.6% above SMA50). This combination justifies a further march toward 100 EUR in the event of bad news from the Middle East or weather fronts, while simultaneously making the market exceptionally vulnerable to a sharp correction at the first sign of de-escalation.