S&P 500 — US Large Cap Index
 FTSE 100 — UK Blue Chips
 Euro Stoxx 50 — Eurozone Leaders
 DAX 40 — German Equities
 CAC 40 — French Market Index
 Nikkei 225 — Japan Benchmark
 Hang Seng — Hong Kong Index
 Shanghai Composite — China Mainland
 ASX 200 — Australian Market
 TSX Composite — Canada Index
 Nifty 50 — India Large Cap
 STI Index — Singapore Market
 KOSPI — South Korea Index
 Bovespa — Brazil Equities
 JSE Top 40 — South Africa Index
 IPC Index — Mexico Market
XAG/USD bulls might await move beyond $33.00 before placing fresh bets

- Silver regains positive traction at the start of a new week following Friday’s modest slide.
- The technical setup seems tilted in favor of bulls and supports prospects for further gains.
- Any corrective pullback towards the $32.00 mark could be seen as a buying opportunity.
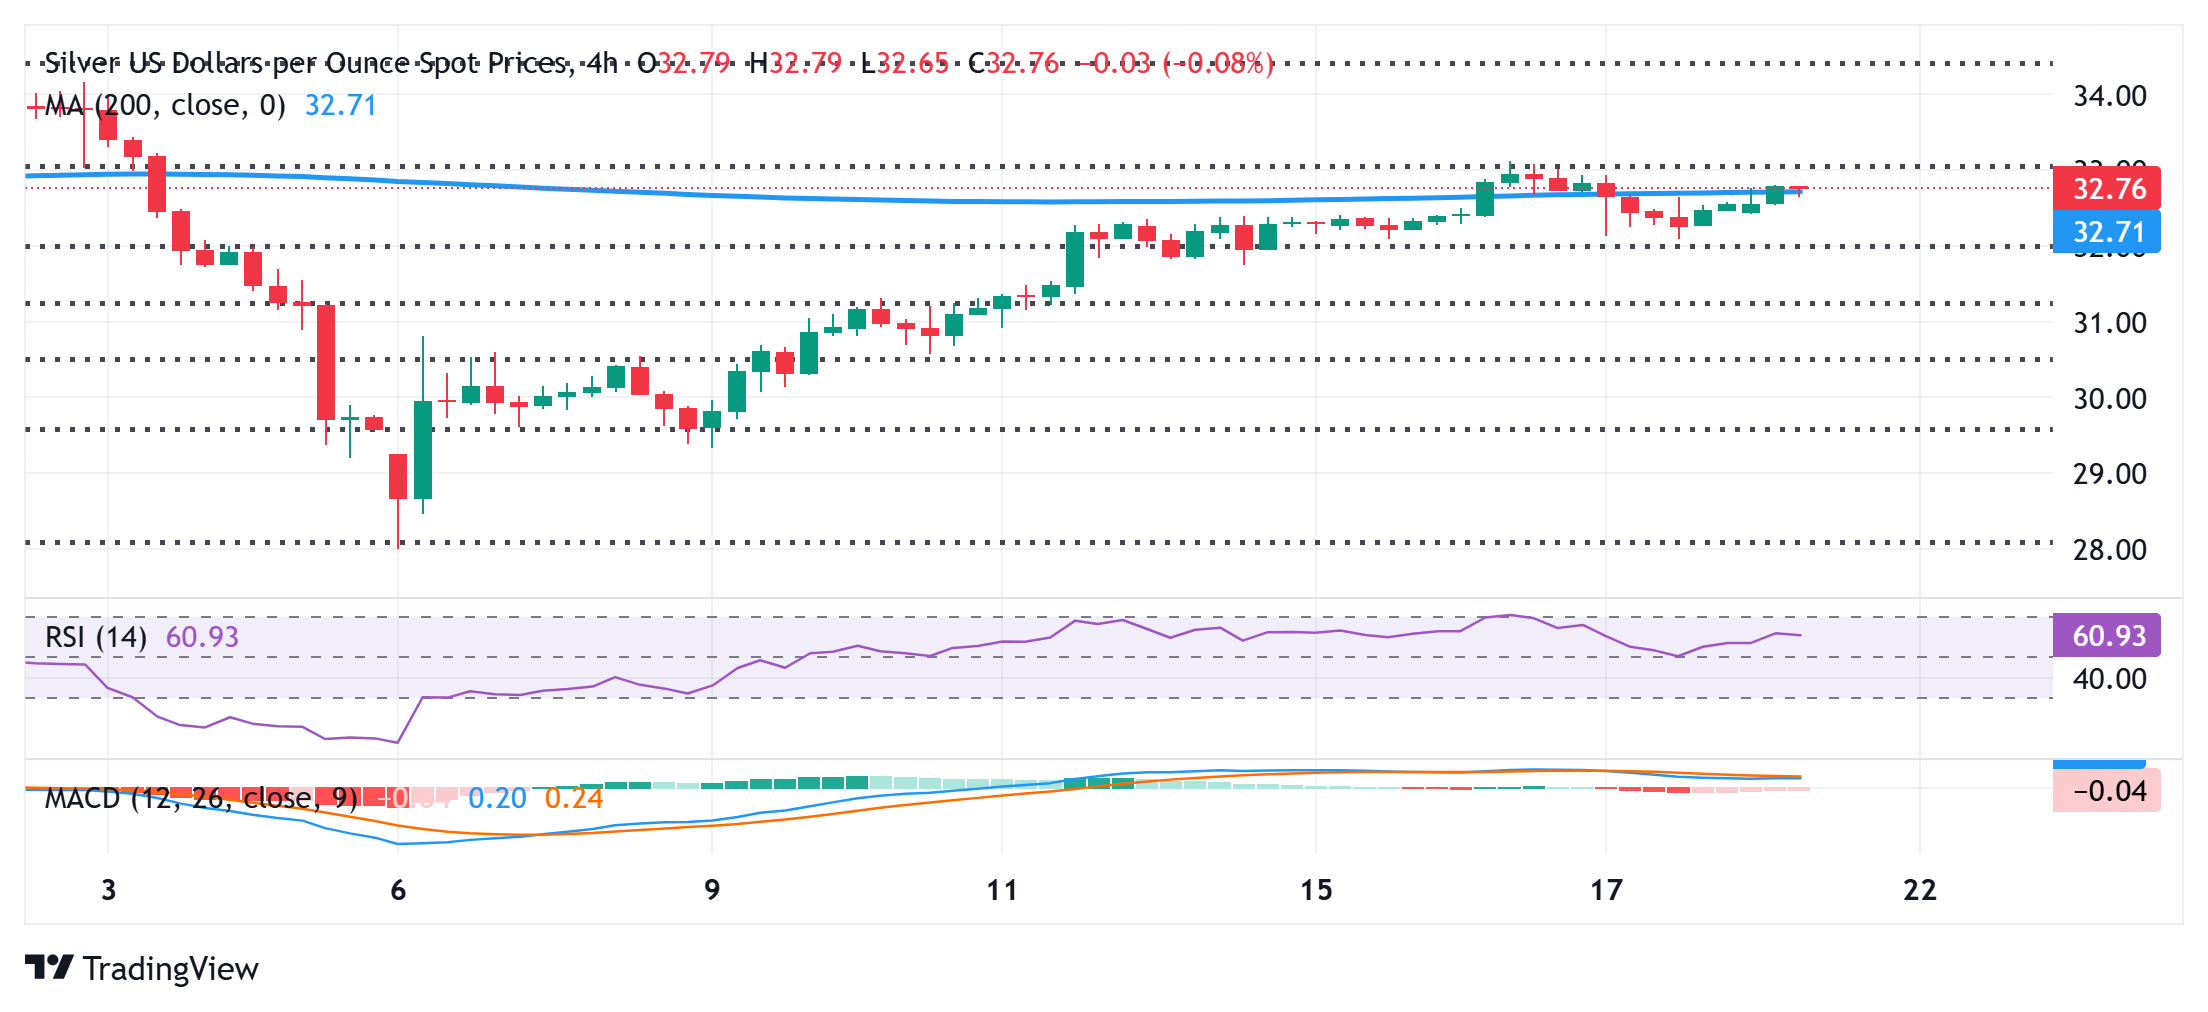
Silver (XAG/USD) attracts some dip-buyers at the start of a new week and touches an intraday high, around the $32.80 region during the Asian session. The white metal, however, remains below the $33.00 mark and a nearly two-week high touched last Thursday, warranting some caution for bullish traders.
From a technical perspective, the XAG/USD now seems to have found acceptance above the 61.8% Fibonacci retracement level of the recent slump from the March swing high to a fresh year-to-date low touched earlier this month. Moreover, oscillators on the daily chart have again started gaining positive traction and support prospects for a further near-term appreciating move.
However, it will still be prudent to wait for a sustained strength beyond the $33.00 mark, or the 78.6% Fibo. level, before placing fresh bullish bets. The XAG/USD might then accelerate the positive momentum towards the $33.20 area, en route to the next relevant hurdle near the $33.50-$33.55 region and the $34.00 neighborhood, or a multi-month peak touched in March.
On the flip side, Friday’s swing low, around the $32.10-$32.05 region, or the 61.8% Fibo. level might continue to act as an immediate support. Any further slide could be seen as a buying opportunity and remain limited near the $31.35-$31.30 area, or the 50% Fibo. level. A convincing break below, however, might prompt technical selling and make the XAG/USD vulnerable.
The subsequent further might then drag the XAG/USD below the $31.00 round-figure mark, towards the $30.55 area, or the 38.2% Fibo. level. The downward trajectory could extend further toward the $30.00 psychological mark en route to the $29.55 region (23.6% Fibo.). The latter should act as a key pivotal point, which if broken might shift the bias in favor of bearish traders.