S&P 500 — US Large Cap Index
 FTSE 100 — UK Blue Chips
 Euro Stoxx 50 — Eurozone Leaders
 DAX 40 — German Equities
 CAC 40 — French Market Index
 Nikkei 225 — Japan Benchmark
 Hang Seng — Hong Kong Index
 Shanghai Composite — China Mainland
 ASX 200 — Australian Market
 TSX Composite — Canada Index
 Nifty 50 — India Large Cap
 STI Index — Singapore Market
 KOSPI — South Korea Index
 Bovespa — Brazil Equities
 JSE Top 40 — South Africa Index
 IPC Index — Mexico Market
Chart of the Day – Yen Falls From 40-Year Highs – What’s Next?


After reaching its highest level since 1986 (163.99), the USDJPY pair recorded a very dynamic decline. The movement was driven by the first coordinated intervention by the US and Japan since 2011. At that time, the yen was weakened following a massive earthquake. US Treasury Secretary Scott Bessent and Japan’s Minister of Finance Satsuki Katayama emphasised that both sides are prepared to take further action to stabilise the exchange rate.
Historic intervention
According to data provided by the Bank of Japan, the scale of the Japanese intervention may have reached as much as 59 billion dollars, which would be unprecedented given the scale of a one-day intervention. Although we cannot estimate the scale of the US action using official data, many indications suggest it reached 5-10 billion dollars. This is suggested, at least, by a note left by Scott Bessent during a meeting in Maryland.
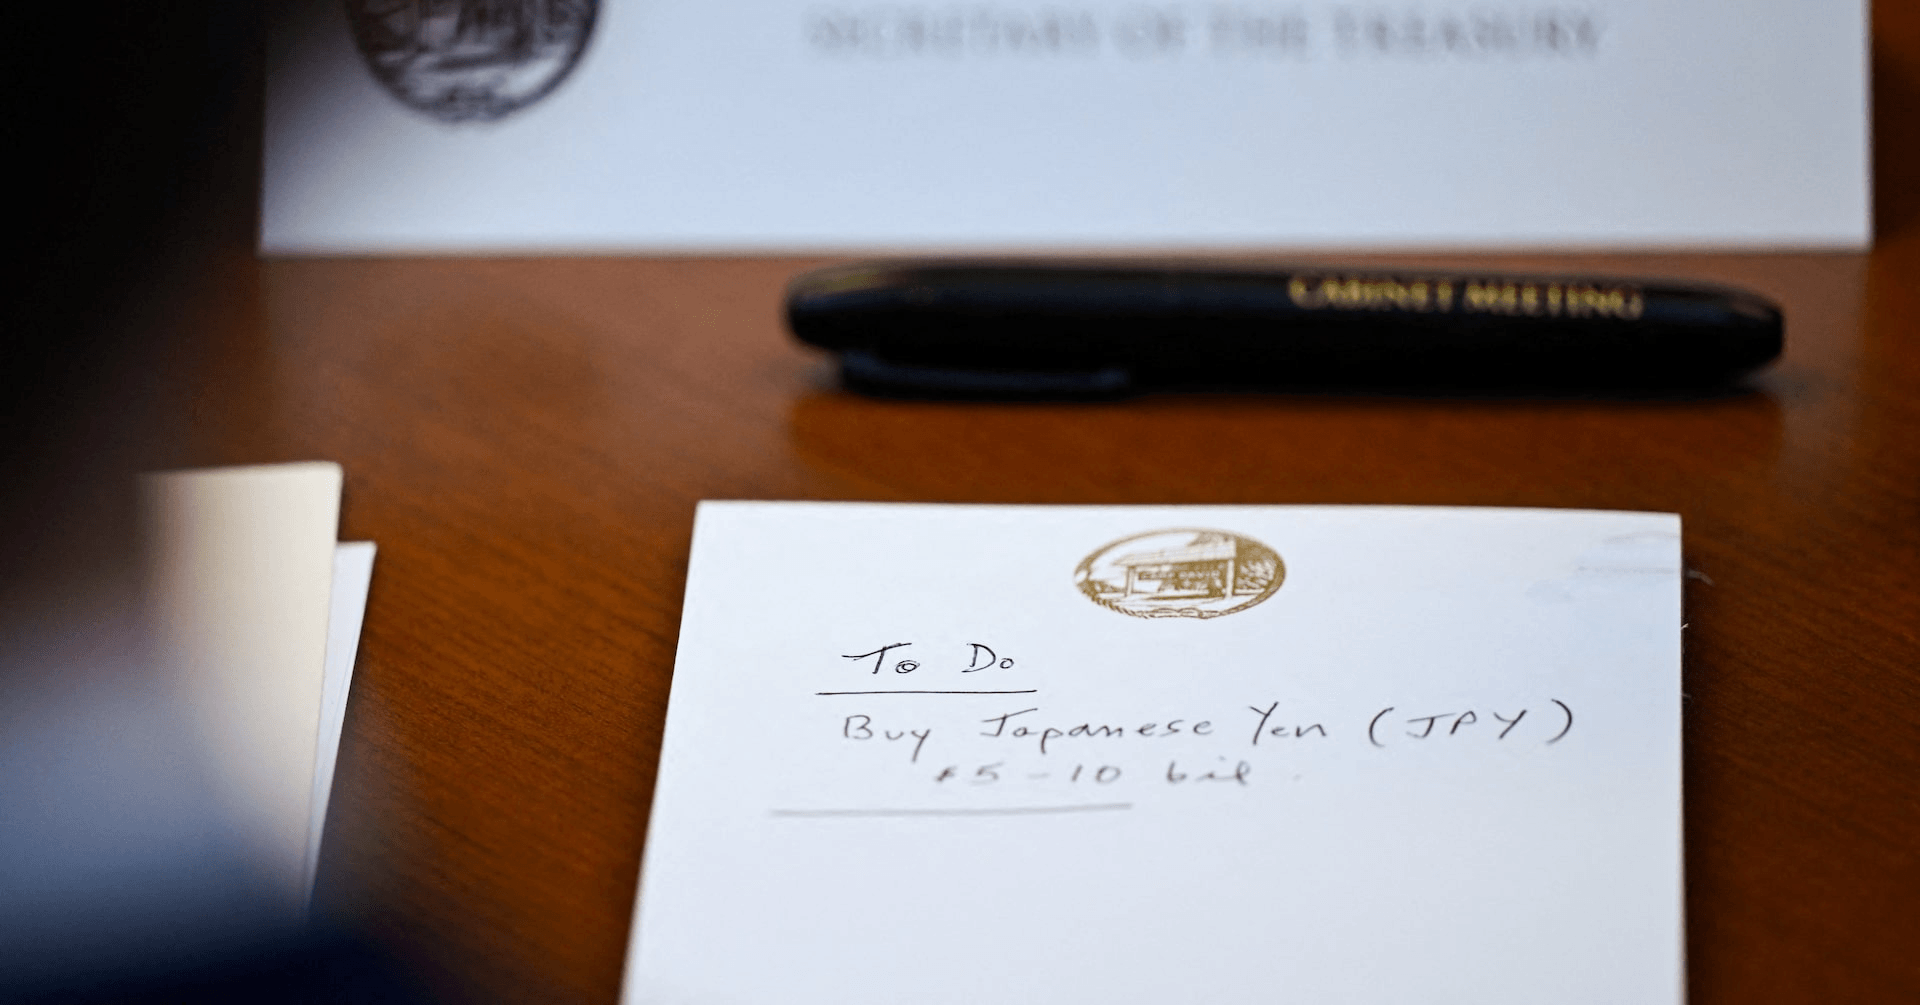
Source: Reuters The US intervention was confirmed over the weekend by President Trump: “Japan has been very good to us, except, of course, for the attack on Pearl Harbor. (…) They have a weakening yen and they needed a little help. And we are always ready to help Japan.” Today, an official letter confirming the intervention was published by Minister Katayama.
Is the Mar-a-Lago accord returning?
Due to US cooperation in the recent intervention aimed at strengthening the yen, the issue of broader White House policy is returning to the fore. A return to actions aimed at weakening the US currency, which would support domestic exports, seems possible. At the beginning of 2025, such actions were termed the “Mar-a-Lago Accord,” a modern attempt to repeat the premises of the 1985 Plaza Accord.
What is behind the earlier weakening of the yen?
Key to this was the return of the carry trade, i.e., trading on interest rate differentials.
How does this work?
This strategy is based on borrowing a currency (in this case, the yen) at near-zero interest rates and immediately exchanging it for another (e.g., the dollar) to make investments in a market offering higher returns. Although the Bank of Japan has moved away from its ultra-loose monetary policy and implemented five interest rate hikes in recent months, bringing the reference interest rate to its highest level in over 20 years (1%), it still remains far below levels seen in the United States (3.75%) and many other developed economies, such as Australia (4.35%), Norway (4.25%), the UK (3.75%), or the eurozone (2.4% – deposit rate).
BoJ holds rates
In line with market expectations, the Bank of Japan kept interest rates unchanged overnight from Thursday to Friday. The main interest rate remains at 1%. The decision was made by a vote of 8 to 1. One of the hawks, Hajime Takata, voted in favour of a hike. Due to government initiatives aimed at supporting households regarding energy prices, the BoJ revised down its inflation forecast for the 2026 fiscal year, lowering it from 2.8% to 2.5%. At the same time, the inflation forecast for 2027 was raised from 2.3% to 2.4%. The meeting was treated as a pause to assess the impact of recent tightening. Naoki Tamura, a board member, suggested the possibility of raising rates at intervals of a few months by 25 basis points until reaching a level of approx. 2%. This is largely consistent with market valuations. The market-implied probability of a hike in September can be compared to a coin toss. An upward move before the end of the year is fully priced in. It is possible that the BoJ will raise rates twice in the mentioned period.
What is the inflation situation?
The quarterly report published in July showed that households estimate prices will grow at a rate of 10.8% over the next five years. The survey has never shown such high values (though it should be noted that it has only been conducted for 20 years). Although this figure is inflated by the survey methodology – an average is presented, which is contaminated by irrationally high expectations of part of the society – the anxiety regarding rising price pressure cannot be underestimated. The median (5%) is also growing very dynamically, which may be a more reliable indicator in this regard. Inflation grew in the last four months by 0.4%, 0.1%, 0.4%, and 0.3% respectively on a monthly basis – when annualised, this data suggests price growth in the region of 4-5%. After excluding the most volatile energy and food prices, the situation looks better, but much still points to a significant rise in the indicator from current levels (1.6%). Significant factors may include, among others, relatively dynamic wage growth (3.2% in May).
Dependence on energy imports
A weaker yen is not just a matter of carry trade. The outbreak of war in the Middle East plays a significantly important role, which brought oil and LNG prices to their highest levels since 2022, when Russia launched a full-scale attack on Ukraine. Nearly 90% of Japan’s energy demand comes from imports, and under normal conditions, its main suppliers are Middle Eastern countries.
Figure 1: Japan’s Energy Sector Trade Balance (1998 – 2026)
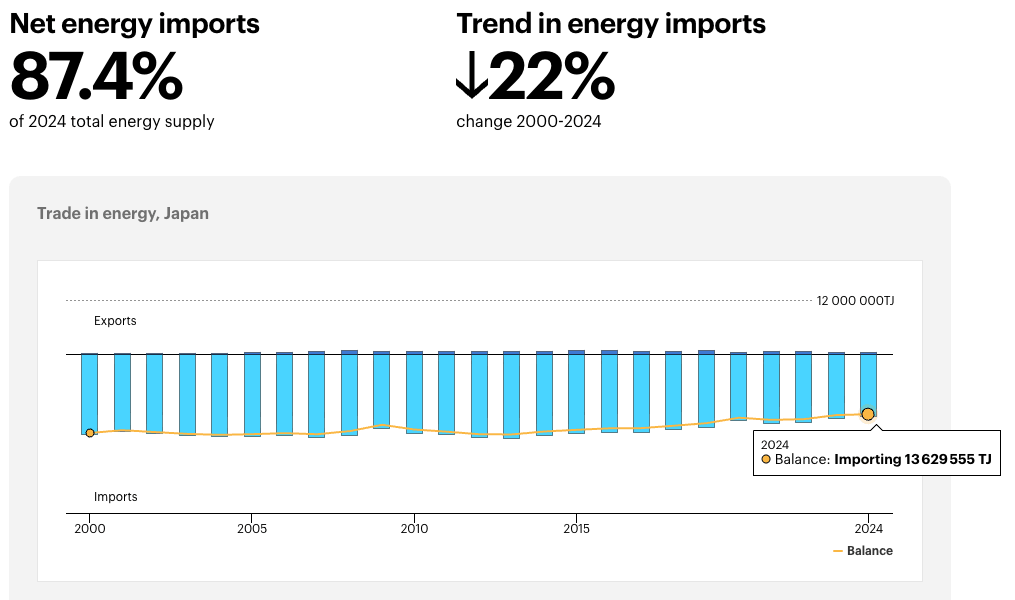
Source: IEA, 03.08.2026 The prolonged lack of de-escalation in the conflict between the United States and Iran may translate not only into a significant increase in inflationary pressure but also into problems maintaining the continuity of key energy resource supplies. Figure 2: Structure of Japan’s Crude Oil Imports (2024)
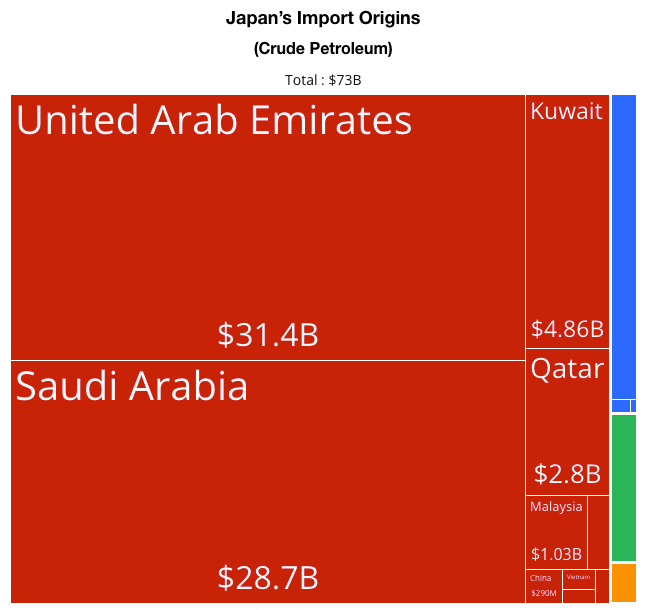
Source: OEC, 03.08.2026
Technical analysis
Figure 3: USDJPY [D1] (20.01.2026 – 03.08.2026)
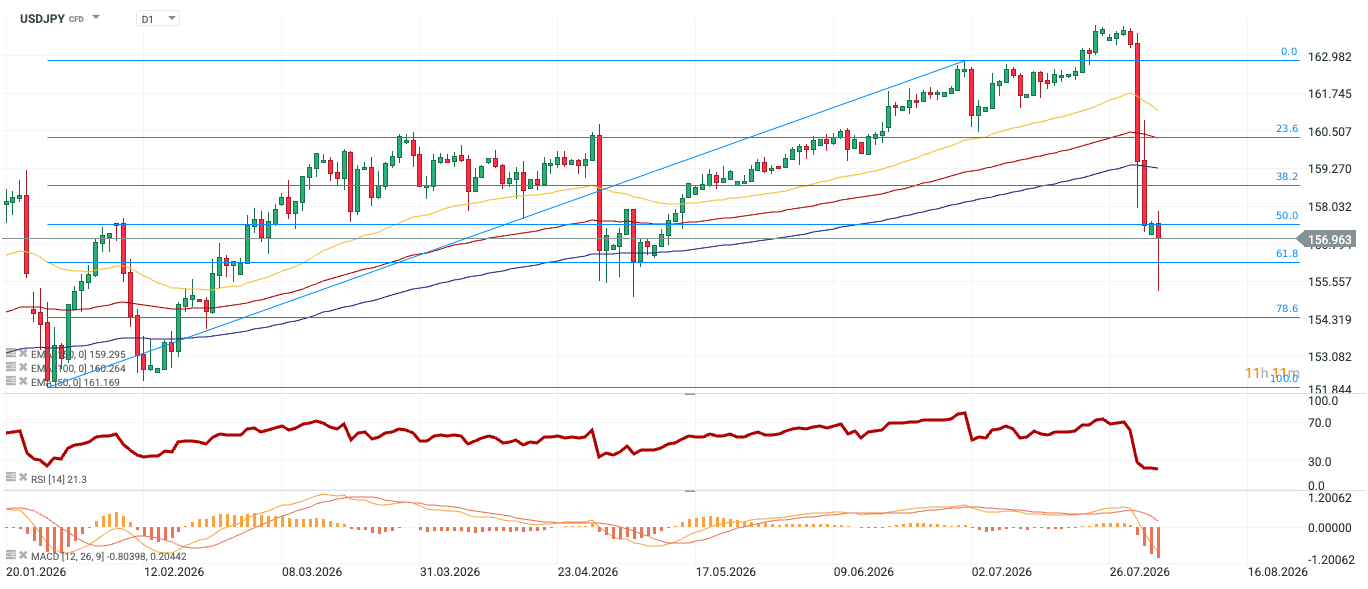
Source: xStation, 03.08.2026 After reaching a local peak near the 164 level, the market experienced a sharp collapse. The price broke through key structural supports with momentum and is currently in the 157 region. It is worth noting, however, that a long lower wick formed on one of the recent candles – this signifies the first serious attempt at defence and a reaction from demand. The price drastically broke down through the band of moving averages (EMA 50, EMA 100, and EMA 200). For a long time, these averages (blue, red, and yellow lines) served as dynamic supports in the uptrend. Currently, this setup has been negated. The closest of them (blue, around 159.3) now constitutes the first very important dynamic resistance in the case of a possible rebound.
The long lower wick of the bearish candle tested the 78.6 Fibo retracement. Currently, the price has rebounded and is fighting to hold above the 61.8 retracement. The RSI indicator is at the 21.3 level. This is an extreme oversold zone (below 30). Although in strong downtrends, the RSI can stay in this zone for a long time, such a low value is a strong warning signal of a possible upward correction or at least a transition into consolidation to “cool down” the indicator. MACD confirms a strong downtrend. The lines have crossed downwards and are moving away from the zero level, and the histogram is growing in the negative zone. There are no divergences here at this moment.