🛢️ Oil
- Largest quarterly drop since the pandemic: Brent crude oil futures prices fell by approximately 30% in the second quarter of 2026, excluding futures rollovers, but at the same time almost completely offsetting the gains triggered by the outbreak of the US-Iran war in February.
- At the end of June, prices for the September Brent contract fluctuated around $74 per barrel, while WTI for August delivery was approximately $70.6.
- Breakthrough in the Strait of Hormuz and ceasefire: The US and Iran recently signed a temporary agreement and are conducting peace talks in Doha (Qatar), even despite the latest exchange of fire over the weekend. The ceasefire led to a faster-than-expected market restoration of tanker traffic through the strategic Strait of Hormuz.
- According to Goldman Sachs, the flow of raw material through this logistics point has already returned to nearly 80% of the pre-conflict level. Meanwhile, Morgan Stanley reported that the daily number of tankers leaving the Persian Gulf has returned to the pre-war norm (30–40 units).
- Official data indicate that the official number of ships passing through the Strait of Hormuz reaches about 1/3 of the pre-war norm. However, it is known that many ships still pass with transponders turned off, fearing a repeat of the weekend situation when two container ships were attacked.
- Morgan Stanley warns of oversupply. The bank lowered its price forecasts for the second time in two weeks. Dated Brent is estimated to cost an average of $75 per barrel in Q3 and Q4 2026 (a reduction of $15 and $5, respectively).
- Analysts point to the market’s return to a structural surplus of raw material in light of the unlocking of reserves from the Middle East, strong exports from the US, and weak demand in China. It is worth mentioning that recent IEA forecasts indicated oversupply only in Q4, but with the current rapid return of supply to normalcy, oversupply is possible as early as the summer holidays.
- Forward curve signals weakness: A bearish price structure of the contango type has appeared on the exchanges (contracts with immediate delivery are traded at a discount to subsequent months), which confirms the short-term loosening of the physical balance of the raw material on the market. On the other hand, this contango is an effect of the expiration of the futures contract. Nevertheless, there has been a clear change in the forward structure, which points to a fundamental change in the situation.
- Data from the USA: The US Department of Energy (DOE) raised its forecast for average domestic production for 2026 to 13.72 million barrels per day. The number of active drilling rigs increased at the end of June by 7 units to 440 (an annual maximum). Despite this, the latest commercial inventories in the US stood 6.5% below the 5-year seasonal average.
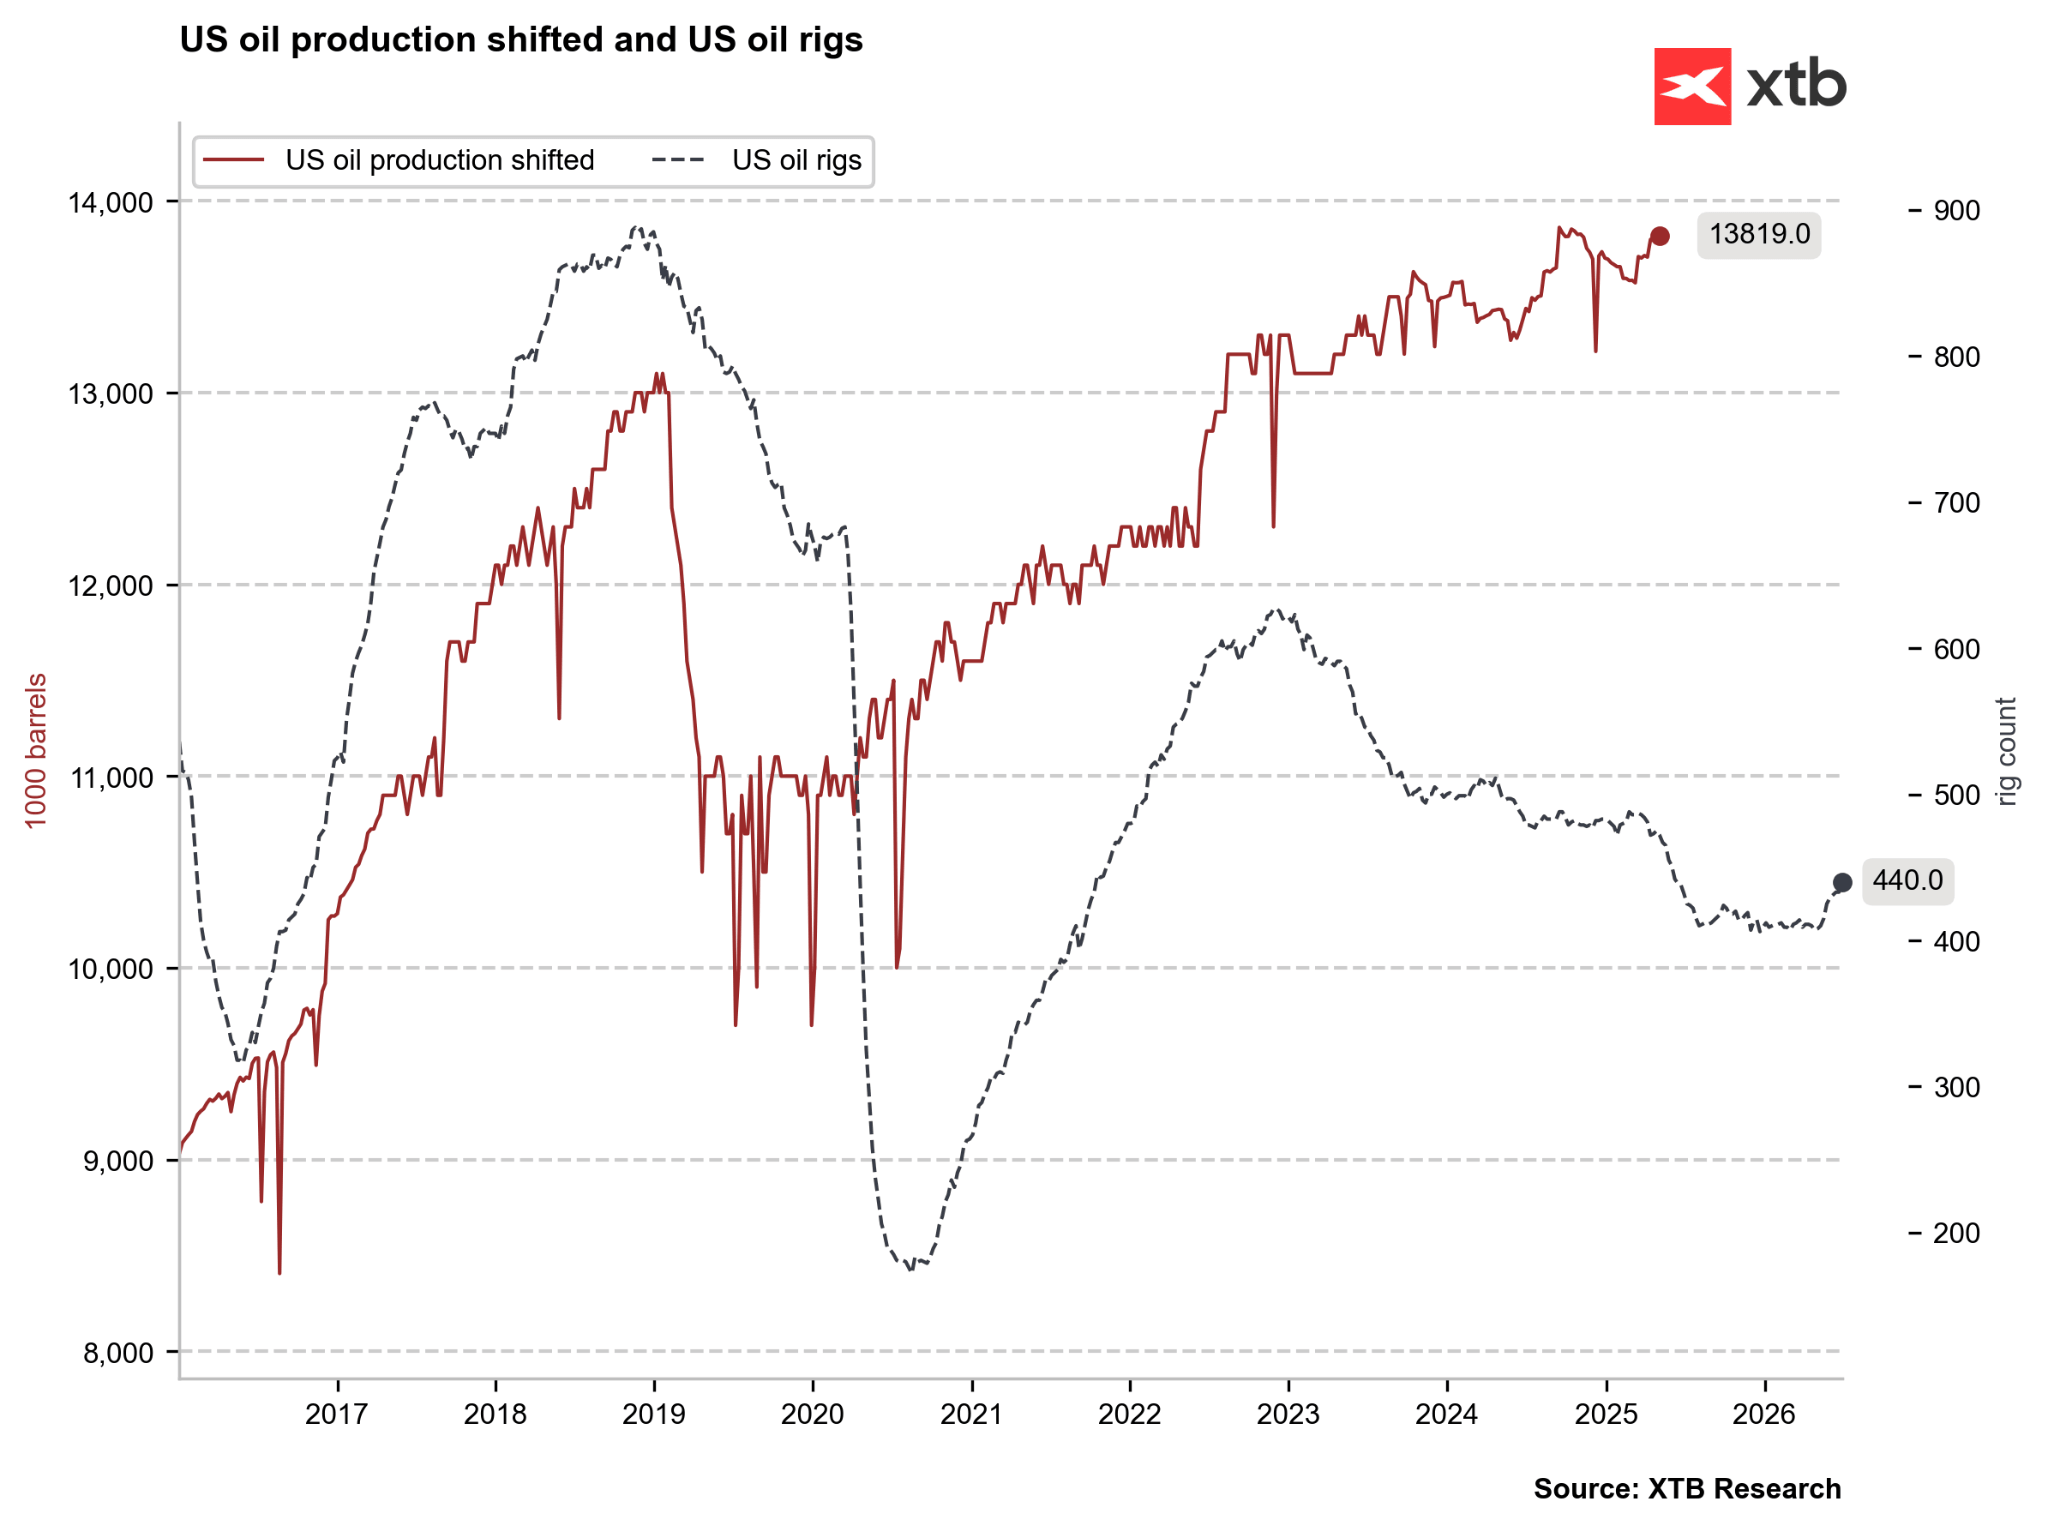
The number of drilling rigs in the US is growing, and production is reaching nearly a historical peak. Source: Bloomberg Finance LP, XTB
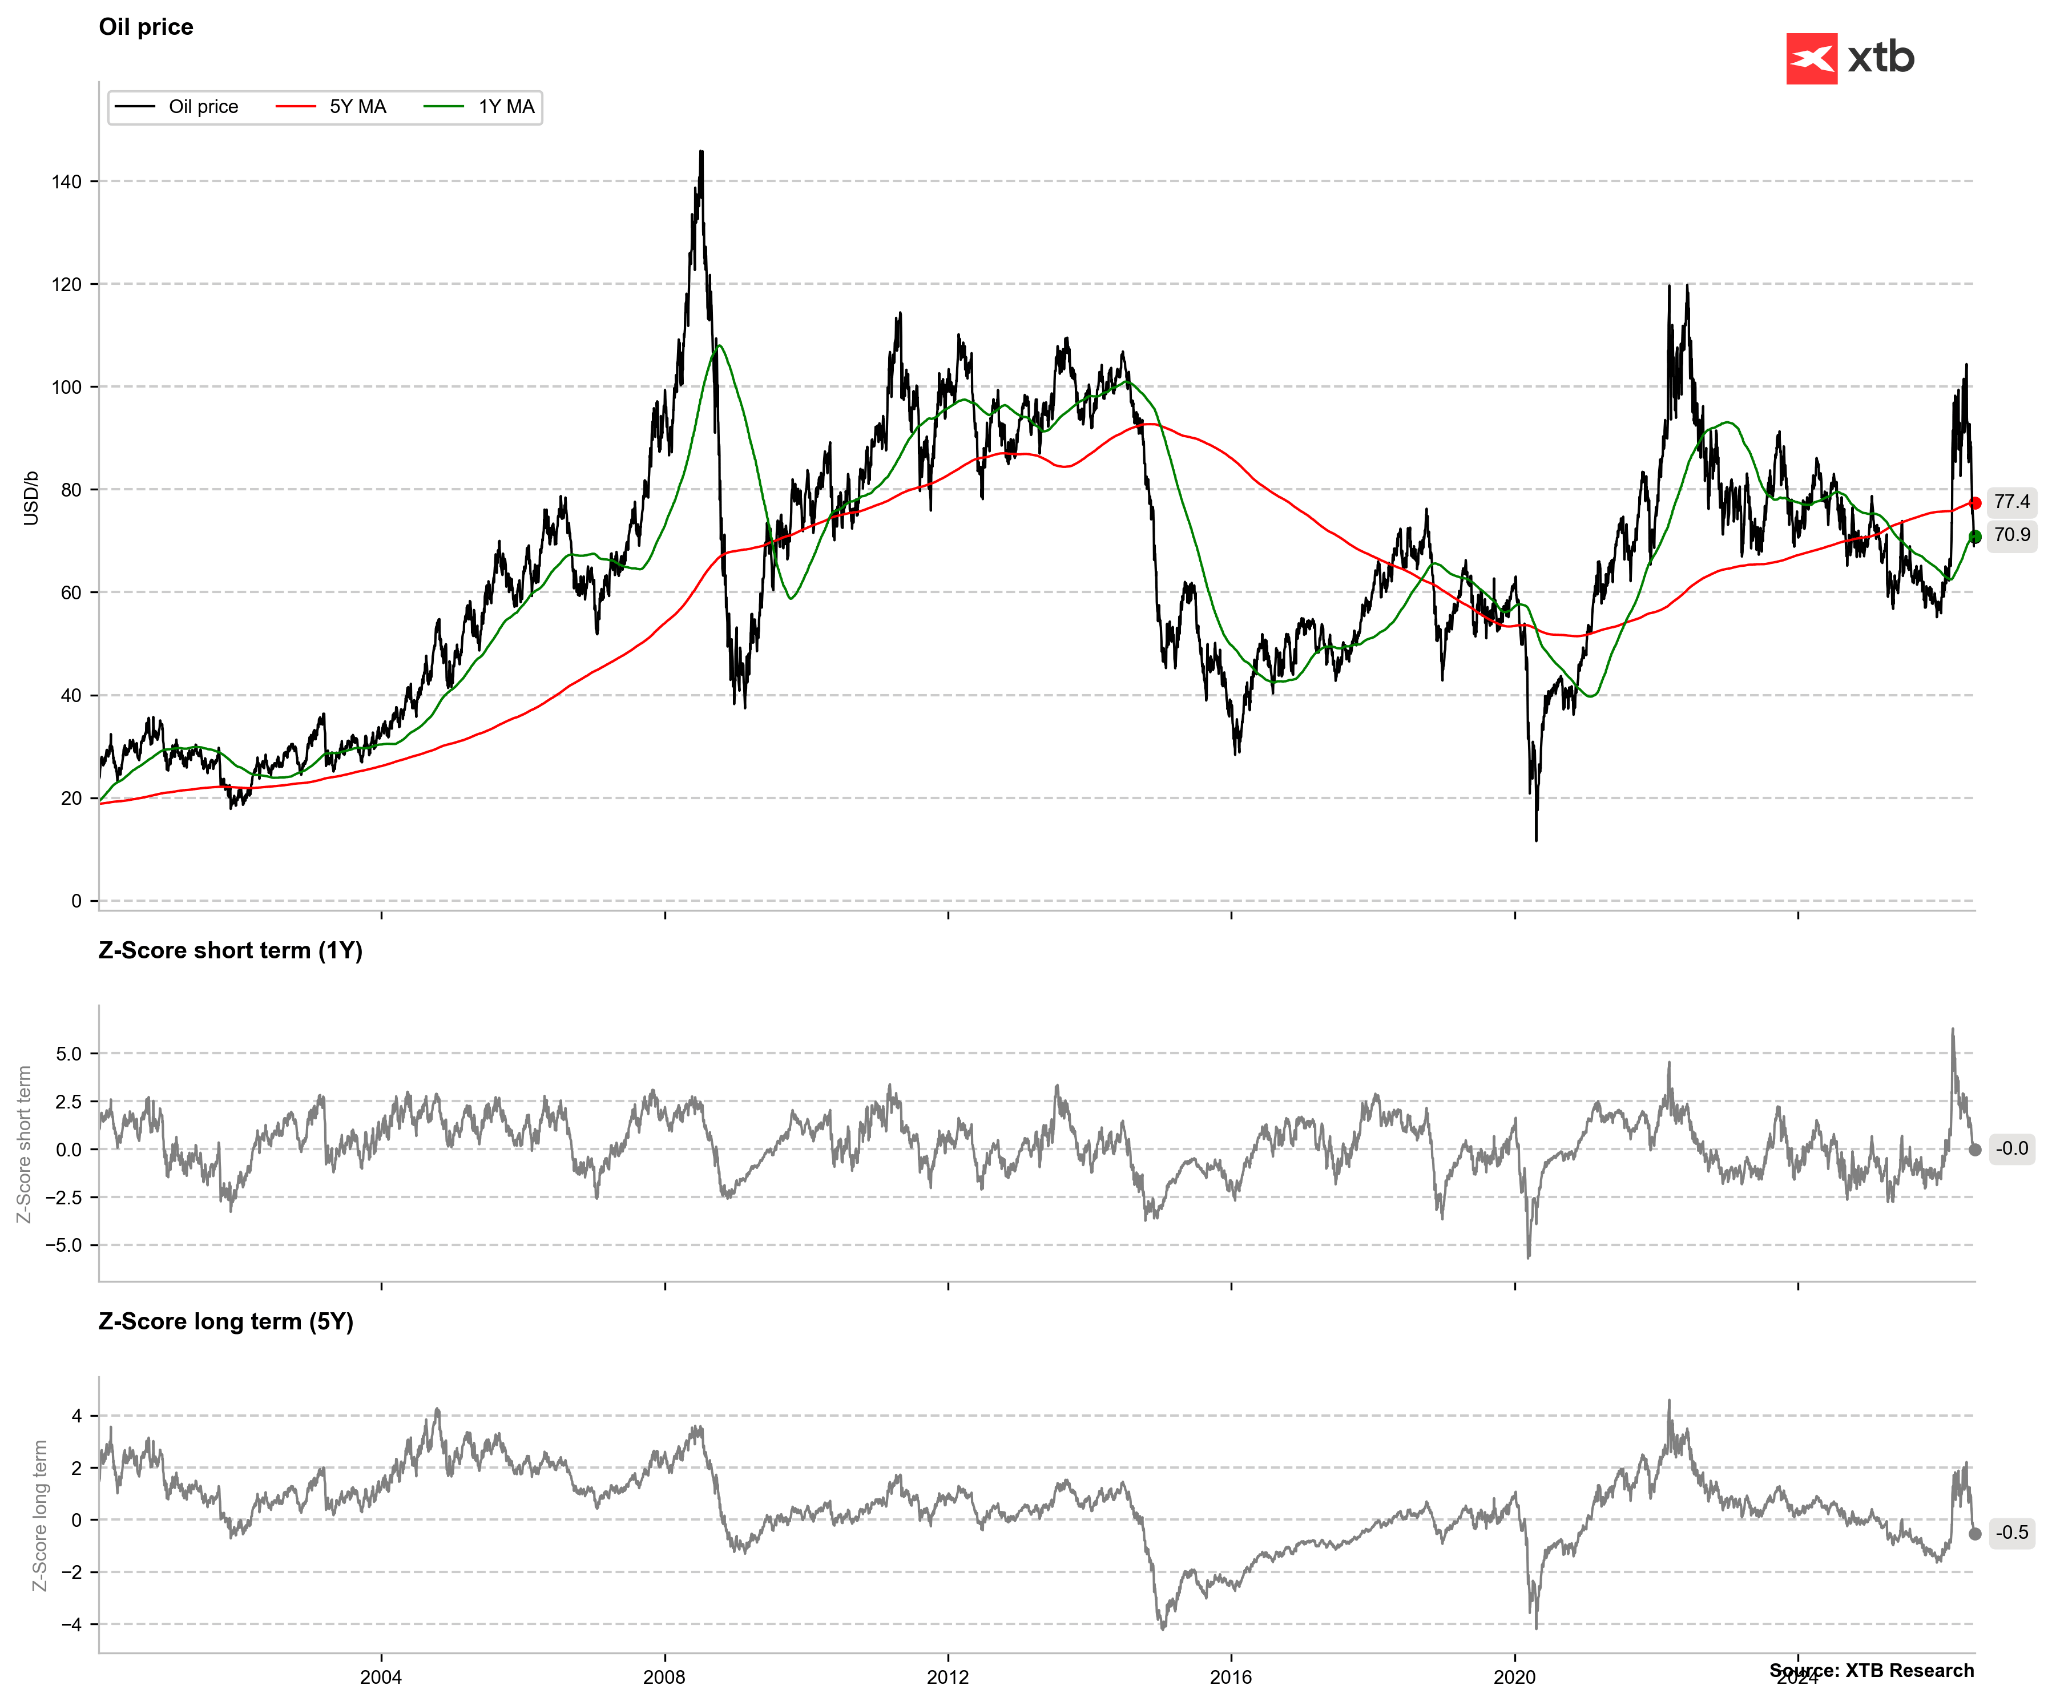
WTI oil fell to the 1-year average and is below the 5-year average. Around $60 per barrel, an oversold signal may be possible. Source: Bloomberg Finance LP, XTB
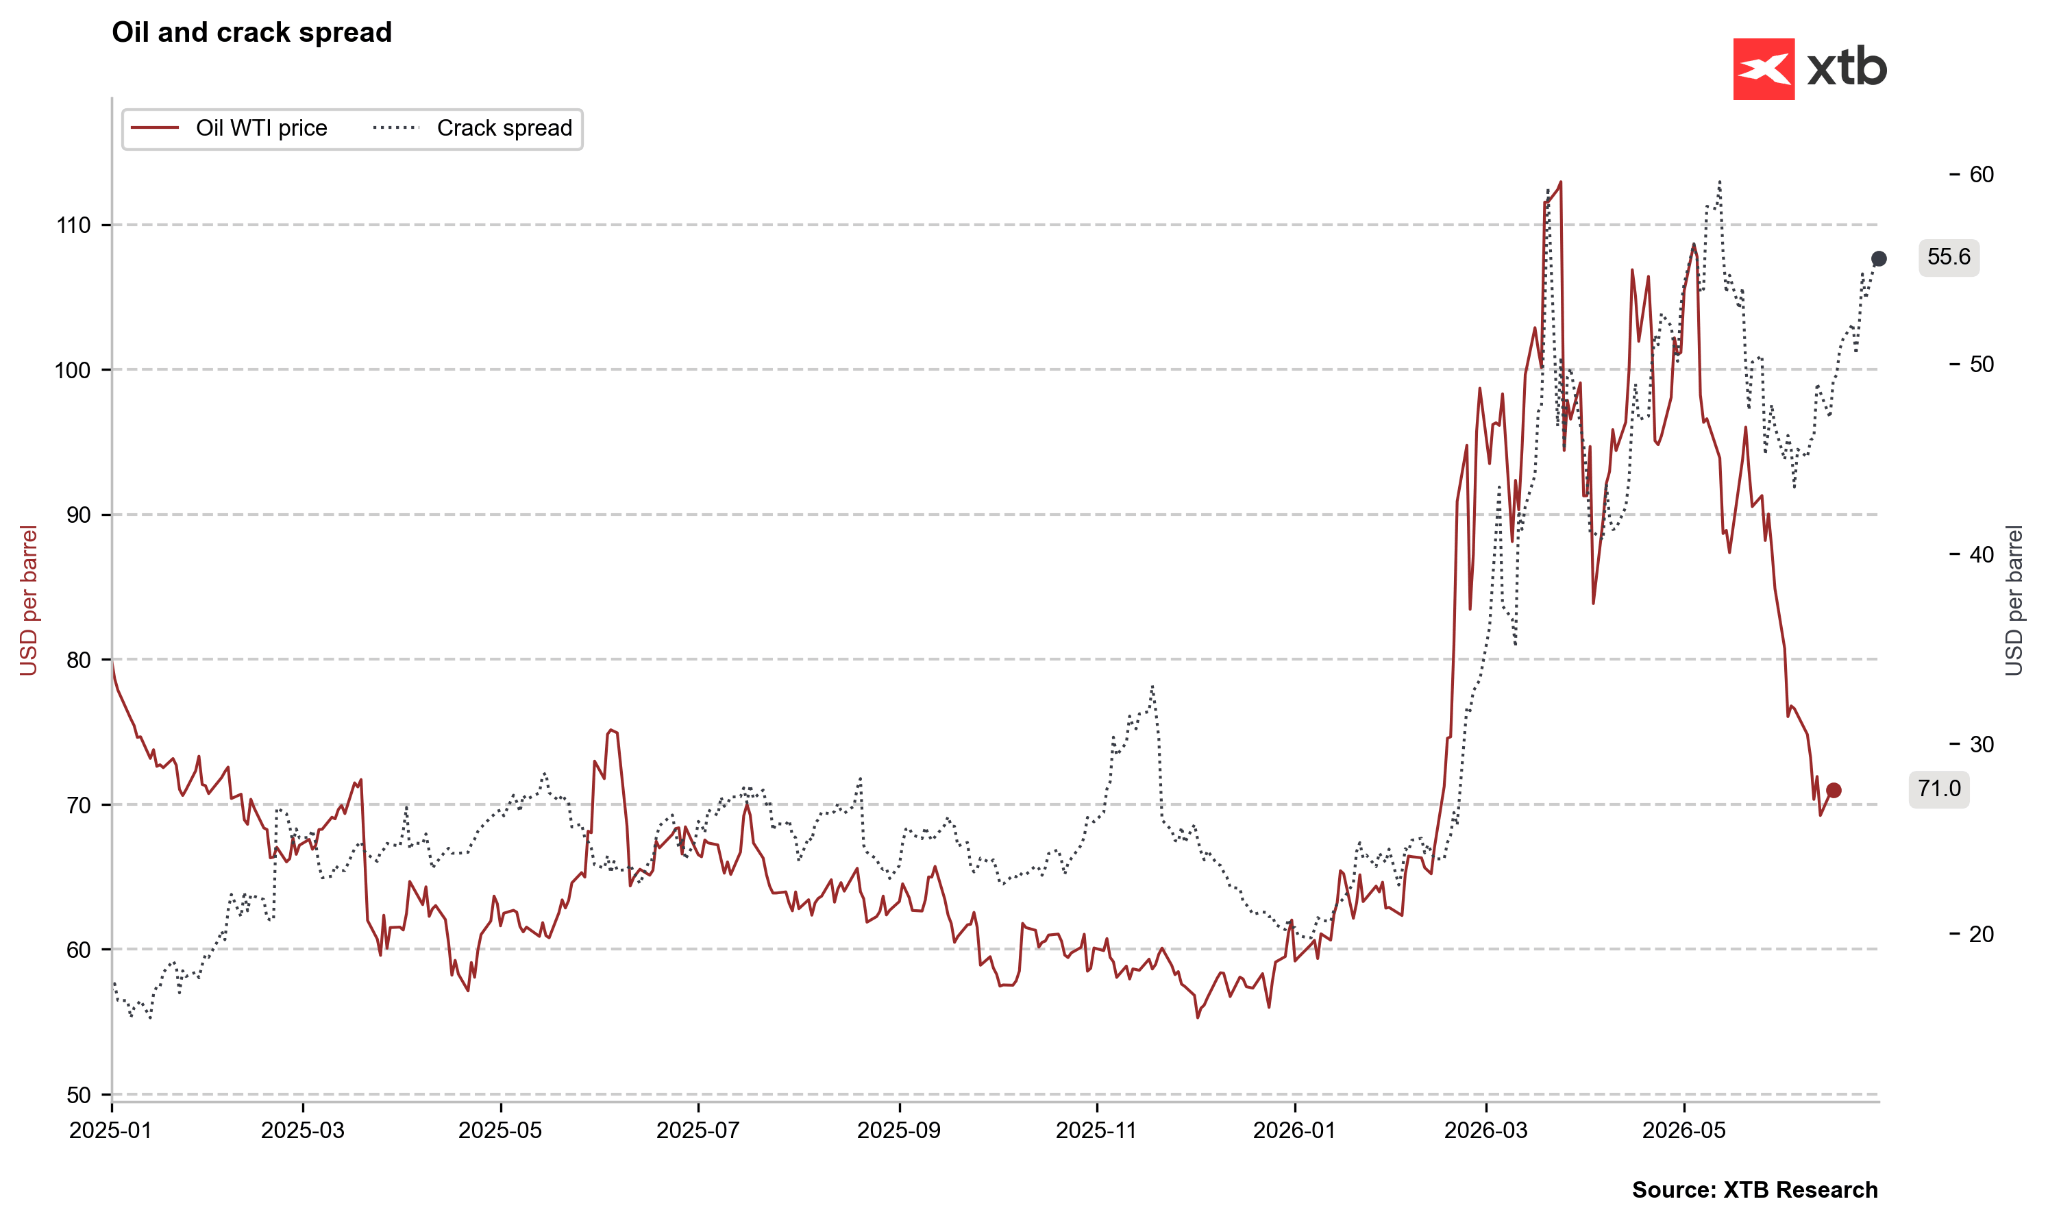
Despite the fall in oil prices, the crack spread remains at an extremely high level. On one hand, this may be related to the driving season, and on the other, to a fuel shortage in the market. Source: Bloomberg Finance LP, XTB
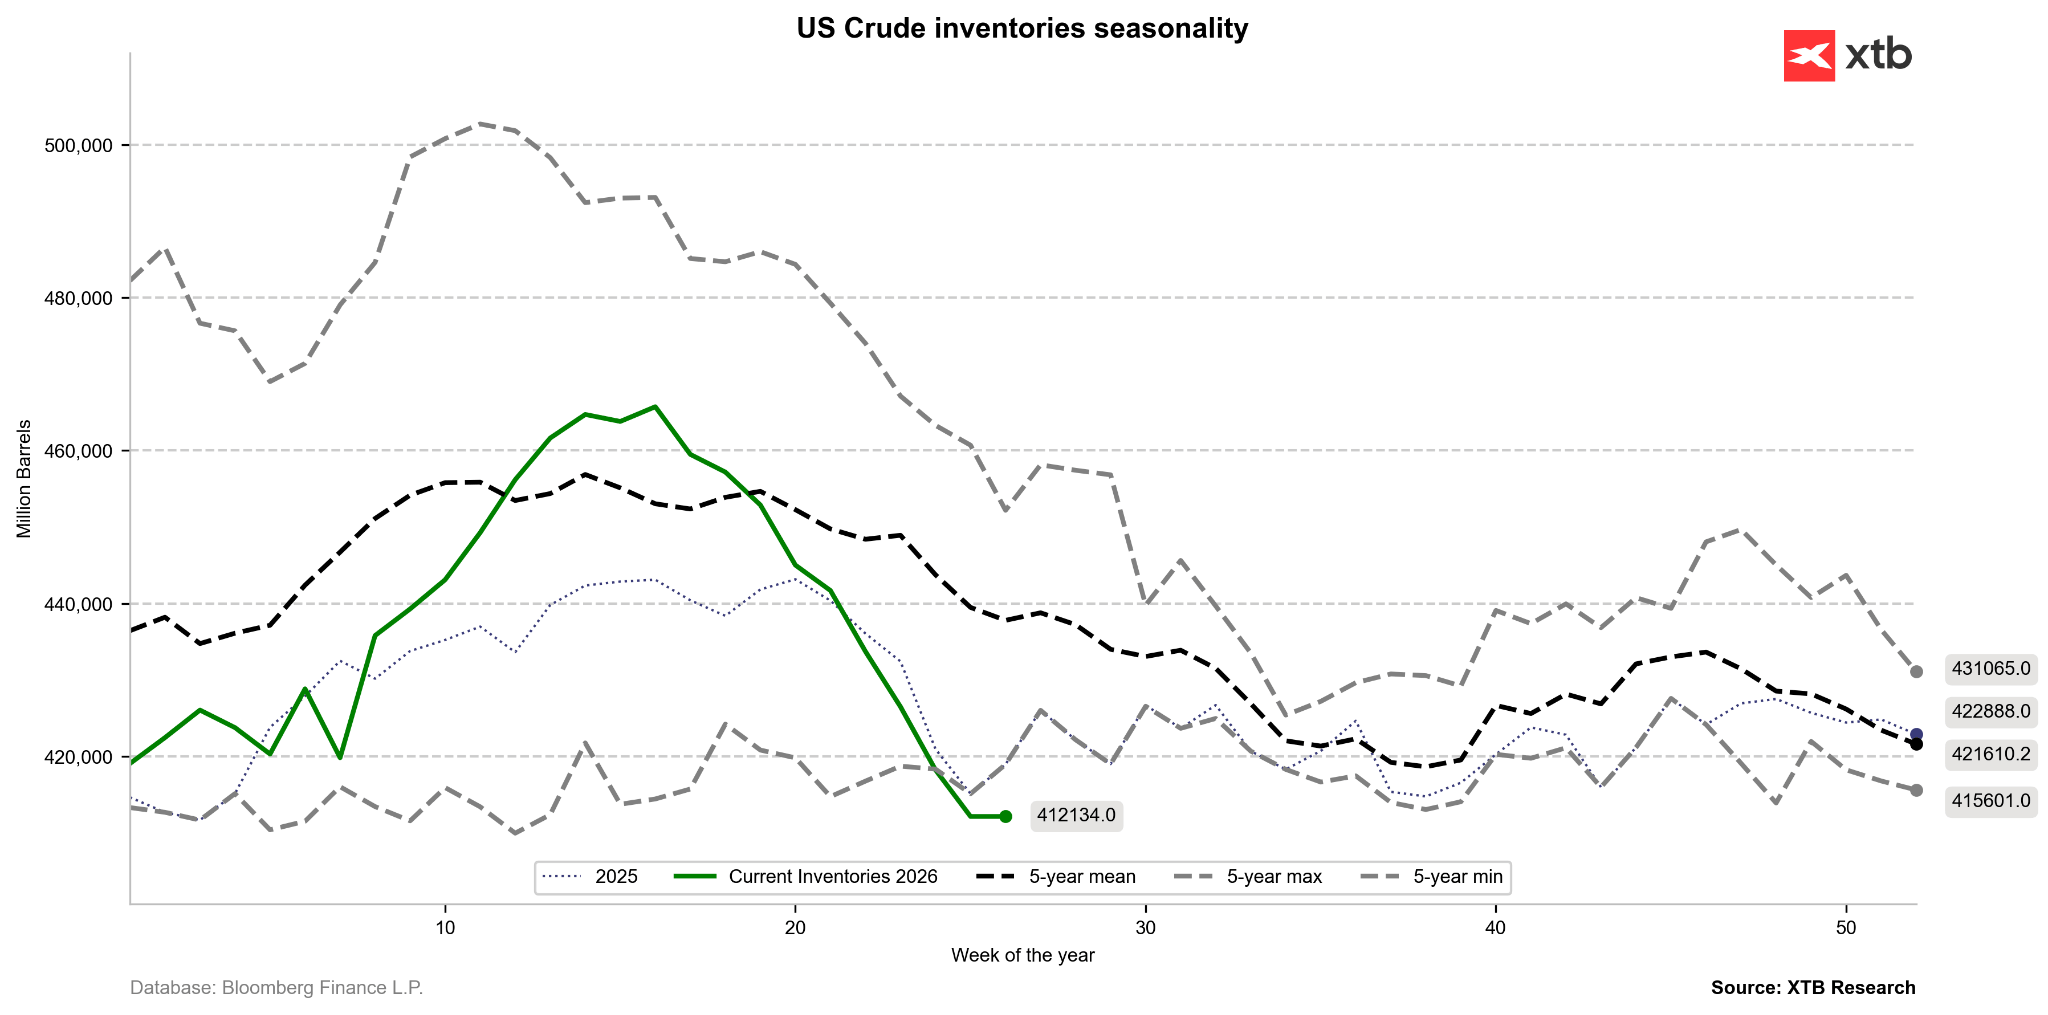
Crude oil inventories have fallen to levels lowest in over 5 years, and the scale of declines in recent weeks was the largest in a long time. Seasonality continues to indicate a decline, while short-term global crude oil oversupply related to the release of tankers in the Strait of Hormuz could lead to a bounce in inventories, which could pull WTI oil in the short term toward $65 per barrel. Source: Bloomberg Finance LP, XTB
Brent oil has almost fully eliminated the premium that was present in the price since the start of the conflict, obviously excluding futures contracts. Source: Bloomberg Finance LP, XTB
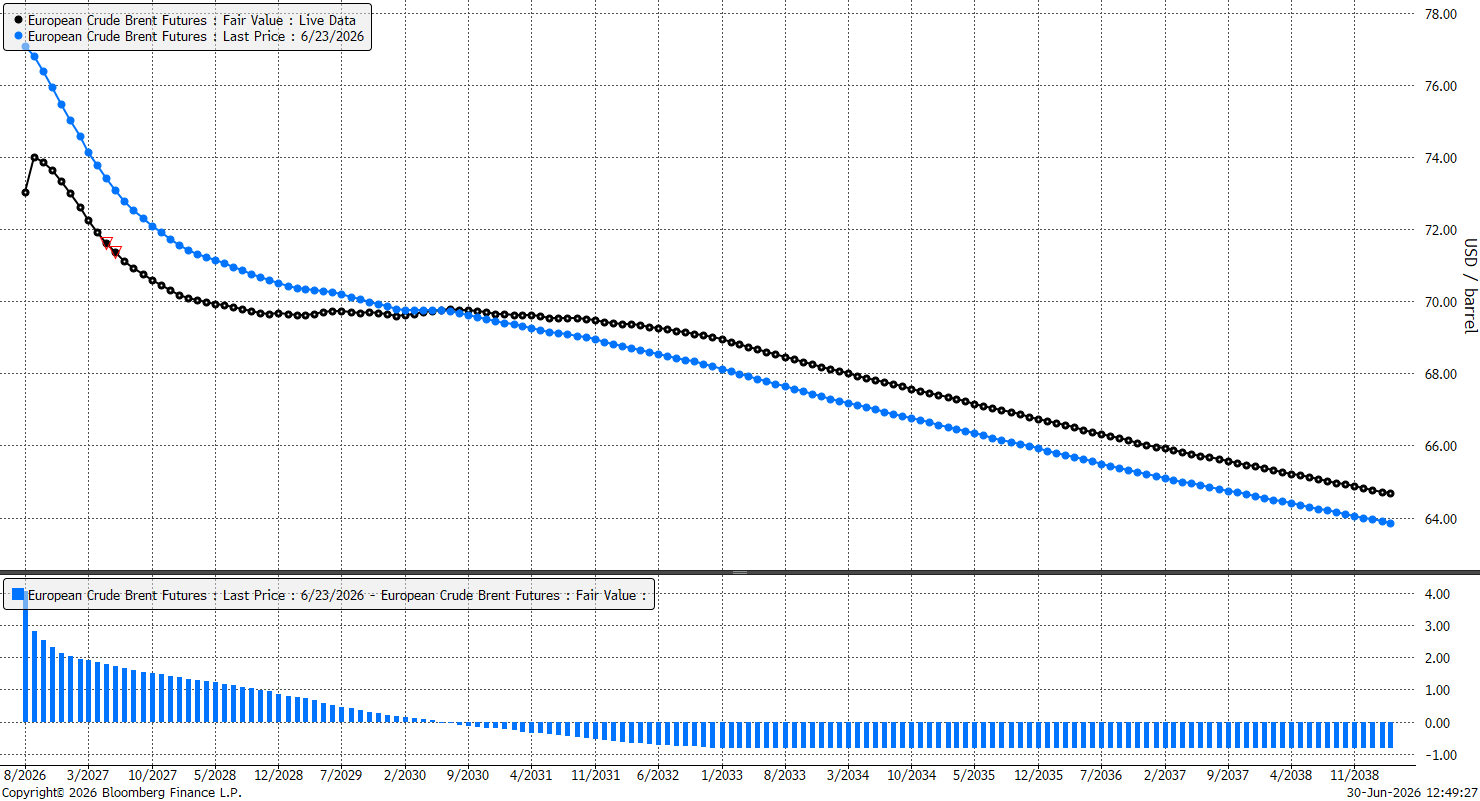
The forward curve remains in backwardation at the short end of the curve (excluding the nearest calendar spread), while in the 2028-2030 period, the curve has flattened and even indicates a slight contango. This is a huge change even compared to last week. Source: Bloomberg Finance LP, XTB
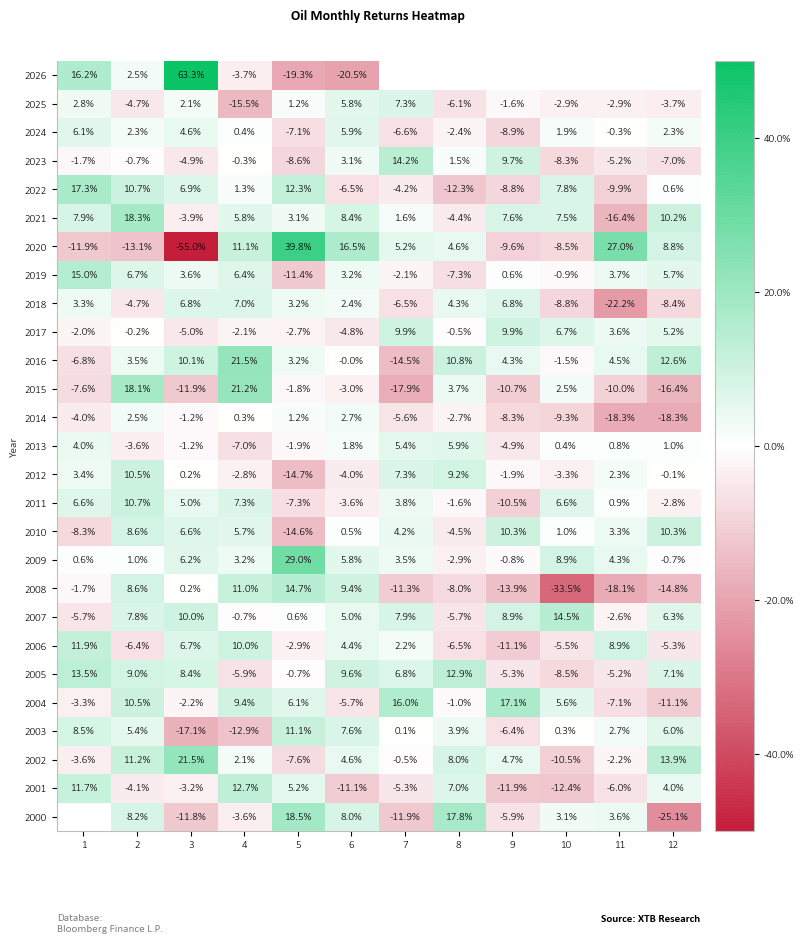
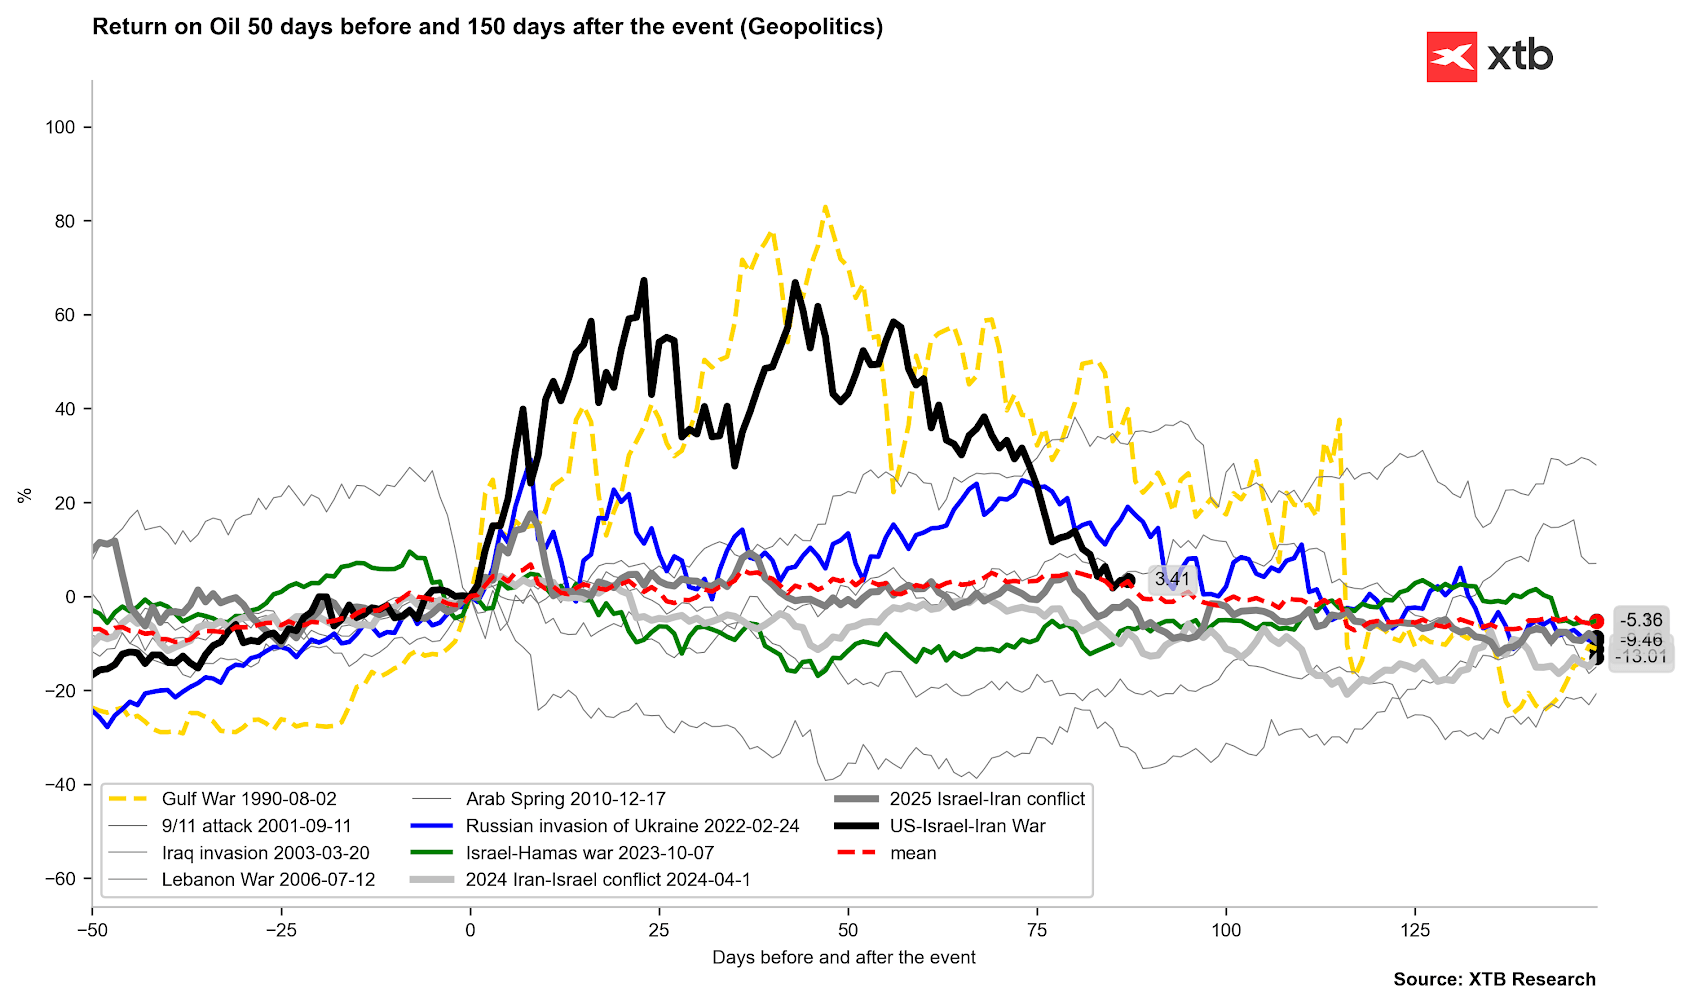
For the second consecutive month, we are observing powerful price drops in the crude oil market. Previous such strong declines took place in 2008 or 2014. It is worth noting that the market expects another strong oversupply, so a continuation of downward pressure cannot be ruled out. Nevertheless, it will be partially offset by backwardation. After the rollover of contracts, a small pressure to close the gap appears. Source: Bloomberg Finance LP, XTB
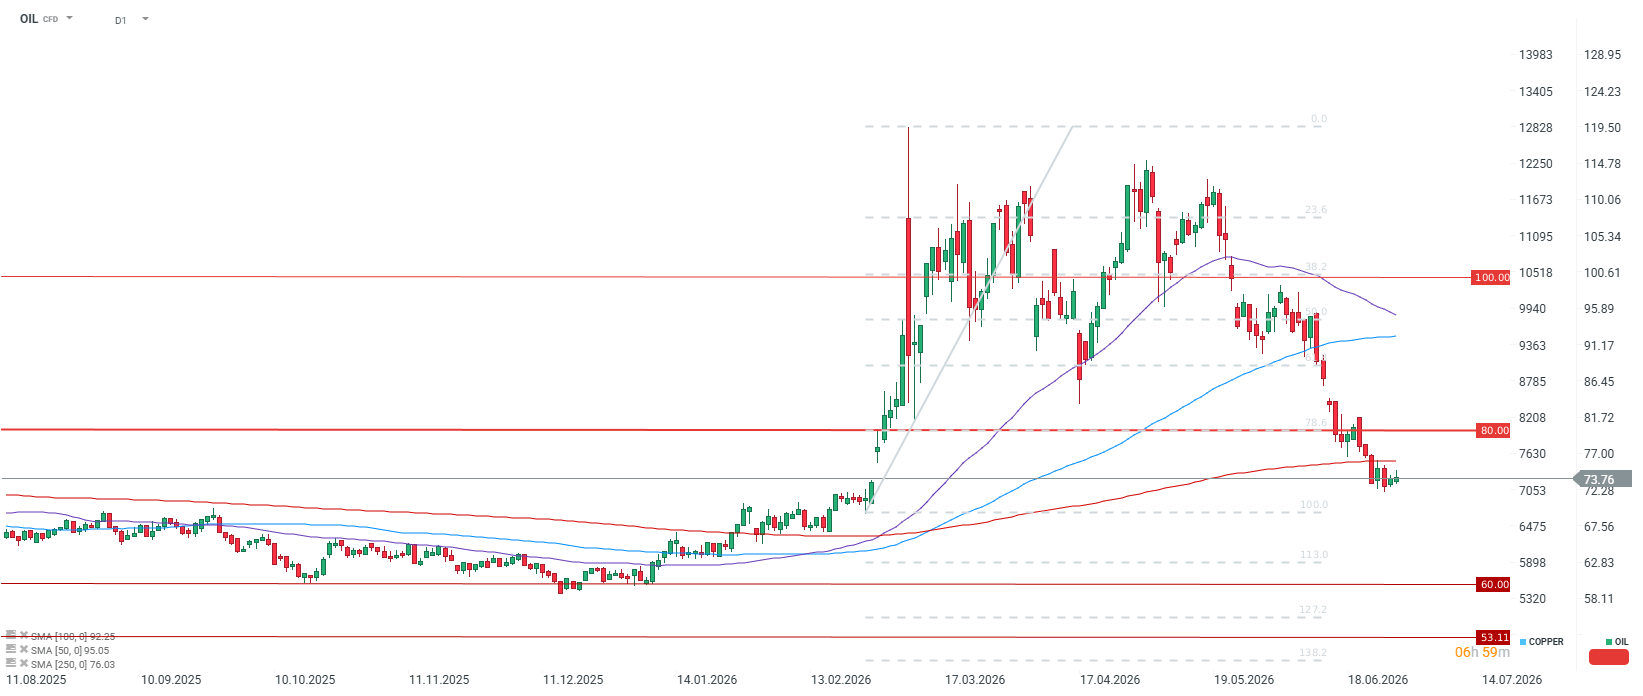
Investors are awaiting the results of the first peace talks between the US and Iran, which are intended to lead to the final end of the war. Short-term resistance will be the 250-period average. Source: xStation5
🪙 Gold
- Consolidation around $4,000: The spot gold price slightly rebounded above the psychological barrier, reaching a level of approximately $4,036 per ounce at the end of June. Since the outbreak of war in late February, however, the bullion has lost about 25% of its value, breaking through key long-term supports, including the 200-day moving average. Since the winter highs (around $5,600 per ounce), gold has been in a downward consolidation trend and the drop from the peaks is about 30%.
- Pressure from interest rates and the Fed: The main factor hampering price increases for precious metals is fear of a hawkish Federal Reserve policy. Although energy prices (oil) have fallen significantly, persisting high inflation in the US is prompting investors to bet that the Fed will maintain interest rates at a high level for a longer period or perform a hike at the end of this year. Such a scenario supports bond yields and the dollar (the Bloomberg Dollar Spot index rose to highs from mid-2025), which weakens non-yielding gold.
- Fed independence defended: The US Supreme Court ruled that Fed Governor Lisa Cook can remain in office during a legal dispute with President Donald Trump, who attempted to remove her. This decision strengthened the central bank’s autonomy in the fight against inflation. Nevertheless, if Trump could eventually fire Cook, it could undermine the dollar’s position.
- Technical analysis and sentiment: Investor positioning on the futures market suggests that pressure from bears on COMEX is slowly exhausting, and the $4,000 level defines a strong bottom.
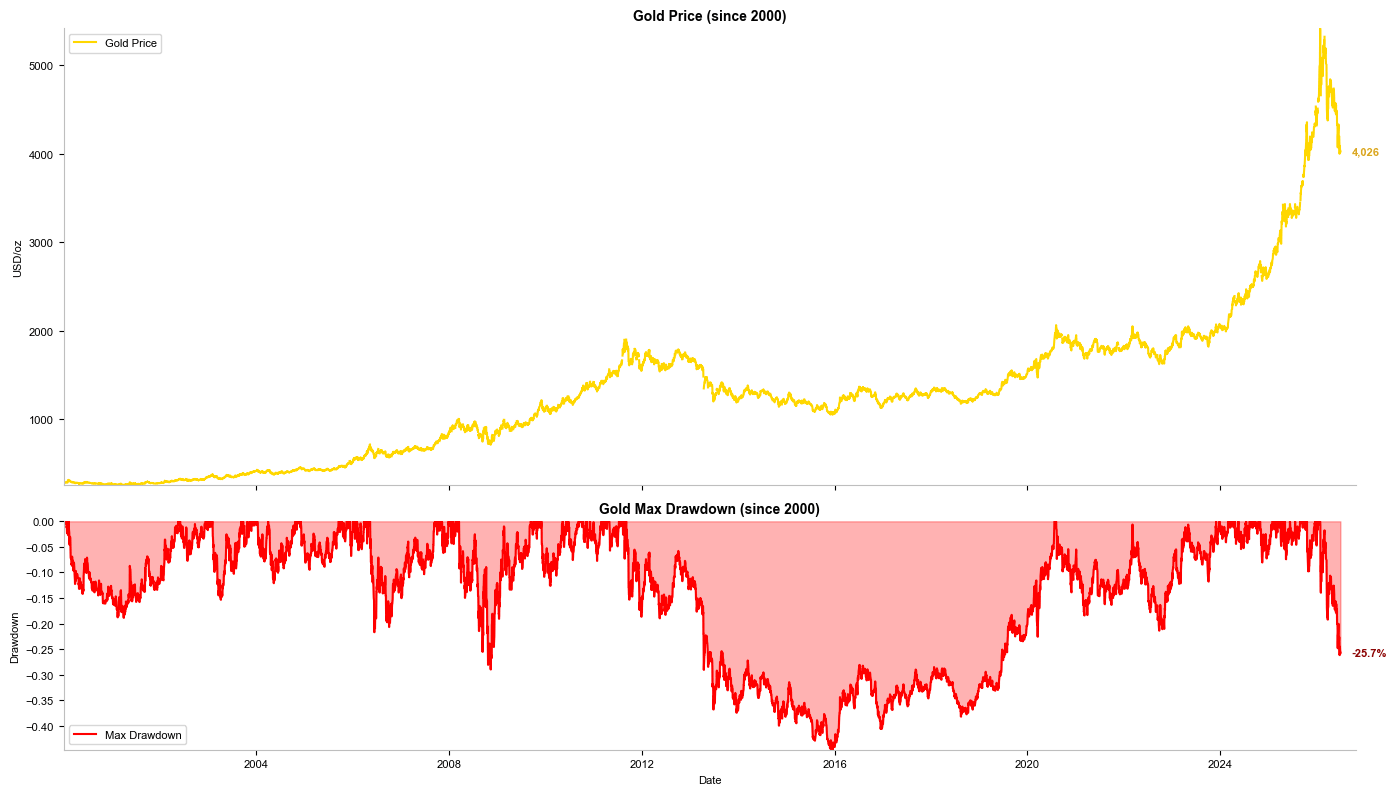
The decline from the peak currently stands at about 25%. A similar situation occurred in 2008 and the price of gold returned to growth fairly quickly, later reaching new historical peaks in 2011, about twice as high as the beginning of the 2008 downward wave. Source: Bloomberg Finance LP, XTB
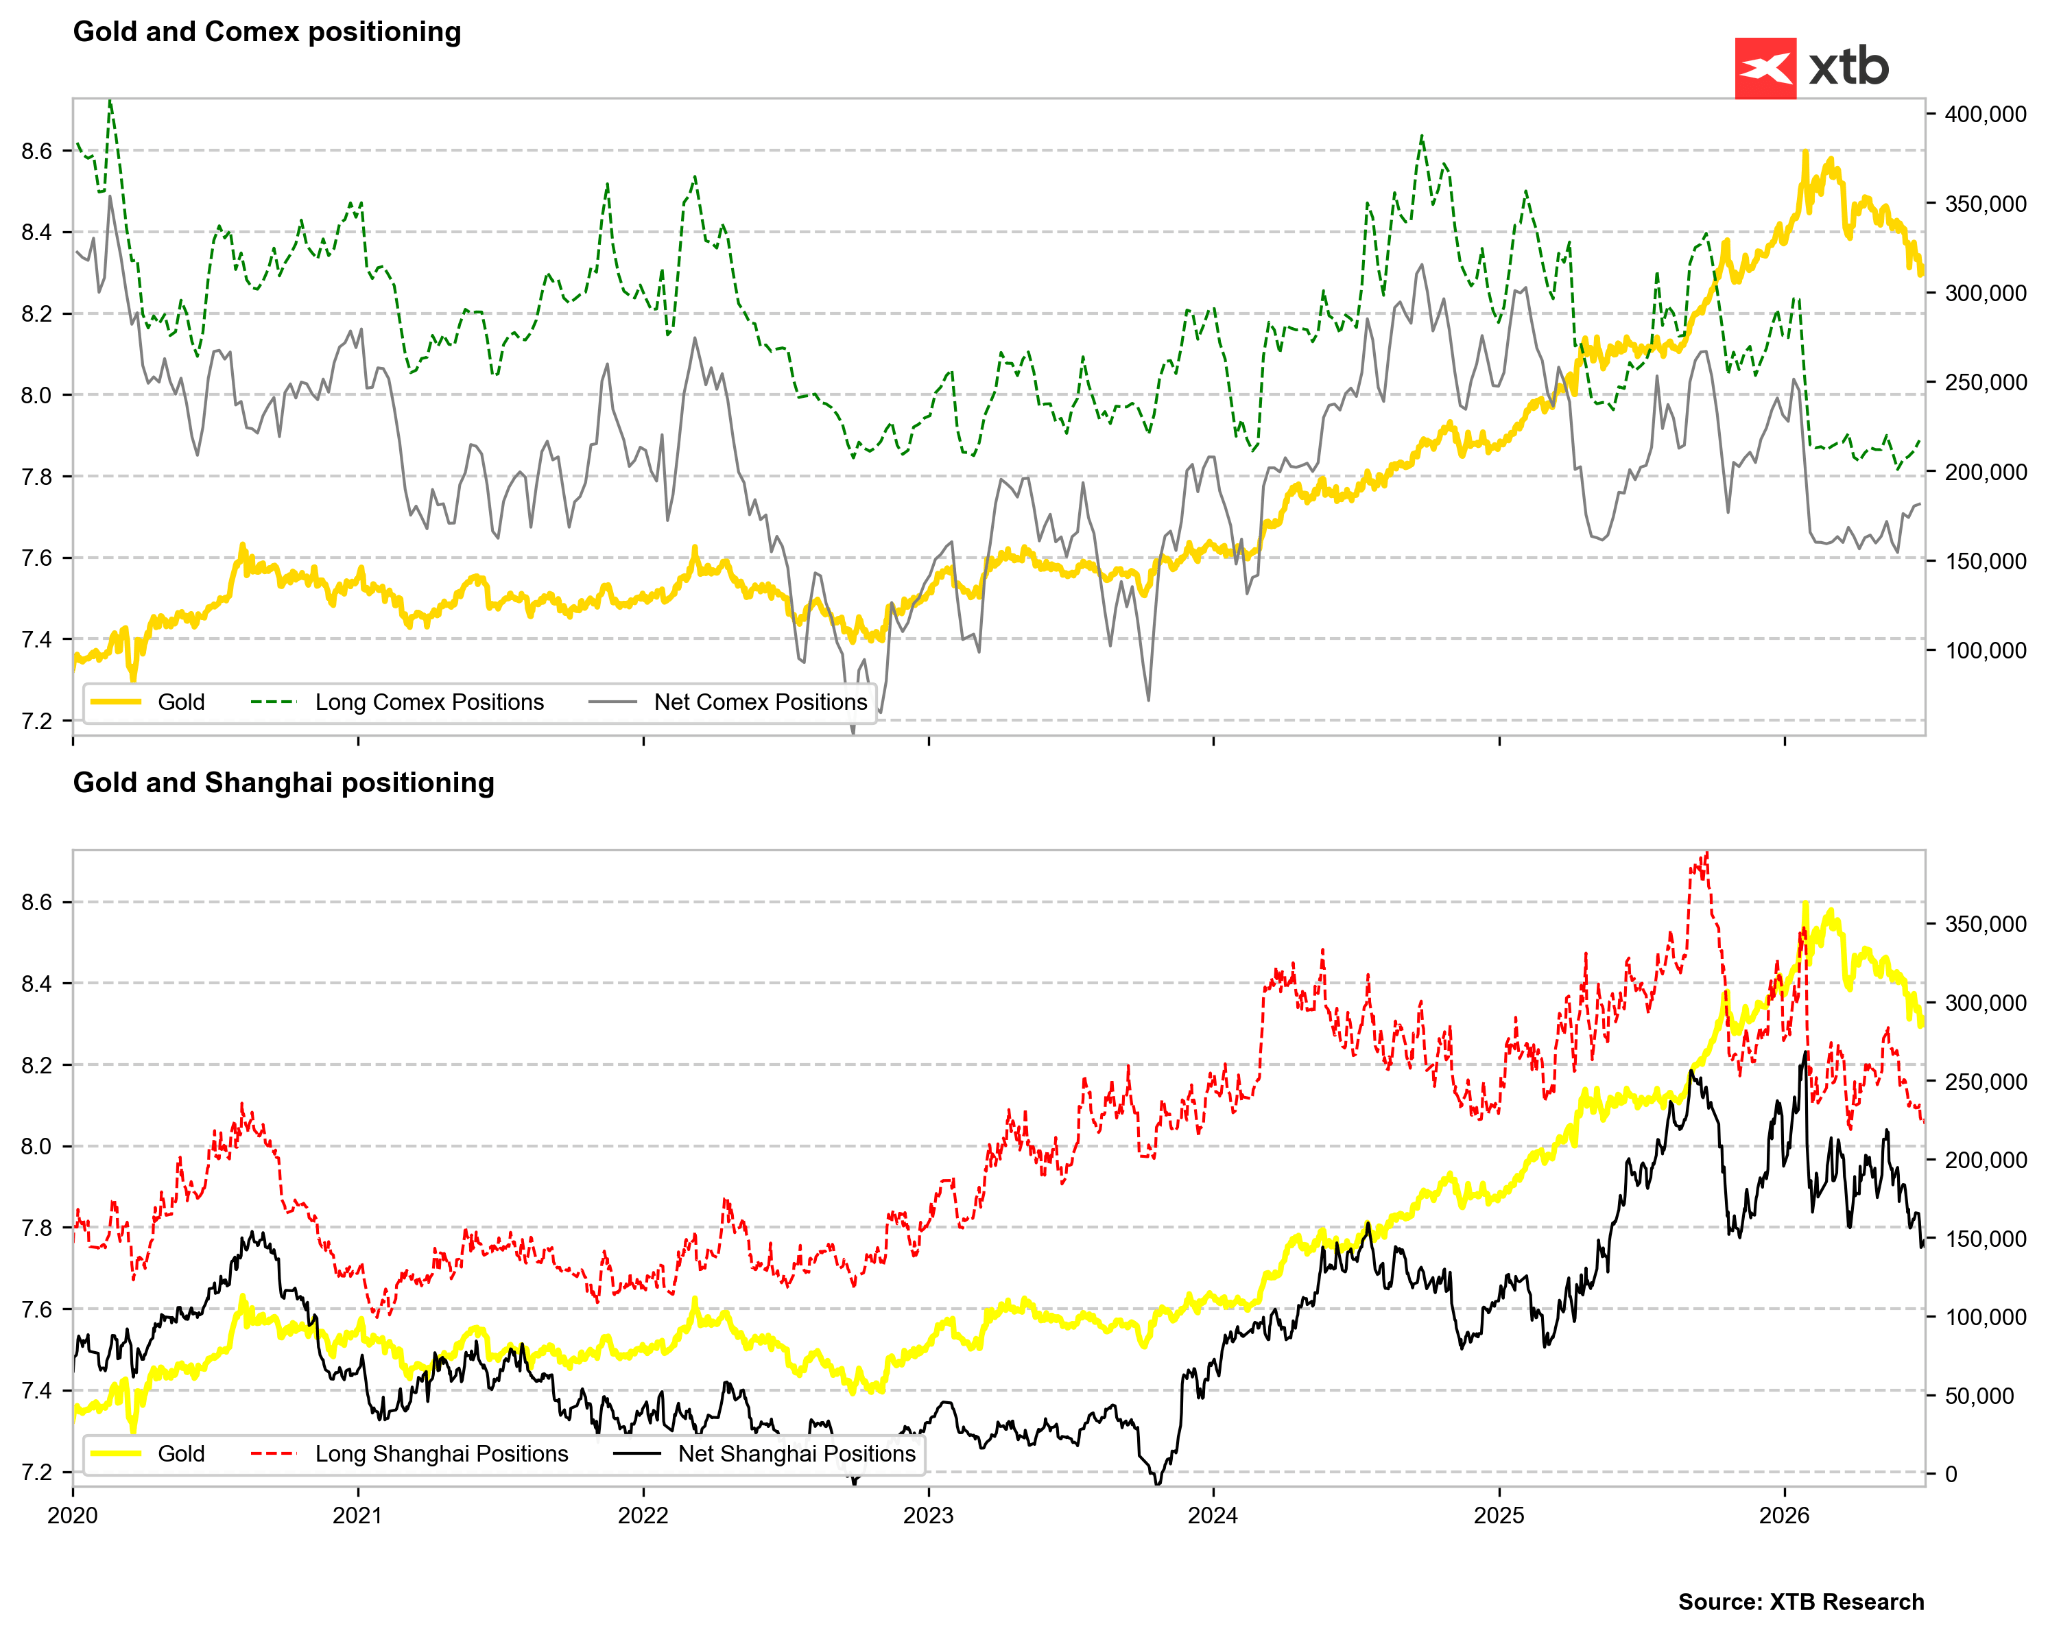
Long positions and net positions are rebounding on COMEX, but we are still observing a pullback in long and net positions in China. Source: Bloomberg Finance LP, XTB
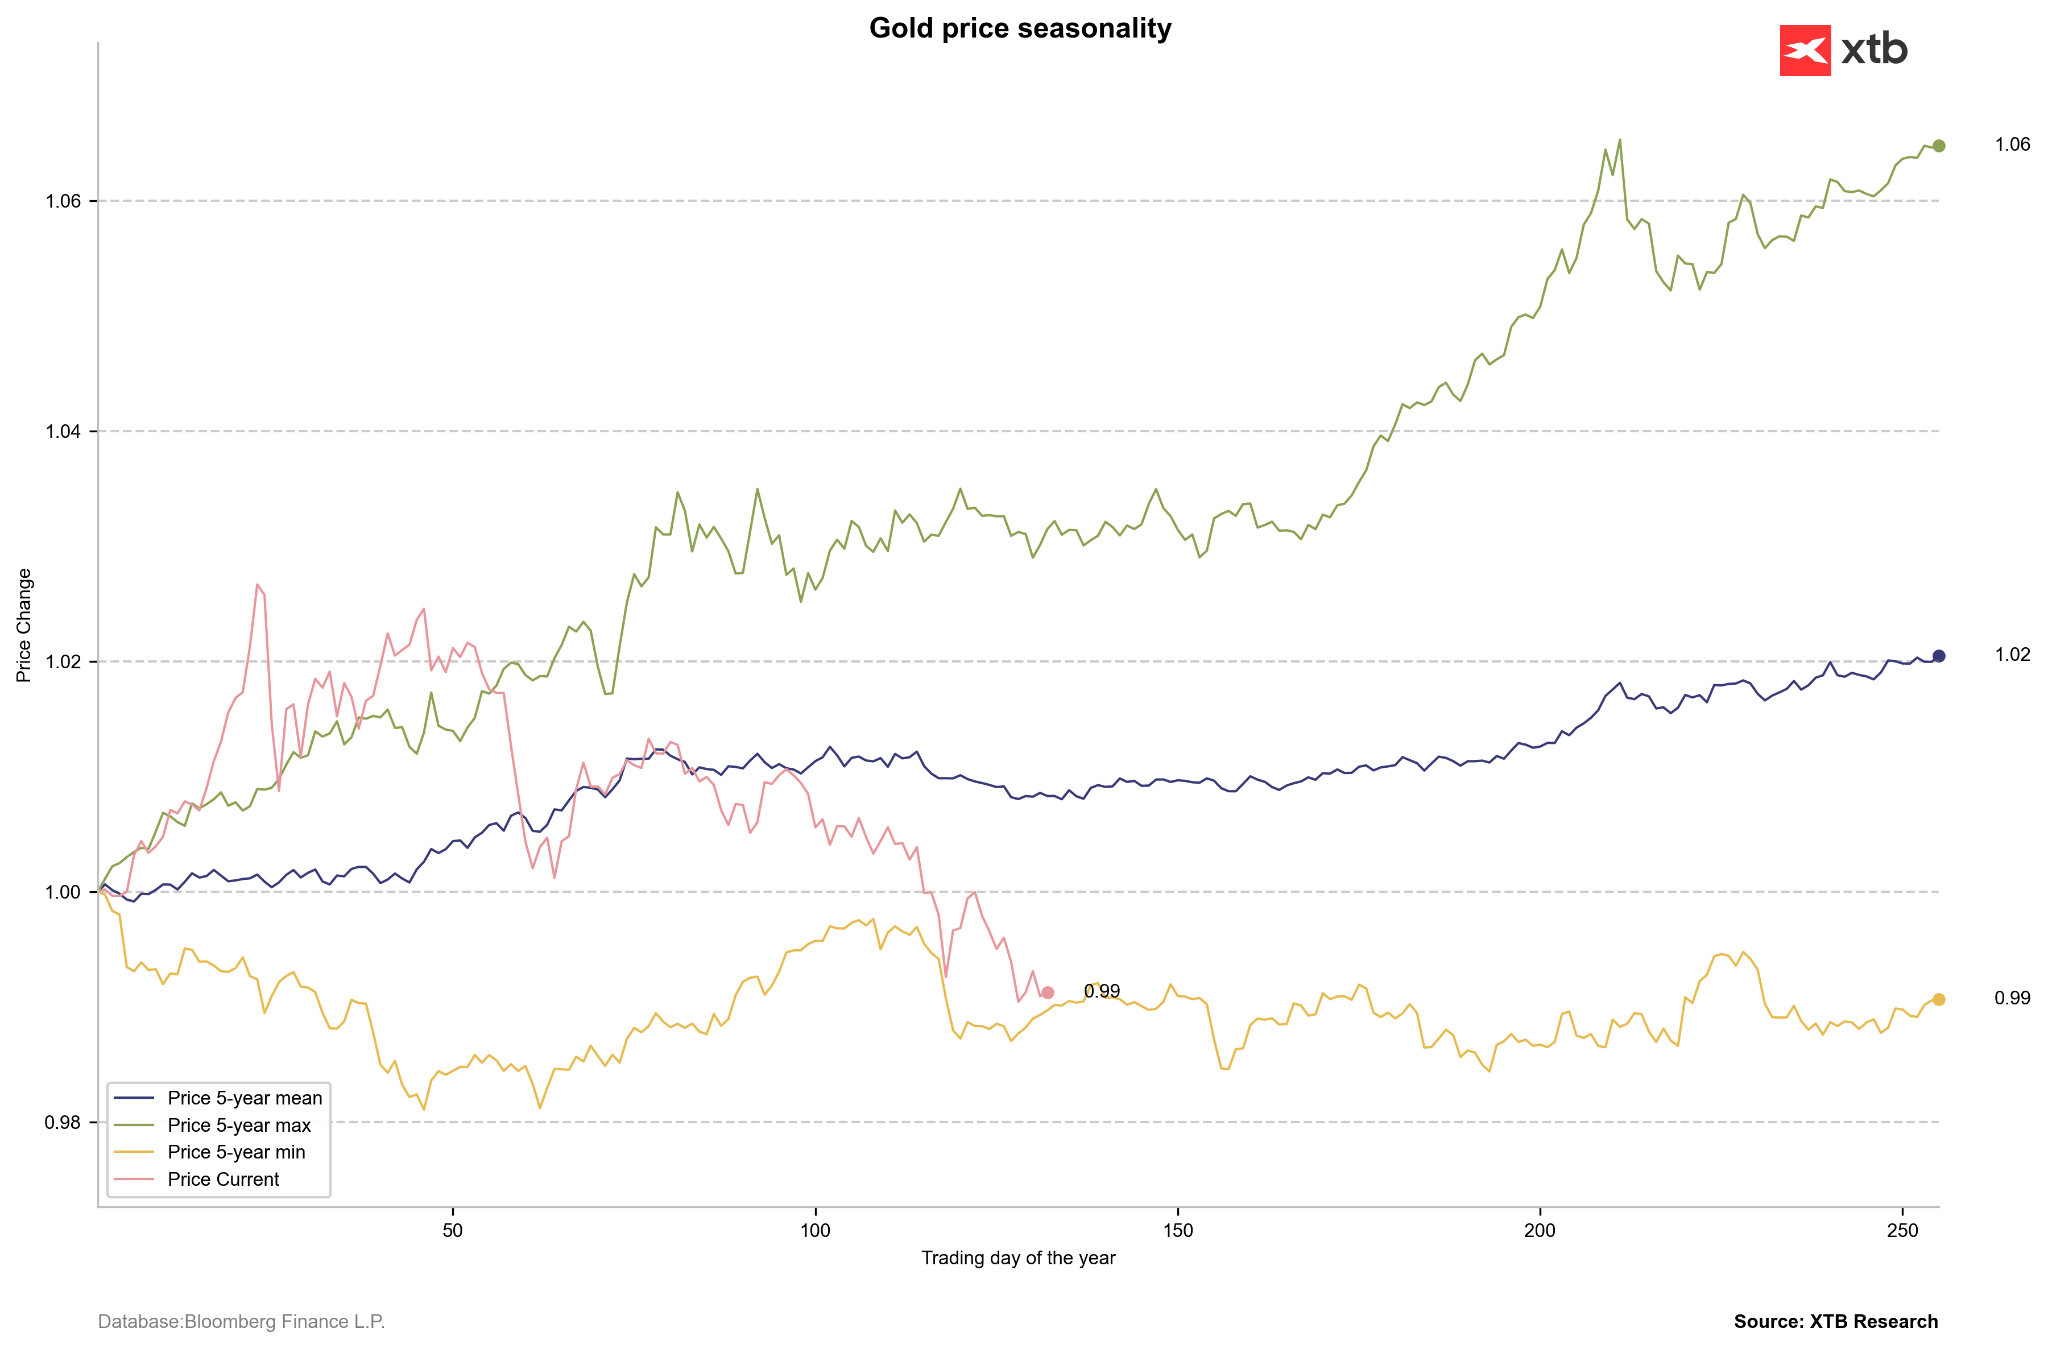
The current drop in gold prices is very close to the largest declines in 5 years. Source: Bloomberg Finance LP, XTB
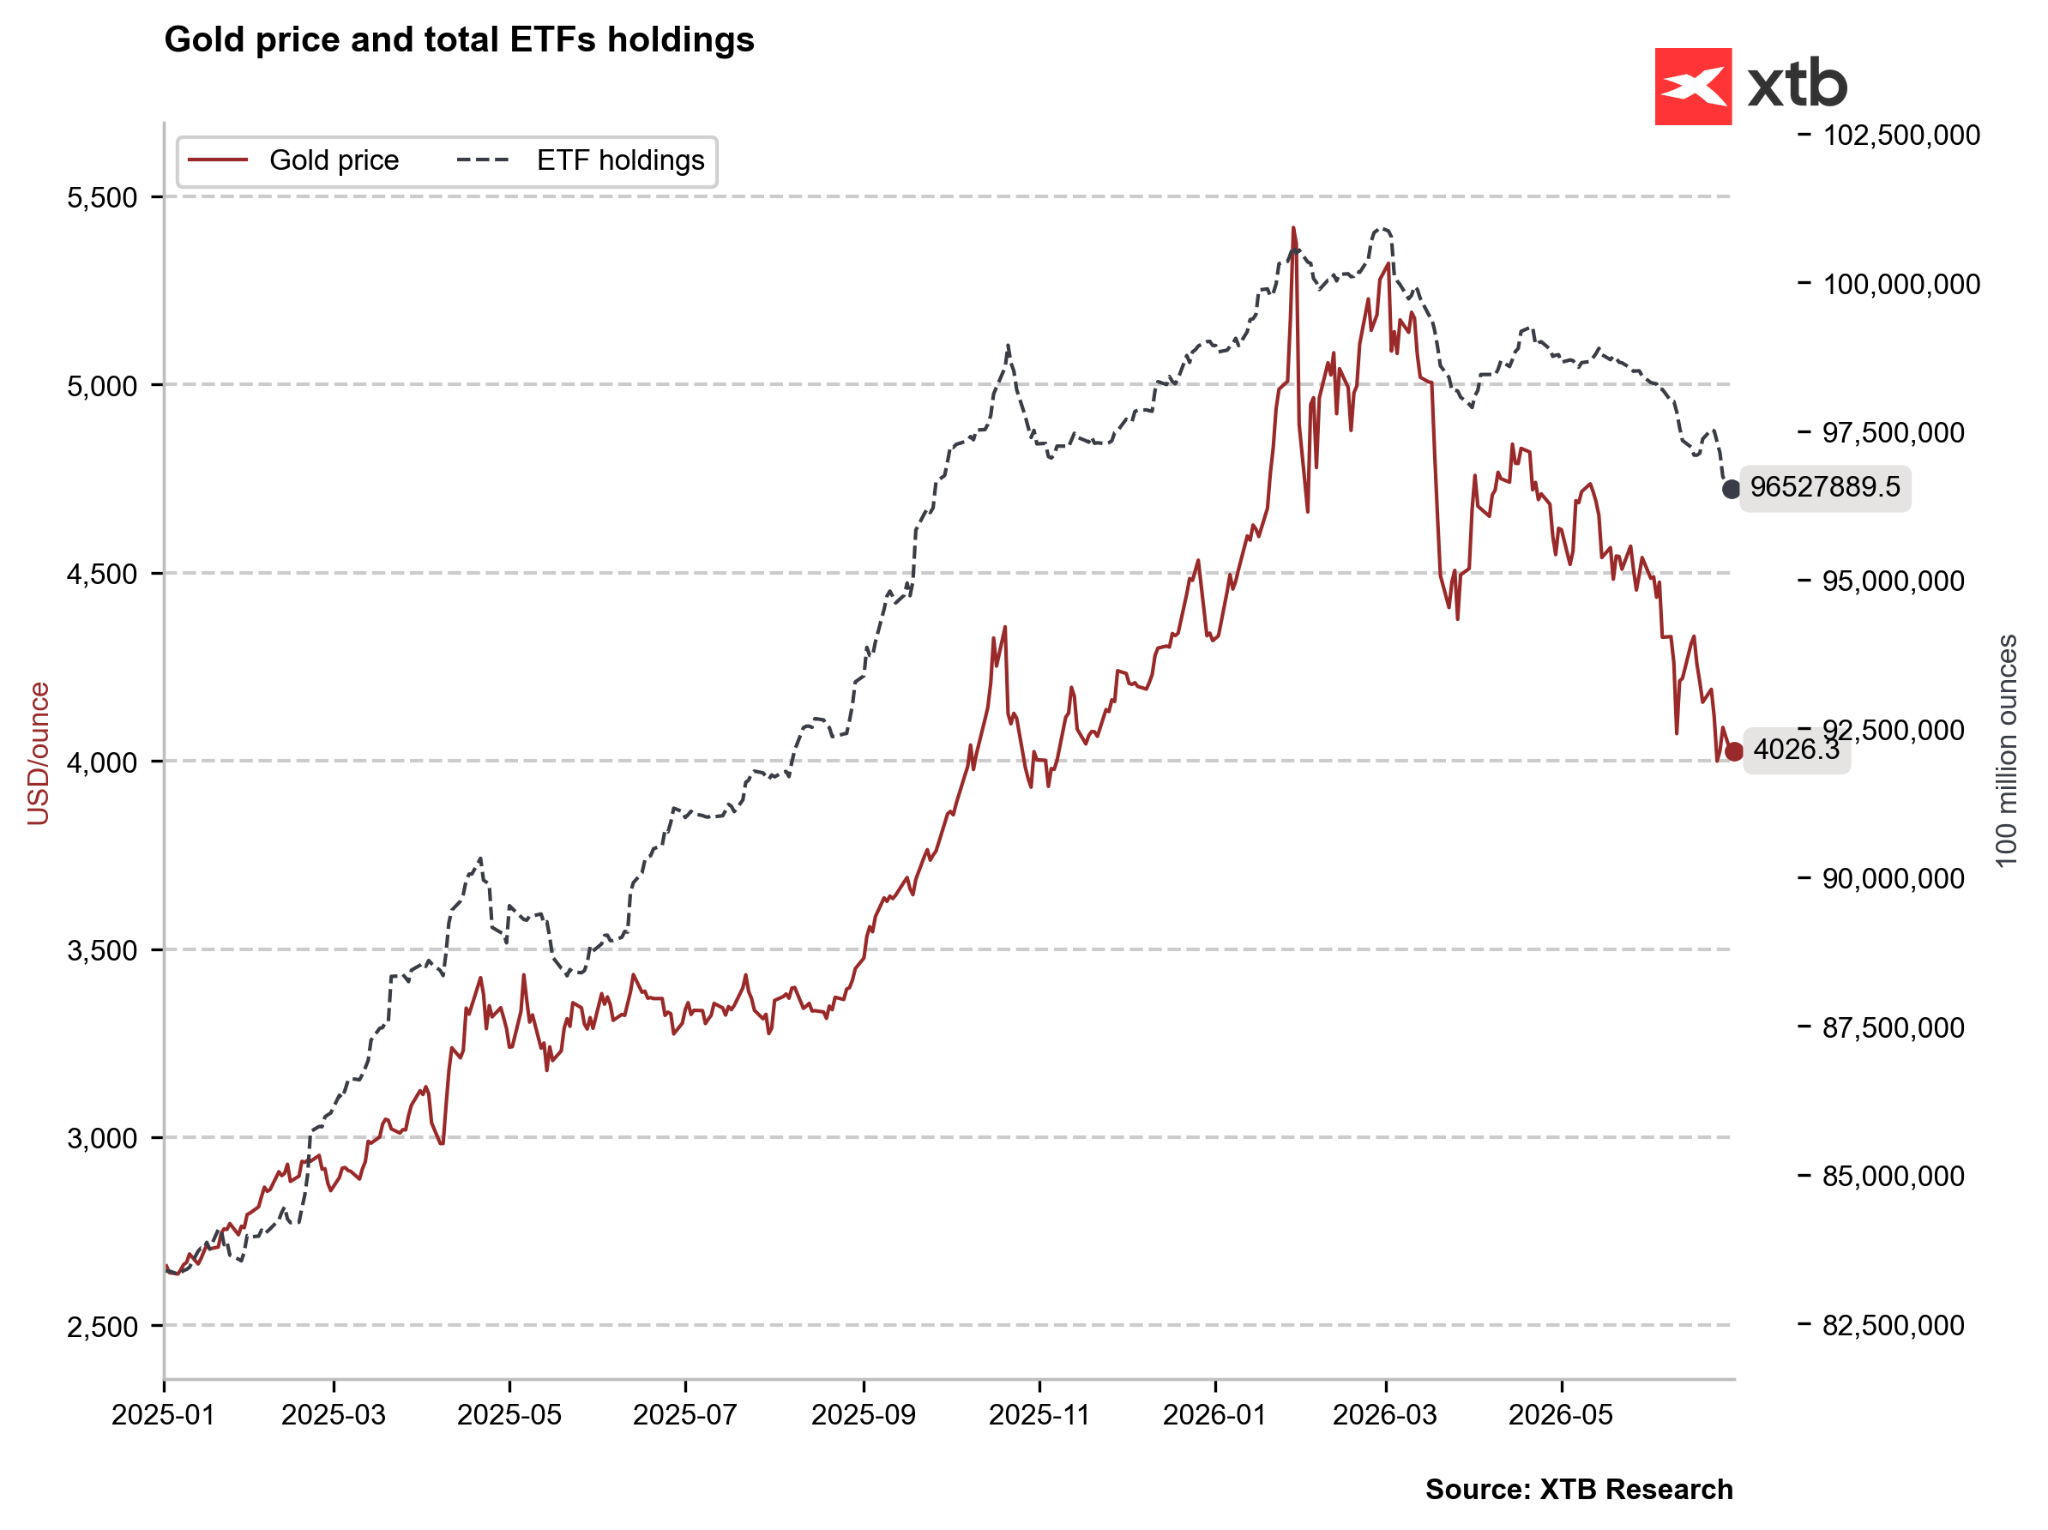
Further capitulation from ETFs continues, although this may coincide with the end of Q2. It is worth noting that in April we observed a rebound in ETFs, so there is a chance that we will see a similar situation in July. Source: Bloomberg Finance LP, XTB
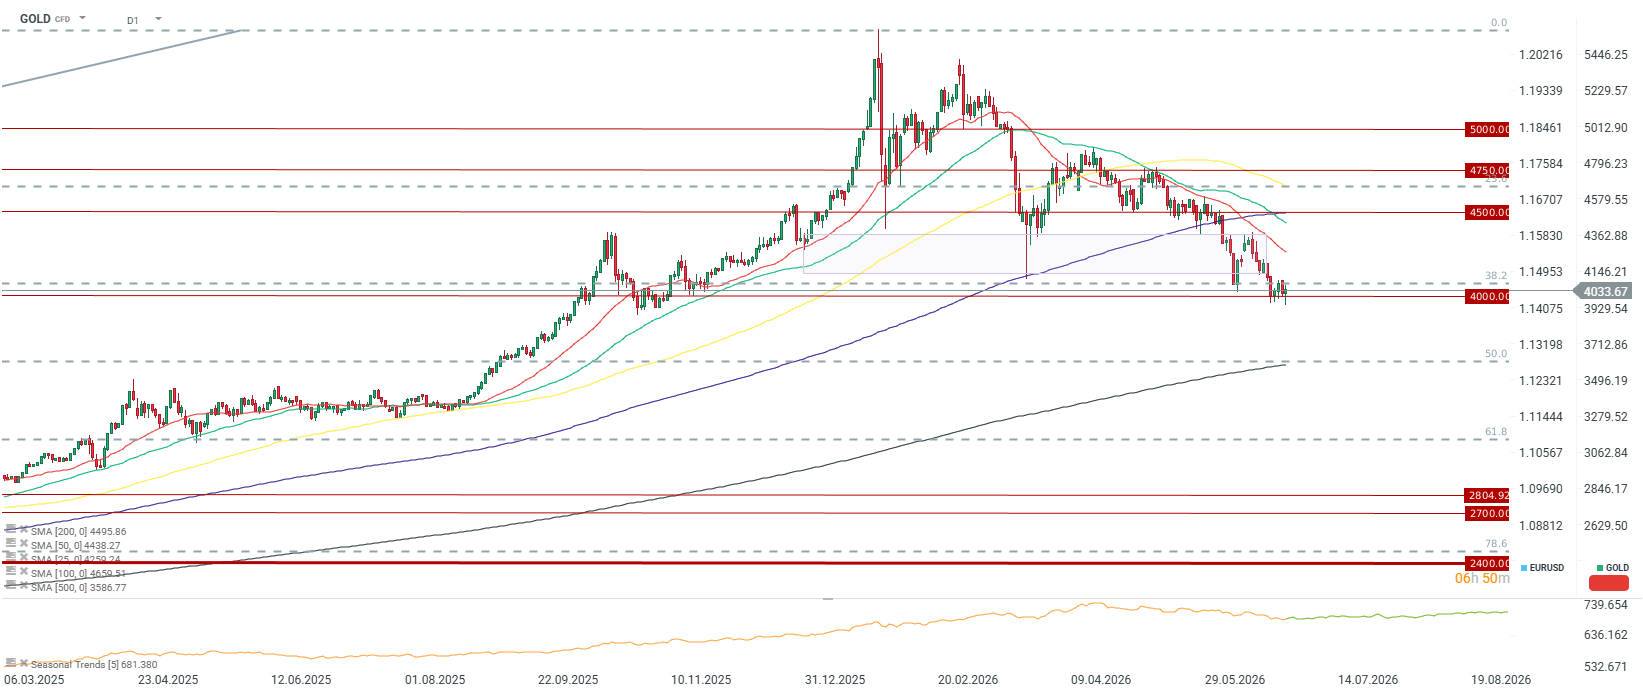
A clear candle shadow appears on the chart on June 30th. If the price closes above $4,000, this may constitute a clear signal of maintaining key support. Source: xStation5
💨 Natural gas (Natgas)
- Weather forecasts boost demand in the US: According to data from the Commodity Weather Group, weather forecasts for the turn of June and July have warmed up sharply. Temperatures significantly above normal are expected in the eastern half of the US and in the Midwest and Northeast regions, which will significantly increase demand for gas from power plants fueling air conditioning systems.
- Correction after the expiration of the July contract: Gas prices on the NYMEX exchange fell from 3-month peaks due to mass liquidation of long positions by investors on the last day of trading for the expiring July contract. Today, however, we are seeing a very strong rebound to levels of 3.3 USD/MMBTU.
- Production and abundance of inventories: Domestic gas extraction in the US (Lower-48) remains very high and amounts to approximately 111-112.5 billion cubic feet per day (bcf/d), which marks an increase of over 4% y/y. The weekly EIA report turned out to be bearish for prices, inventories rose by 76 bcf (above expectations) and are currently 5.7% higher than the 5-year seasonal average, which guarantees full supply to the market before the summer peak. European gas storage facilities were approximately 47% full at the end of June (below the 5-year average of 61–62%). However, we are observing a slight rebound in European gas above 40 EUR/MWh, which may be related to the heatwave in Europe.
- Qatar as a pillar of LNG stability: The Japan Gas Association indicated that Qatar will maintain its position as the most reliable LNG supplier after the end of the war with Iran. For comparison, supplies from producers in Southeast Asia (Malaysia, Australia) were interrupted several times in recent weeks due to liquefaction infrastructure failures.
- Transport risks: Japan emphasizes the need to diversify supply routes. It was pointed out that freight for American LNG could become drastically more expensive if vessels are forced to sail around the Cape of Good Hope due to the unavailability of the Panama Canal. Abandoning American supplies could lead to turmoil in TTF gas (NATGAS.EU) and downward pressure on American gas (NATGAS) later this year.
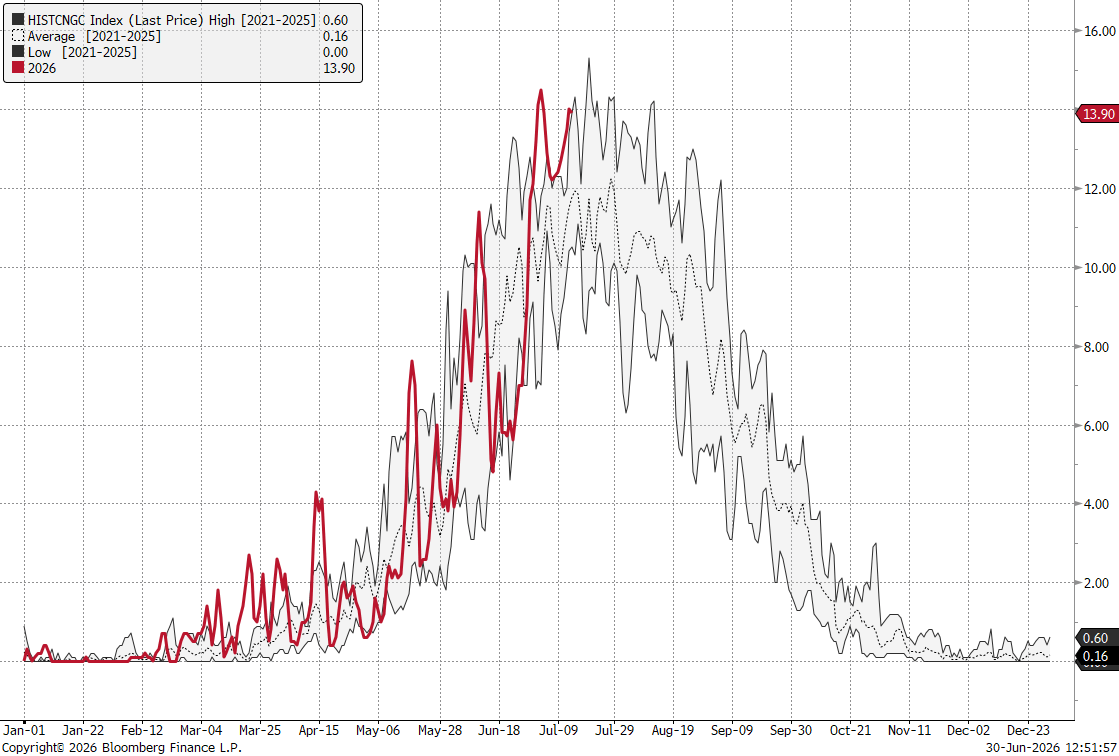
The number of cooling degree days in the US remains around the 5-year maximum, which means high gas consumption. Source: Bloomberg Finance LP, XTB
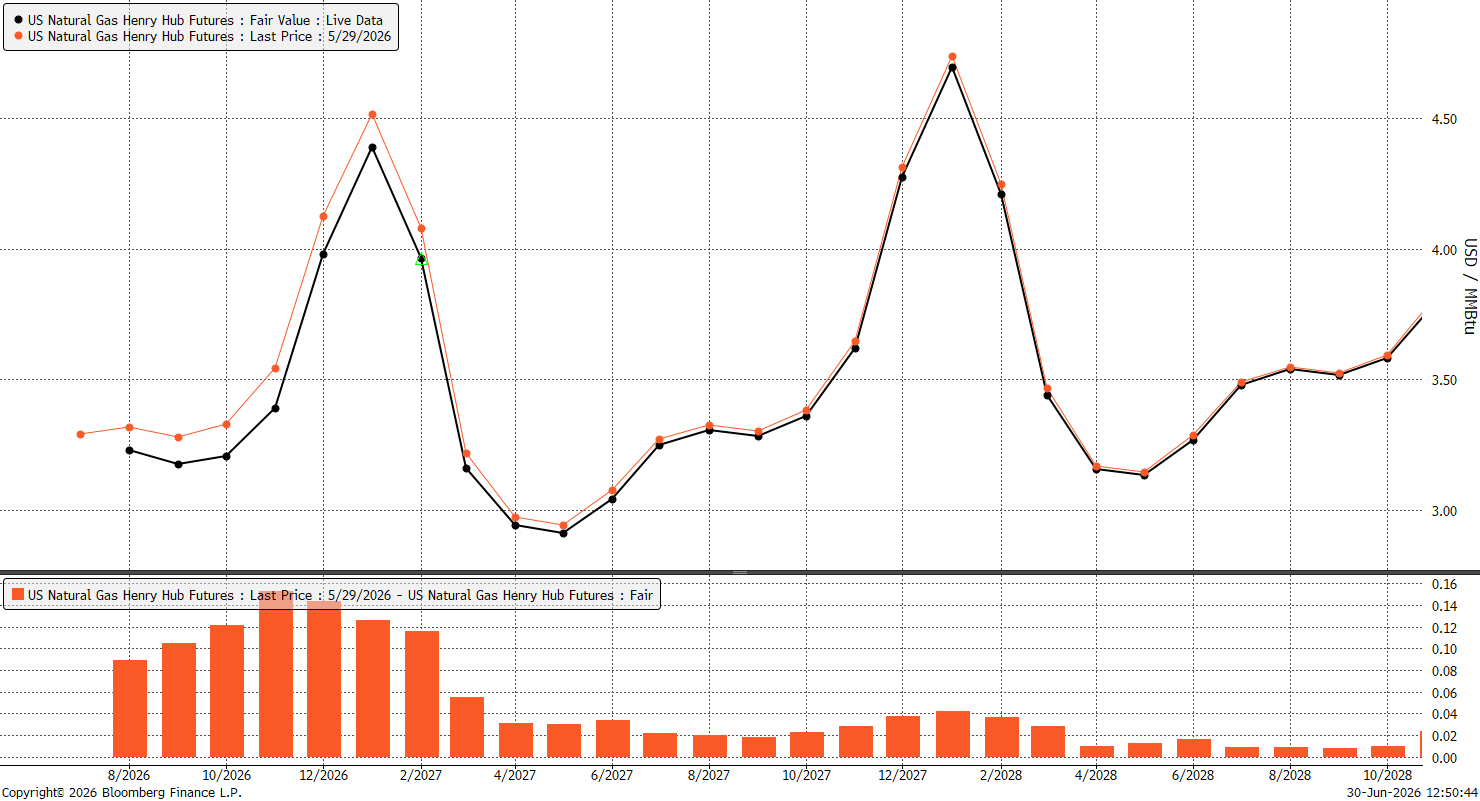
The forward curve has increased slightly recently, primarily for the later period, the beginning of the winter season. Interestingly, the approaching El Niño should cause the curve to flatten, which could mean a decrease in the spread between the current and January (usually the highest) contract. Source: Bloomberg Finance LP, XTB
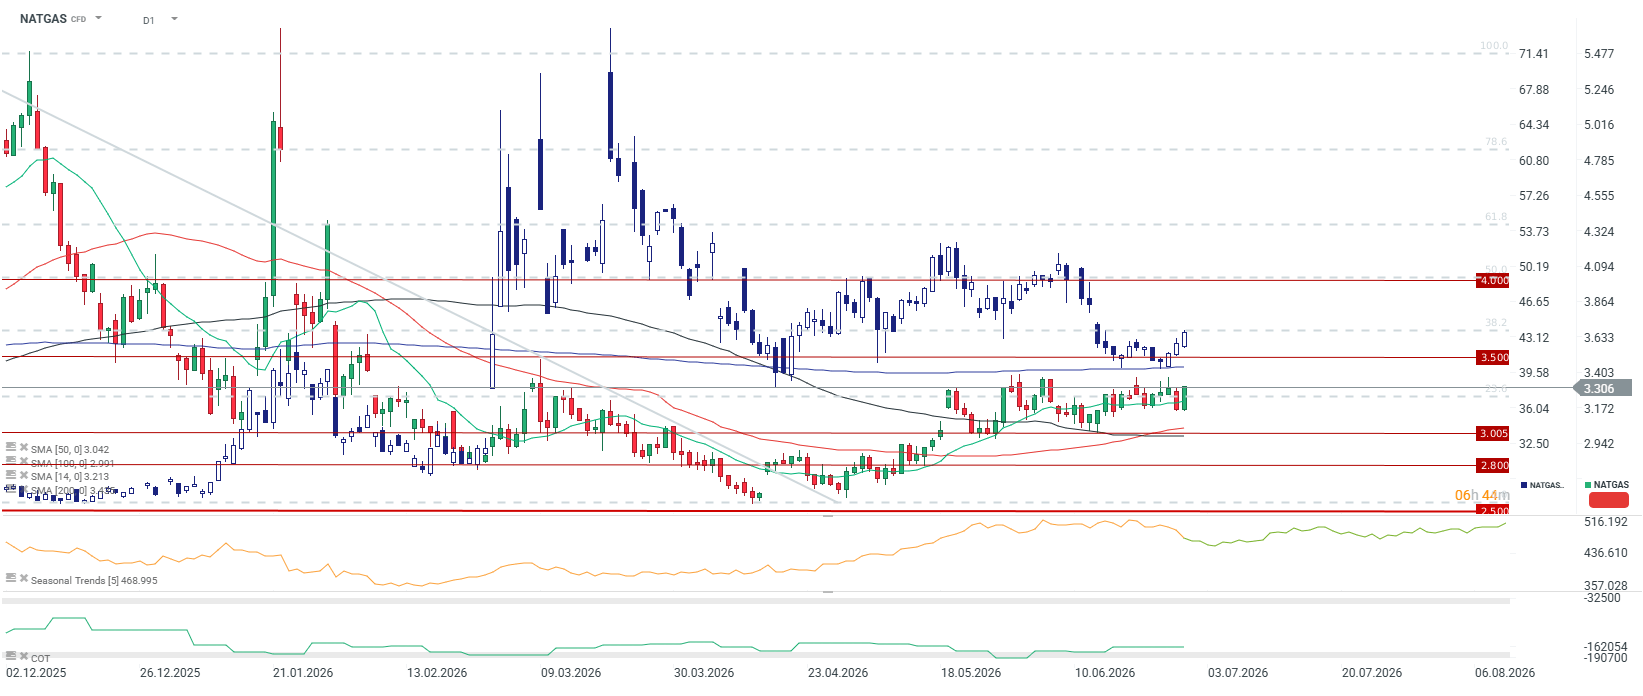
The price of American gas is rebounding, while European gas is traded at the highest levels since mid-June, even despite the restoration of the trade route in the Strait of Hormuz. Reservoirs in Europe remain filled at a low level before the next winter season, and currently increased gas consumption due to the heatwave is observed. Source: xStation5
🍫 Cocoa
- Catastrophic harvest forecasts in Africa: Preliminary field checks by four leading trading houses and analysts have shown that the development of young cocoa pods (cherelles) on trees in West Africa is the worst in decades.
- It is forecast that the harvest in Ivory Coast (IC) in the new season (from September/October) will plummet by about 20% to 1.8 million tons, compared to 2.2 million tons this year. This is a huge drop and even with limited demand, a possible deficit in the 26/27 season is loomimg.
- Destructive downpours and plague of diseases: Above-average heavy rainfall in IC and Ghana in the period from April to June led to flooding of roads and cutting off farmers from their plantations. Farmers are unable to reach trees to apply plant protection products. There is a huge risk of rapid spread of fungal diseases, including black pod rot.
- In Nigeria, this disease has already become widespread, and farmers are losing the battle due to drastically high chemical prices.
- Powerful price increase in New York: Concerns about a drastic drop in supply triggered short covering by funds. Futures contracts in New York rose by about 25% in June. This is the largest monthly jump since the end of 2024, when a supply crisis drove the raw material prices to a historical record near $13,000 per ton. The September contract on the ICE NY exchange (CCU26) closed at over $5,100 per ton.
- Specter of El Niño and structural deficit: The situation of crops in West Africa could deteriorate further if the forecast “super El Niño” intensifies the impact of the dry and hot Harmattan wind around November, destroying the end of the main harvests and the mid-crop in the following year. Citigroup and Marex officially forecast that the global cocoa market will return to a deep deficit in the 2026/27 season.
- Bearish factors: Short-term downward pressure at the end of the month was triggered by information about an increase in May exports from Nigeria by 28% y/y. Additionally, cumulative cocoa deliveries to IC ports in the current marketing season (as of June) were 18.9% higher y/y (total of 1.95 million tons). Furthermore, ICE certified exchange inventories rose to the highest level in 1.75 years (2.92 million bags), which momentarily tones down concerns about an immediate lack of physical grain on the market.
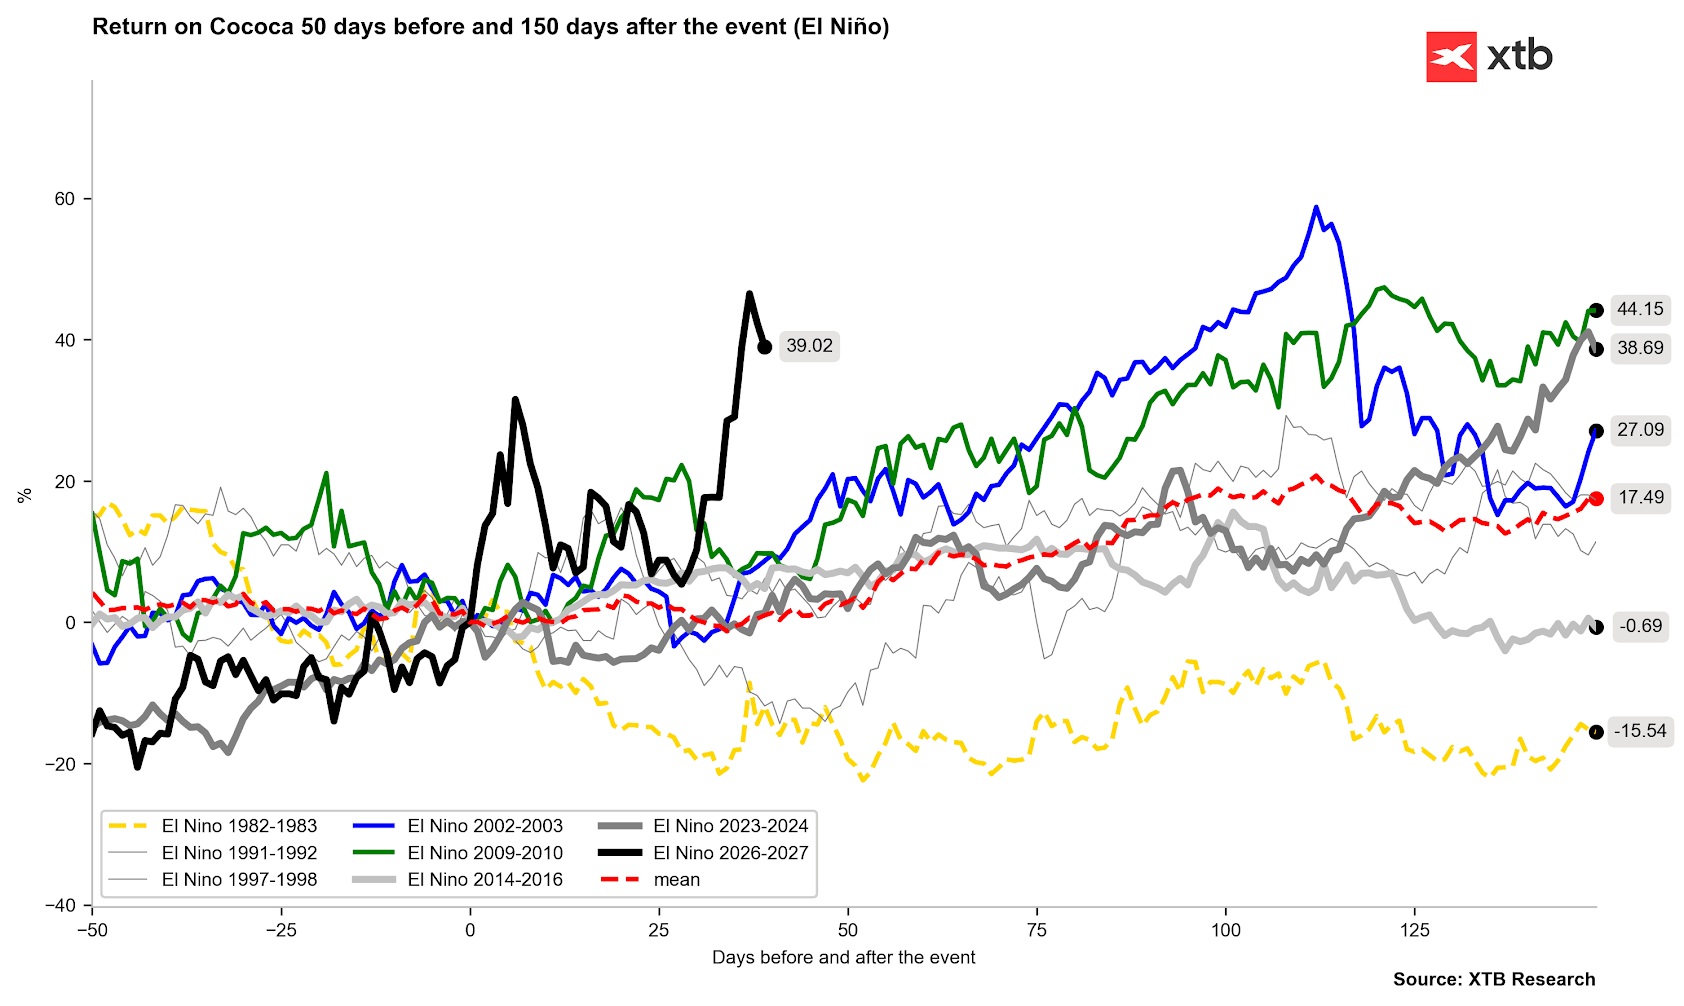
Price increase since the beginning of May, which is usually assumed as the start of upward waves related to El Niño. It is worth remembering that around mid-July we will learn demand data regarding cocoa processing from the most important continents. Source: Bloomberg Finance LP, XTB
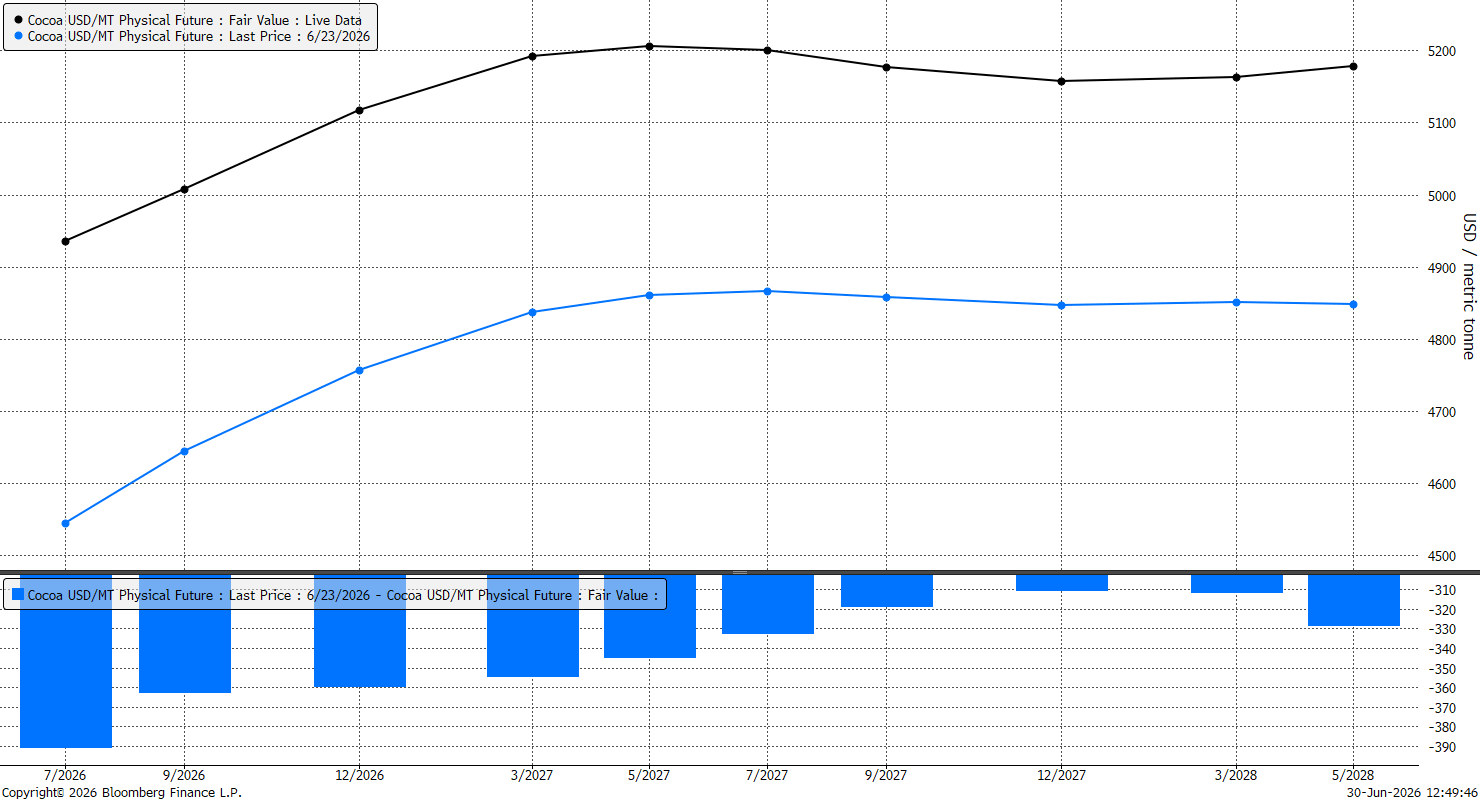
The forward curve is entering a slight backwardation from May next year, which may indicate the appearance of a fundamental change in the cocoa market if production problems actually occur. Source: Bloomberg Finance LP, XTB
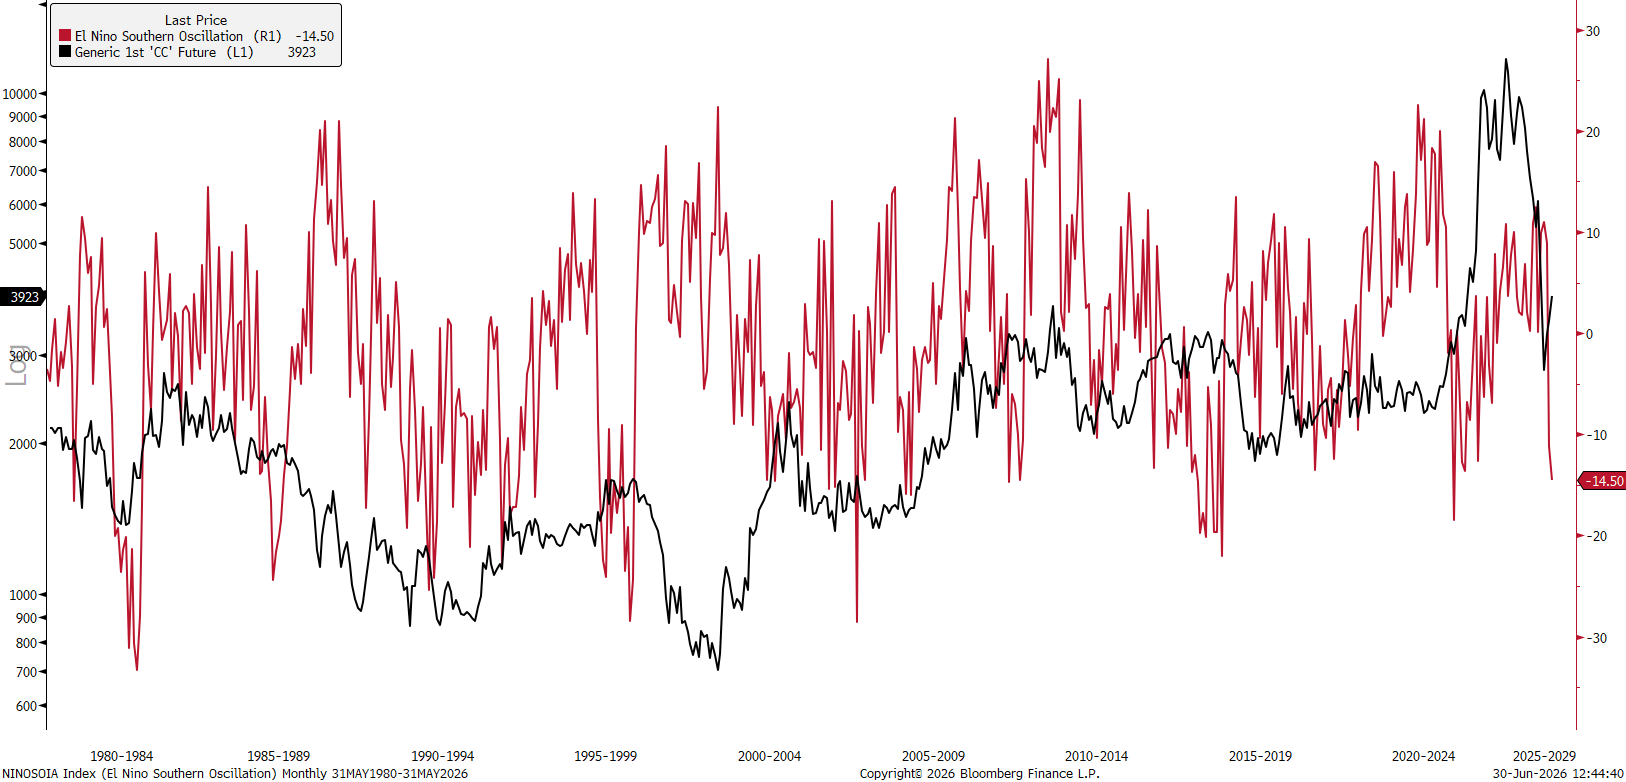
Currently, the El Niño index remains at a low level, but very often a low index was simultaneously a contrarian indicator before a strong El Niño hit. Source: Bloomberg Finance LP, XTB
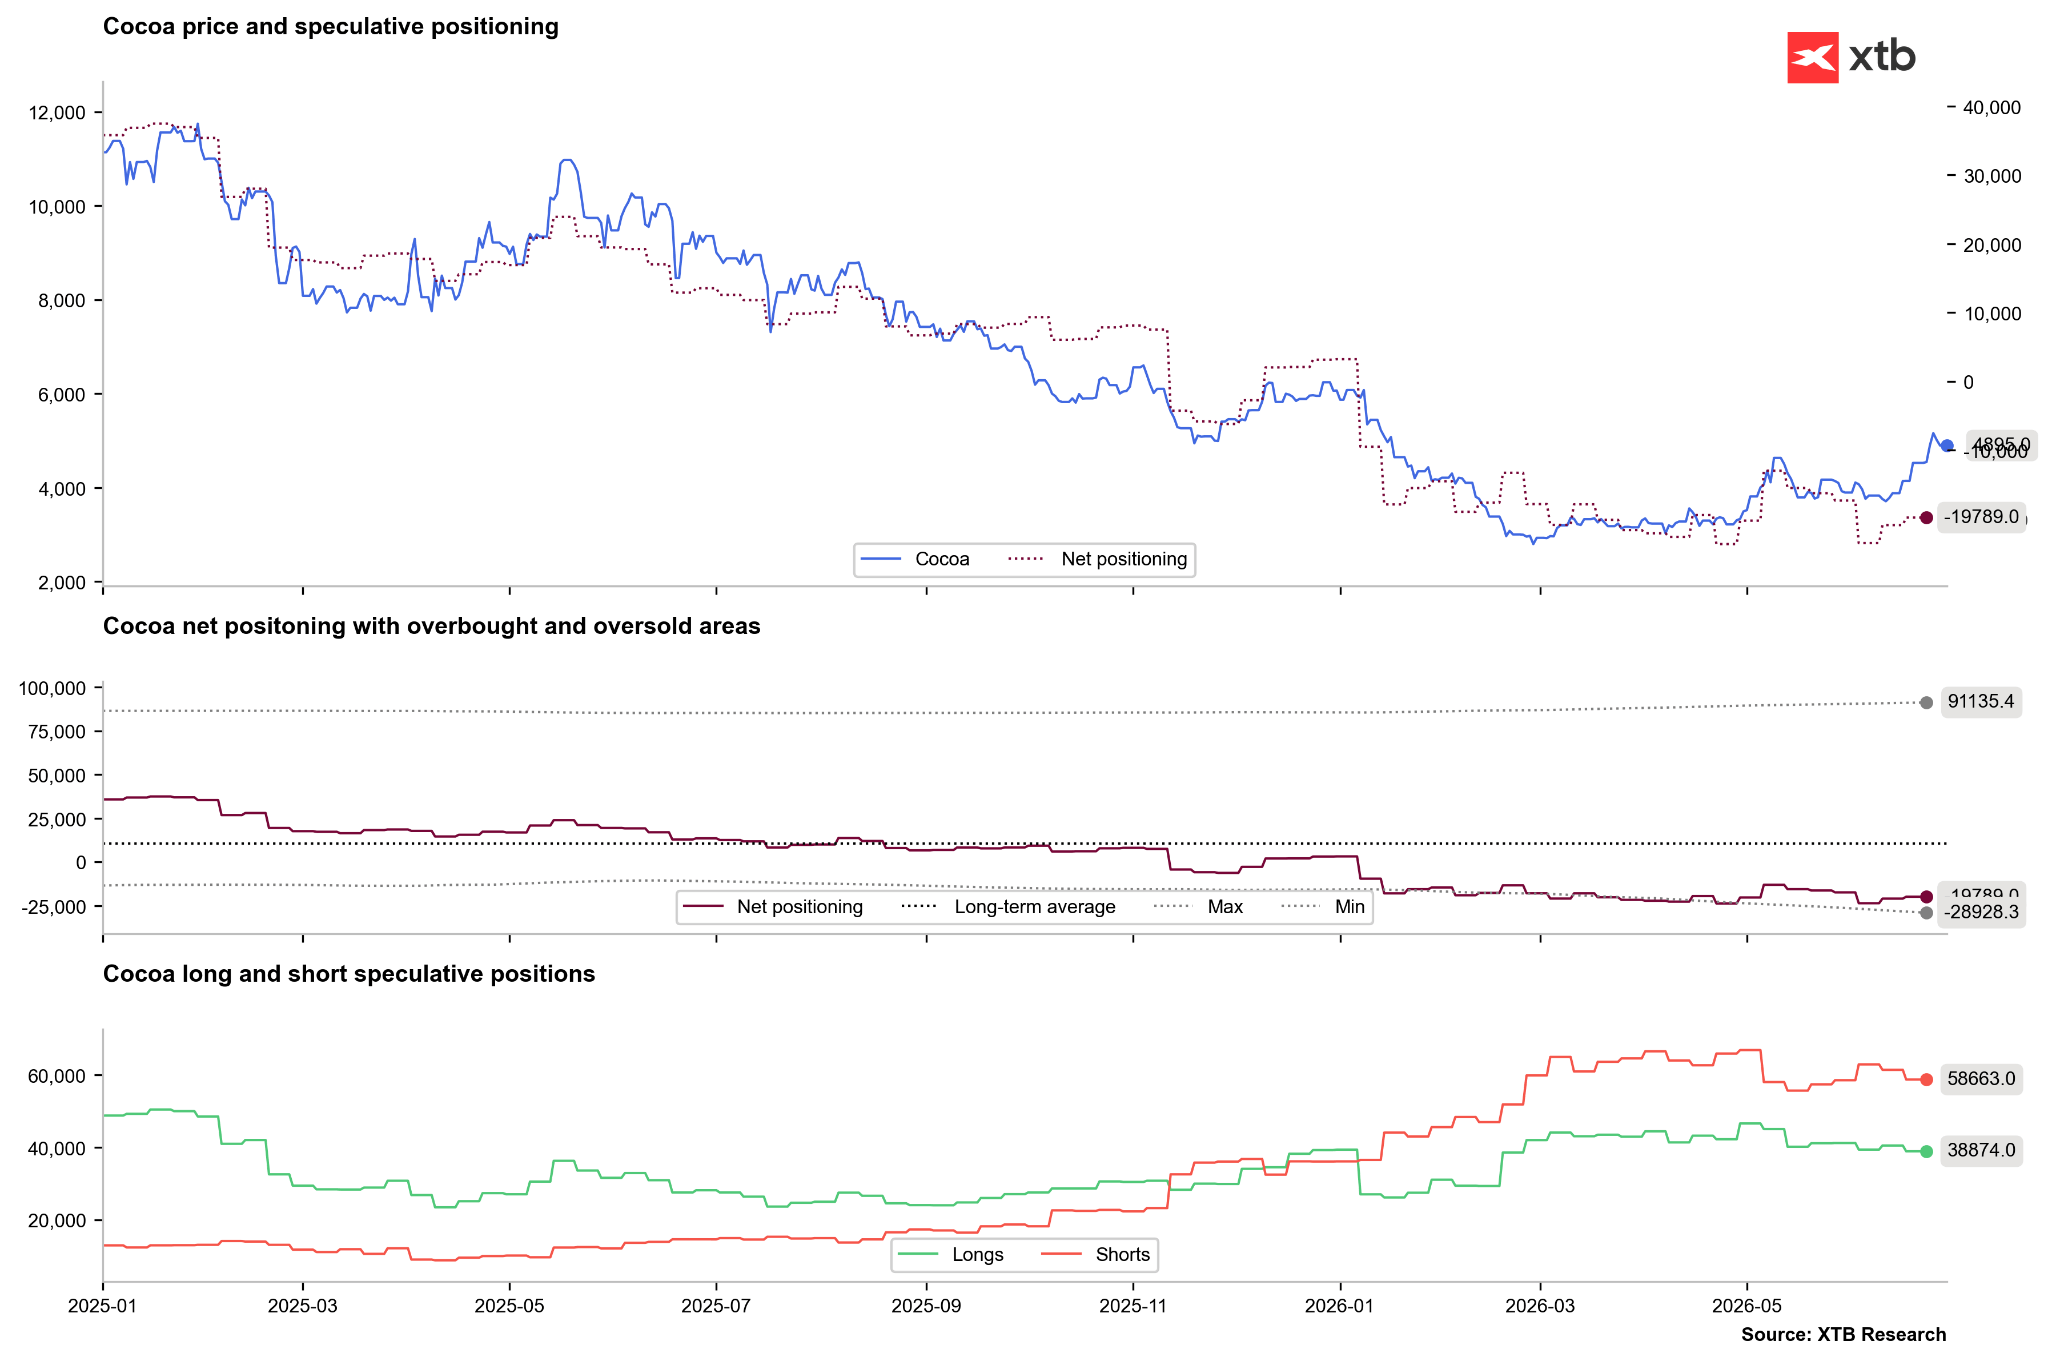
Recently, we observed a slight closing of short positions, but we do not see a high dynamic of changes. Source: Bloomberg Finance LP, XTB
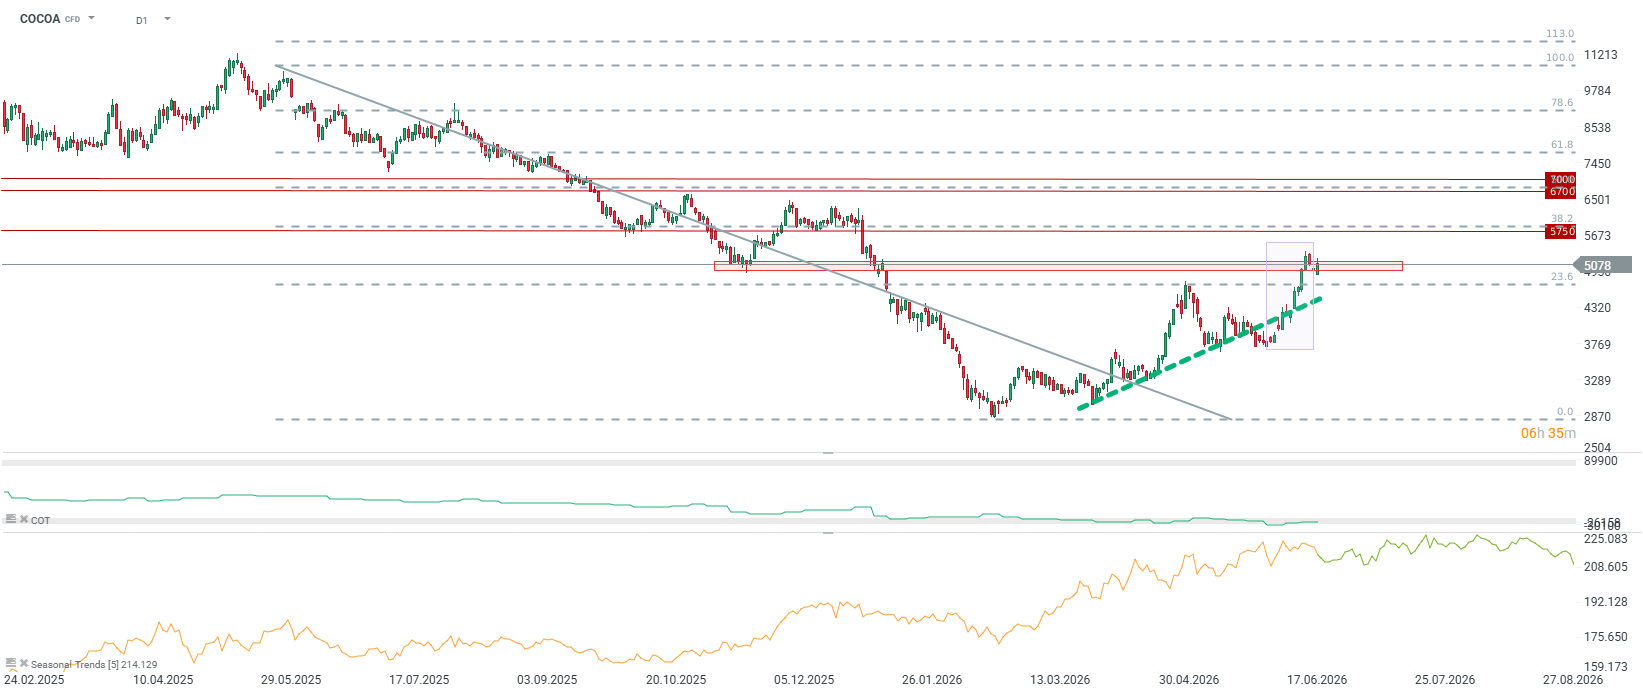
Cocoa is one of the best-performing commodities in Q2 due to concerns regarding El Niño. Source: xStation5