Oil:
- Last week, a ceasefire agreement between the United States and Iran was reached at the eleventh hour; however, weekend peace talks failed, resulting in the United States imposing a blockade on the Strait of Hormuz.
- The United States has indicated it will intercept all vessels departing from or heading to Iranian ports. Nevertheless, the precise operational nature of such a blockade remains unclear.
- Initial reports suggest the blockade may mirror the measures taken against Venezuela several months ago. At that time, most vessels refrained from sailing, while others were seized by the U.S. Navy.
- Actions by the American fleet could drive prices higher, potentially toward $120 per barrel. However, should a tanker be sunk—whether by Iranian or American actions—prices could react far more violently.
- Both sides have signaled a willingness to return to the negotiating table. Four separate sources reported today that the U.S. and Iran are set to resume negotiations by the end of this week.
- Iranian President Masoud Pezeshkian stated that U.S. demands are excessive, though he remains hopeful for the mediation of European policymakers in the talks.
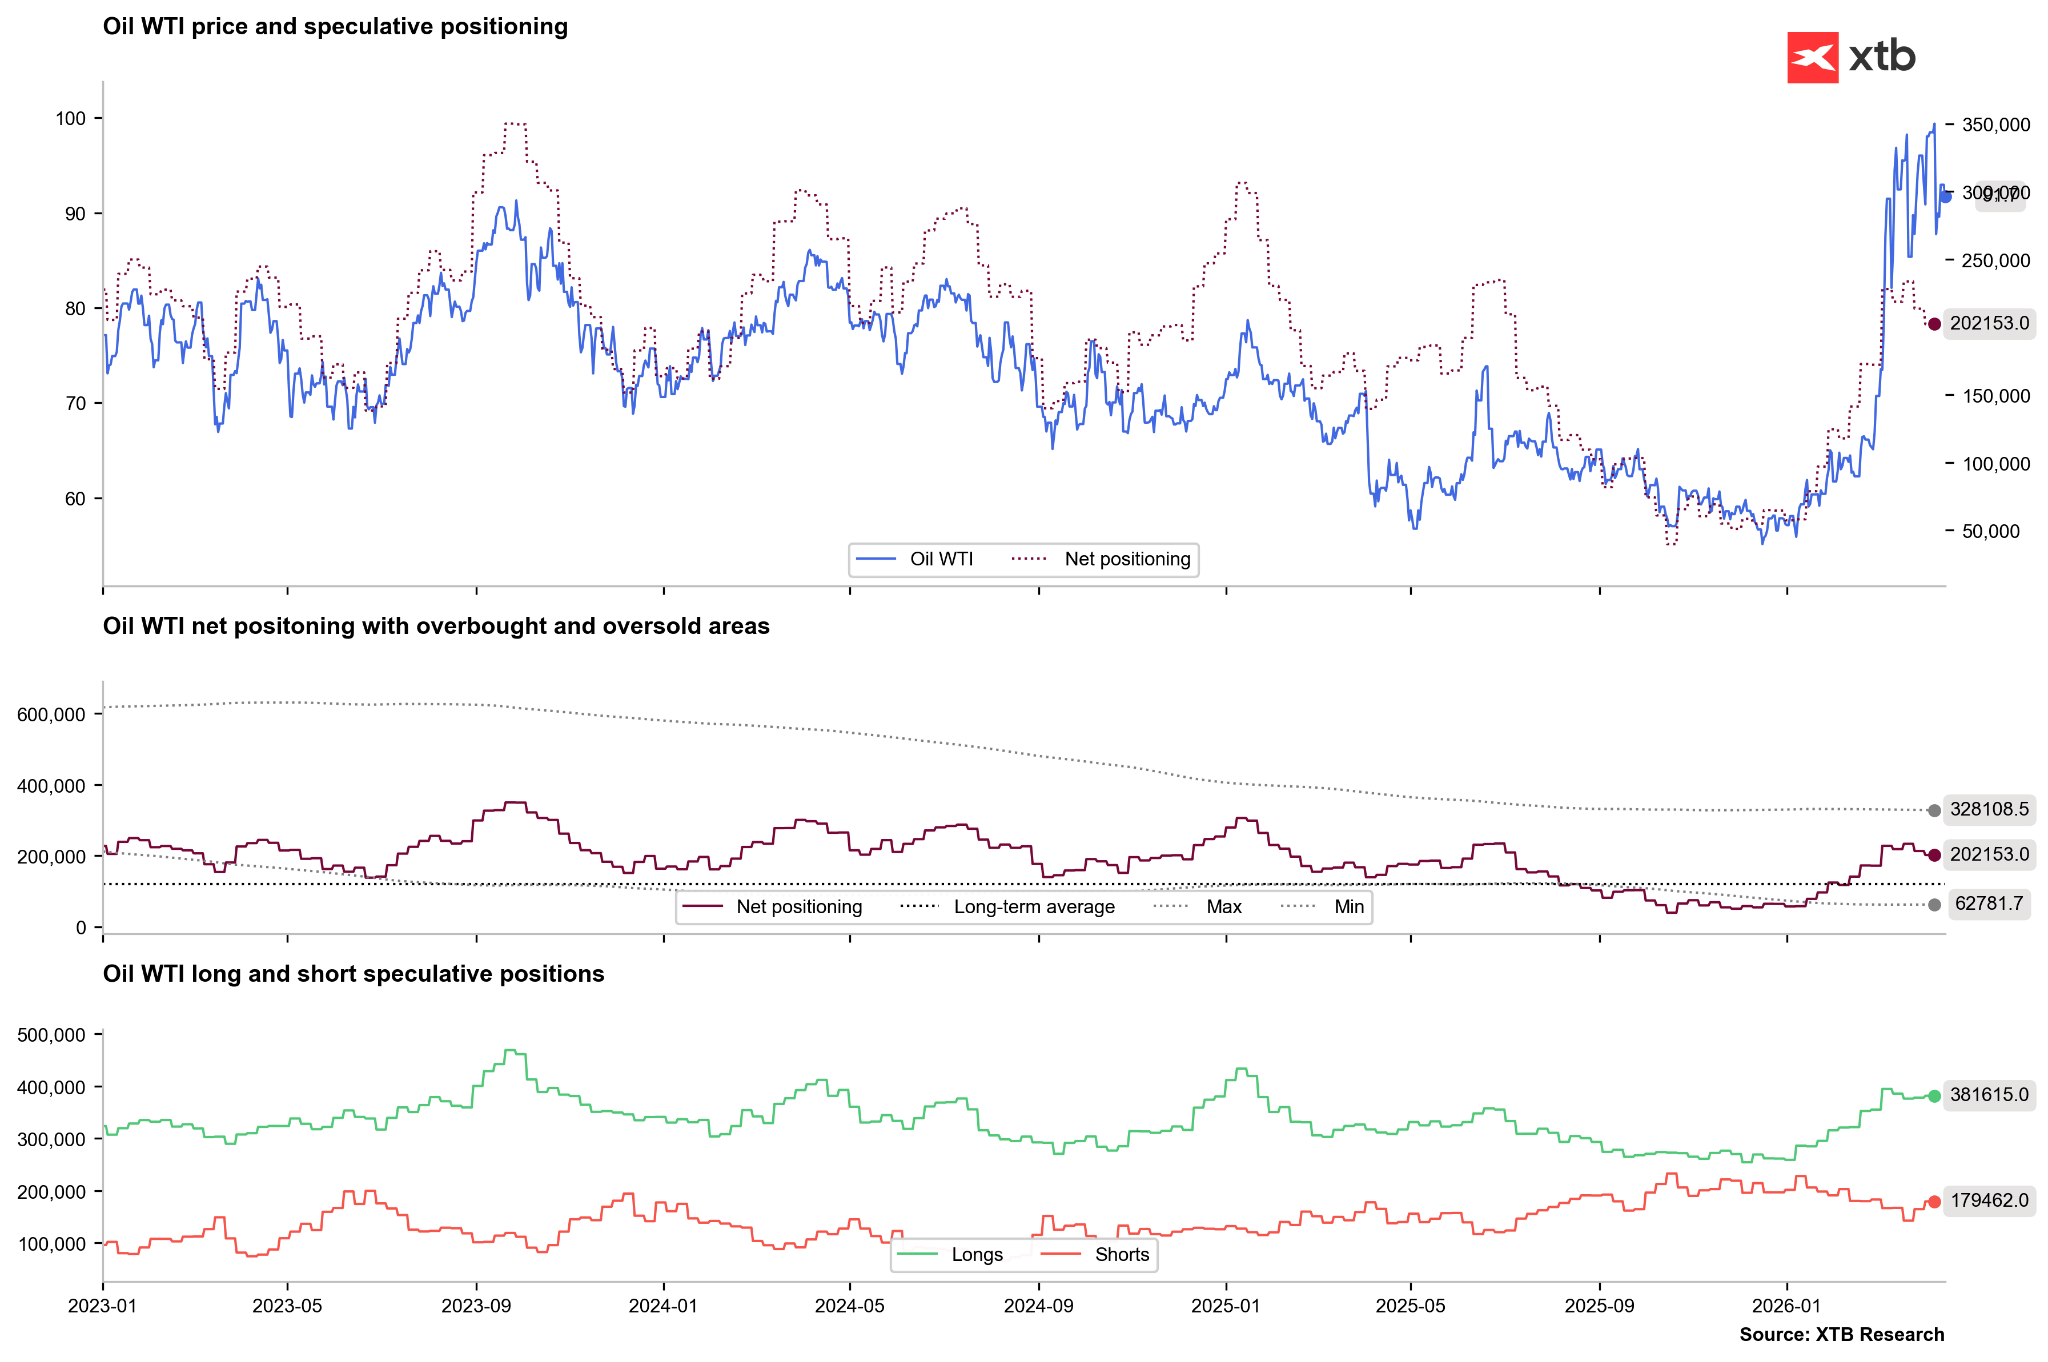 The number of short positions on WTI crude is rising slightly. The high correlation with net positioning may suggest that the oil market has already moved past its primary bullish wave. Source: Bloomberg Finance LP, XTB
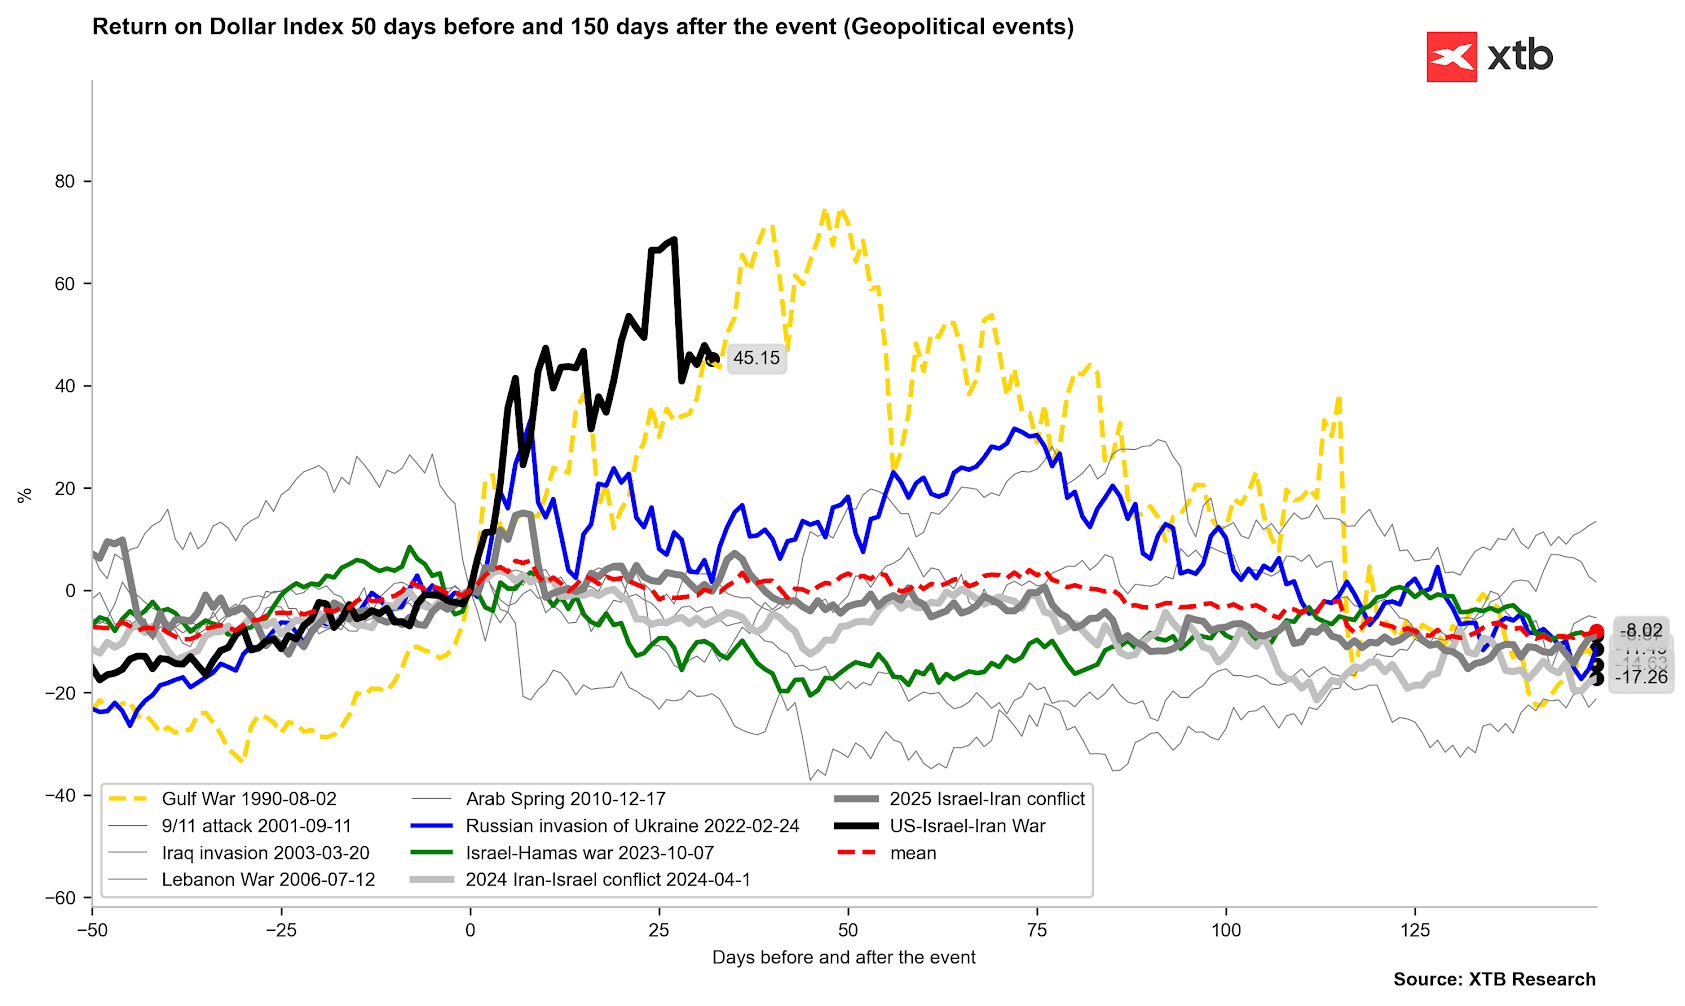 Crude oil is currently tracking a trajectory remarkably similar to that of 1990. This would imply several more weeks of volatility before the eventual onset of a downward trend. Source: Bloomberg Finance LP, XTB
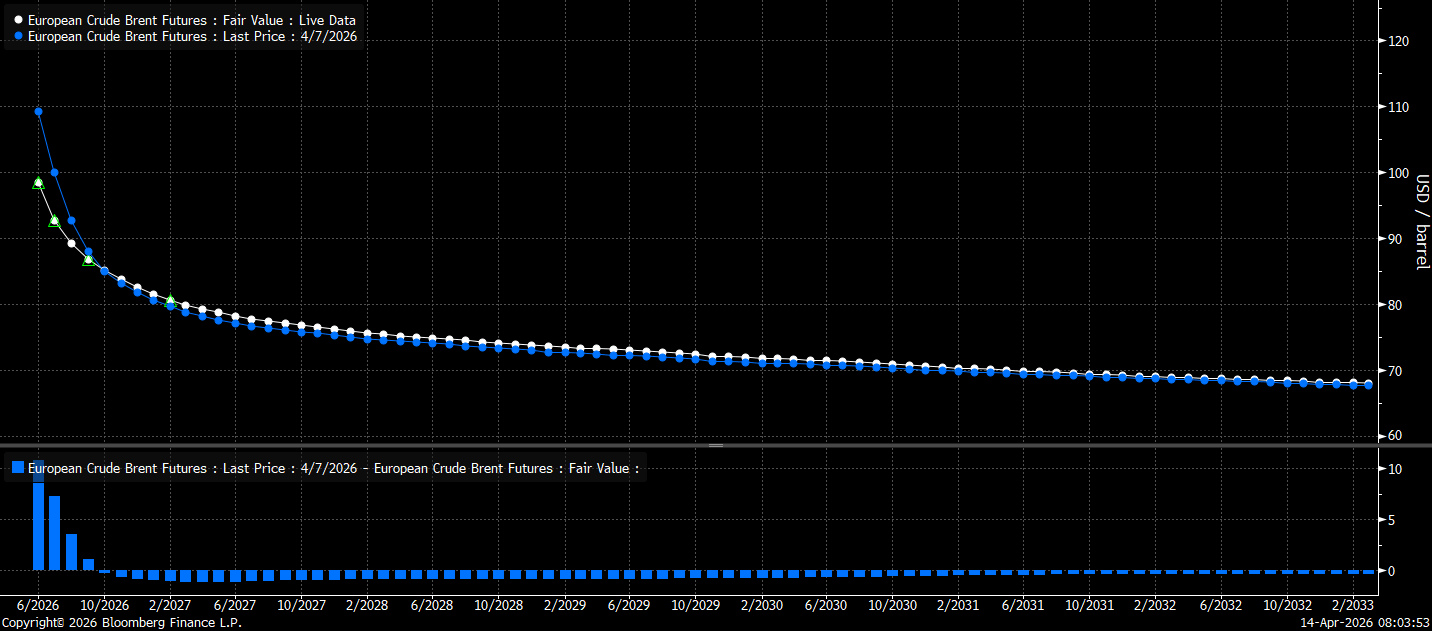 It is worth noting that the futures market was significantly tighter a week ago, just before the deadline for the ceasefire agreement. Conversely, the physical market continues to exhibit extreme tension. Dated Brent is currently trading near $130 per barrel. Source: Bloomberg Finance LP
Gas:
- The conclusion of the heating season in the United States, coupled with limited LNG export capacity, has led to a significant supply glut in the domestic gas market.
- Current weather forecasts indicate above-average temperatures, which is limiting immediate demand; however, projections also suggest higher summer temperatures, which could hinder the inventory replenishment process.
- The implied change in inventories currently stands near 100 bcf, a notably high level for this time of year.
- Gas prices in European markets have fallen sharply, while they remain elevated in the U.S. market.
- Prospects of restricted export capacity from Qatar should favor the expansion of U.S. export infrastructure, potentially supporting U.S. gas prices in the long term.
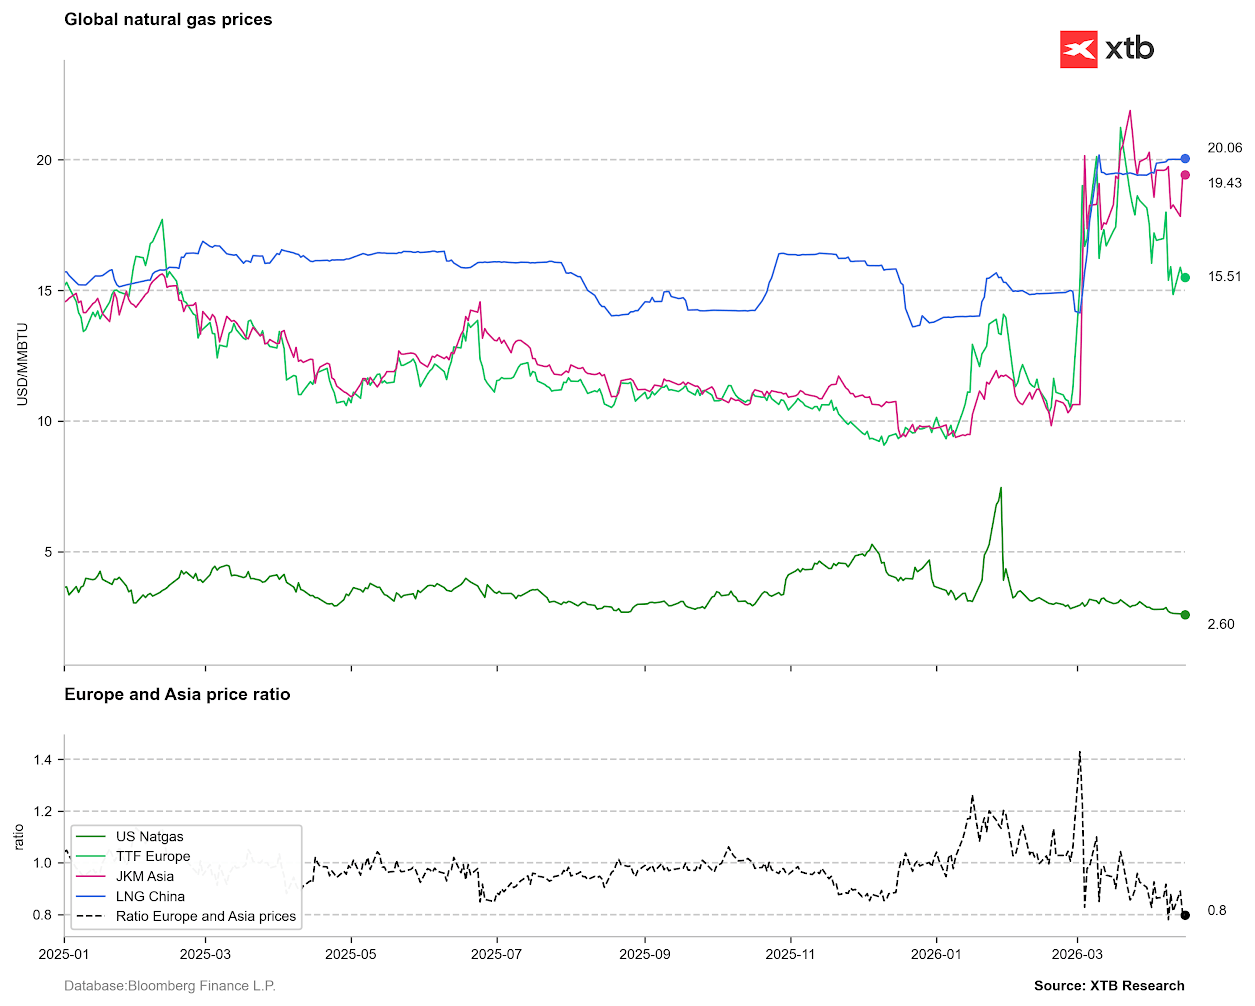 Gas prices in China and other key Asian markets remain high, while European prices are falling. High Asian pricing may incentivize spot sellers to redirect cargoes toward Asian markets. Source: Bloomberg Finance LP, XTB
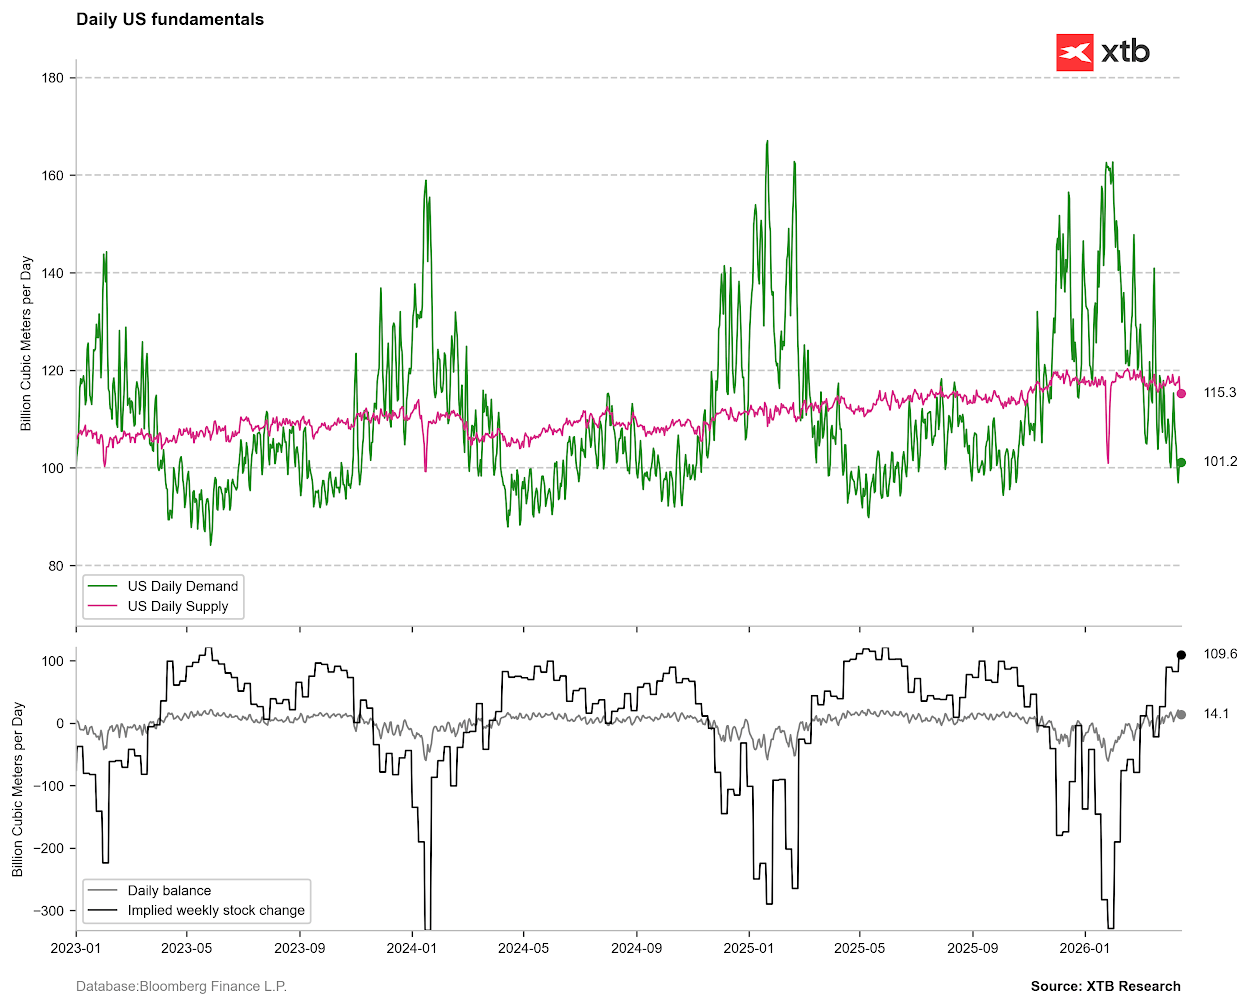 The implied change in U.S. inventories currently exceeds 100 bcf—an occurrence rarely seen during this period of the year. Source: Bloomberg Finance LP, XTB
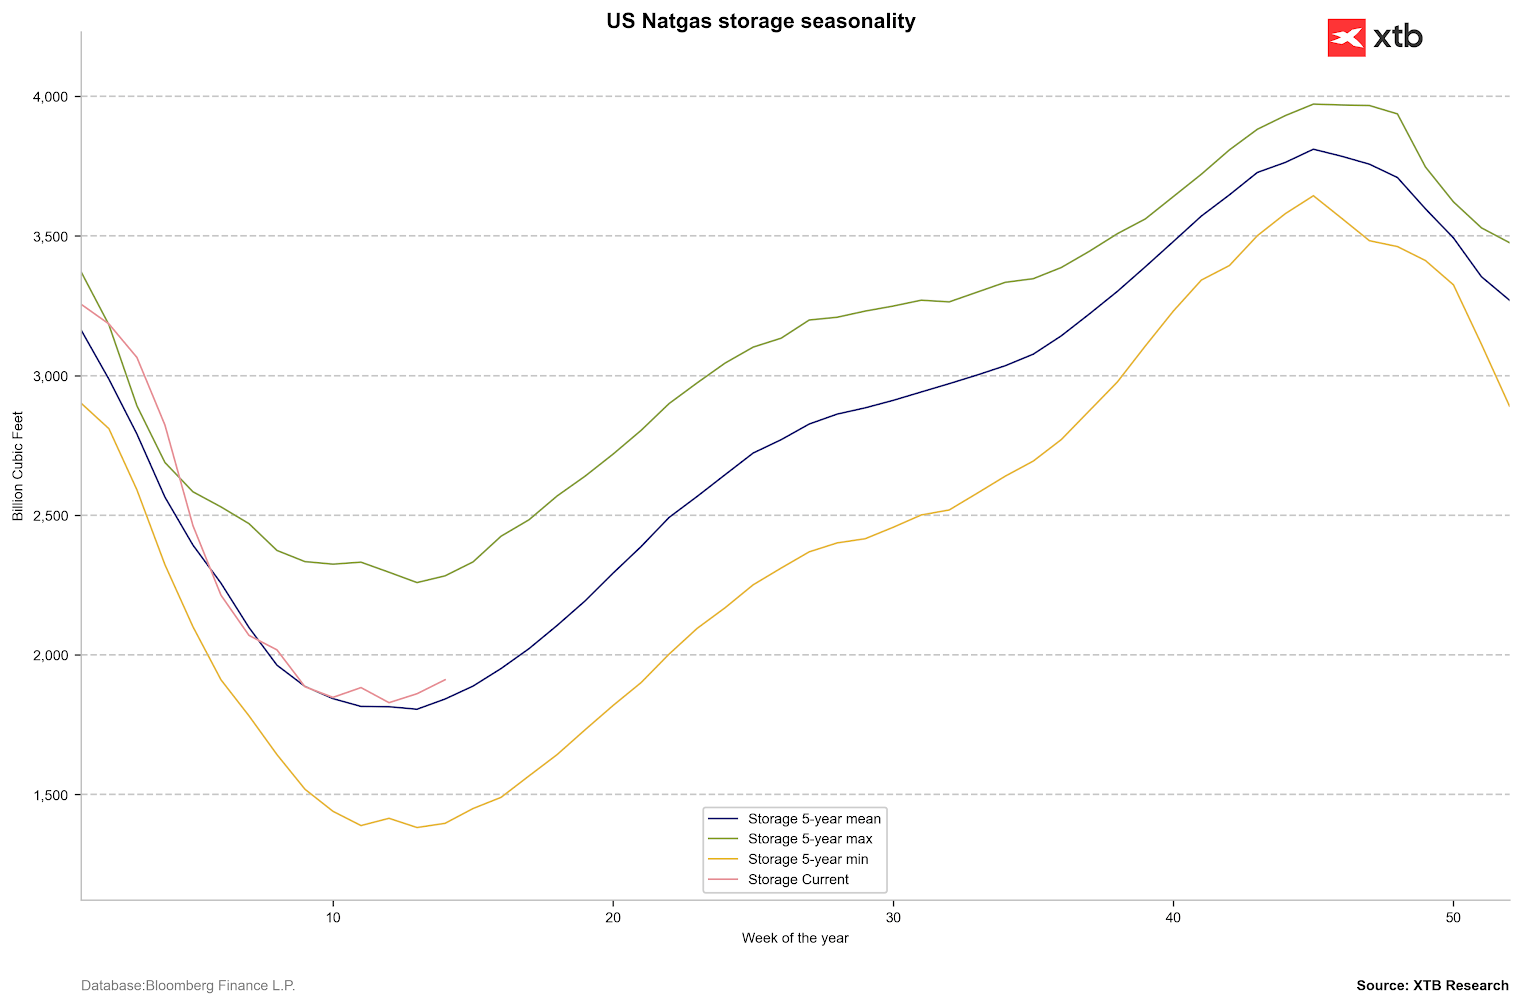 Natural gas inventories have begun to rebound faster than usual. Nonetheless, levels remain near the 5-year average; consequently, exceptionally low gas prices may not persist through the summer, when consumption typically accelerates. Source: Bloomberg Finance LP, XTB
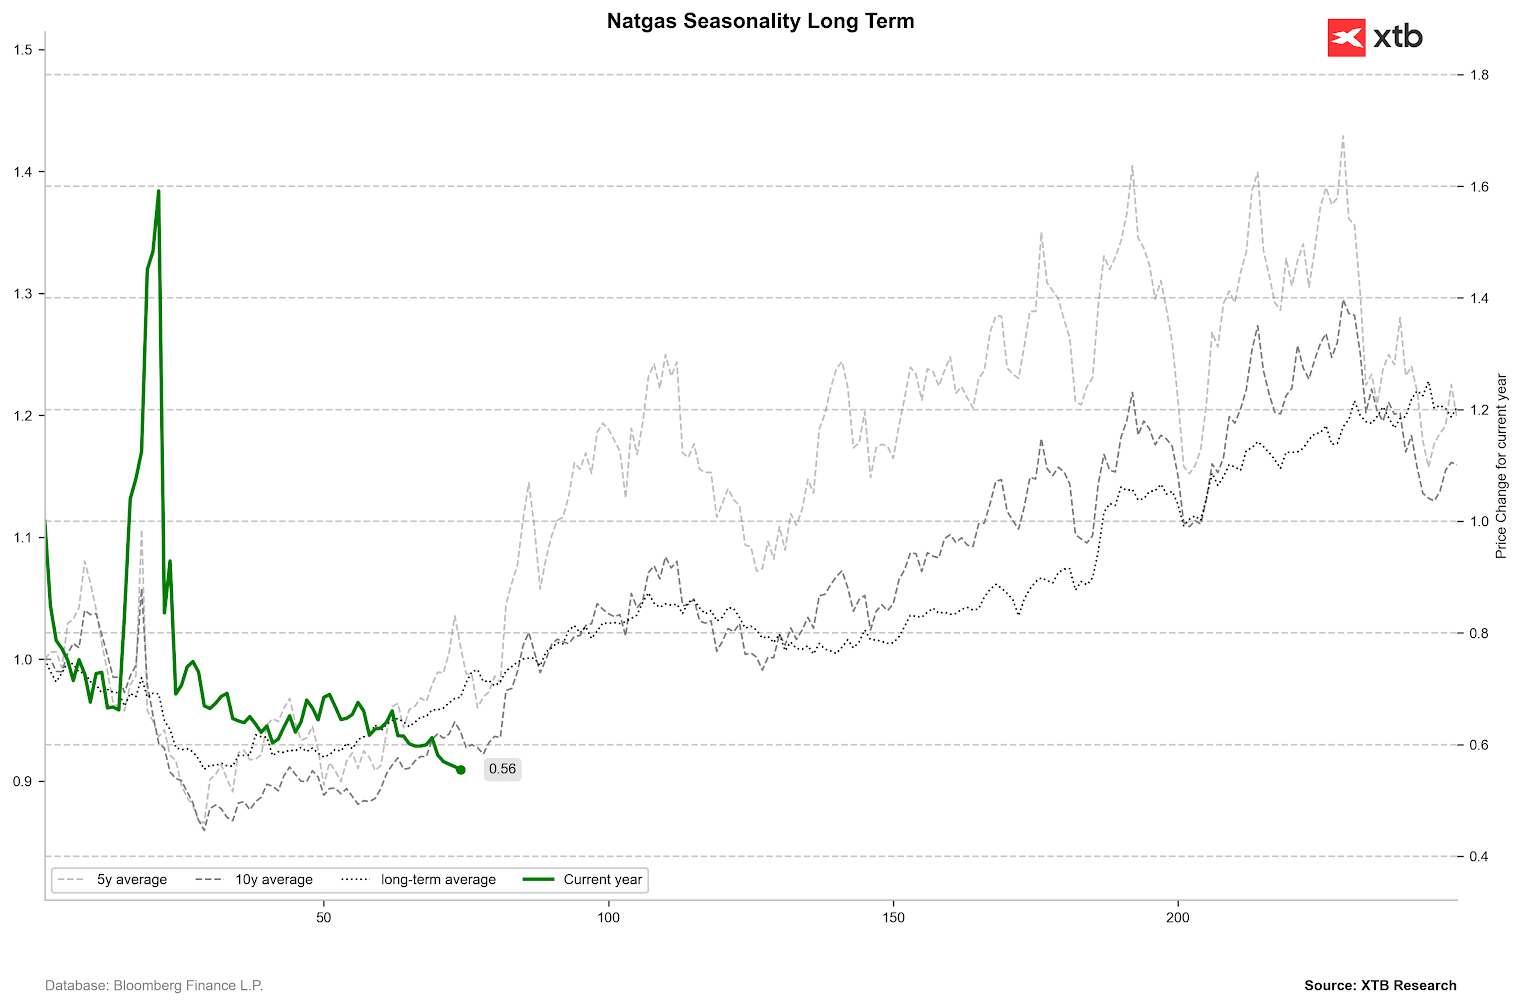 Seasonality suggests we are at a juncture where a rebound typically occurs, though this is partly a function of the current position on the forward curve. Source: Bloomberg Finance LP, XTB
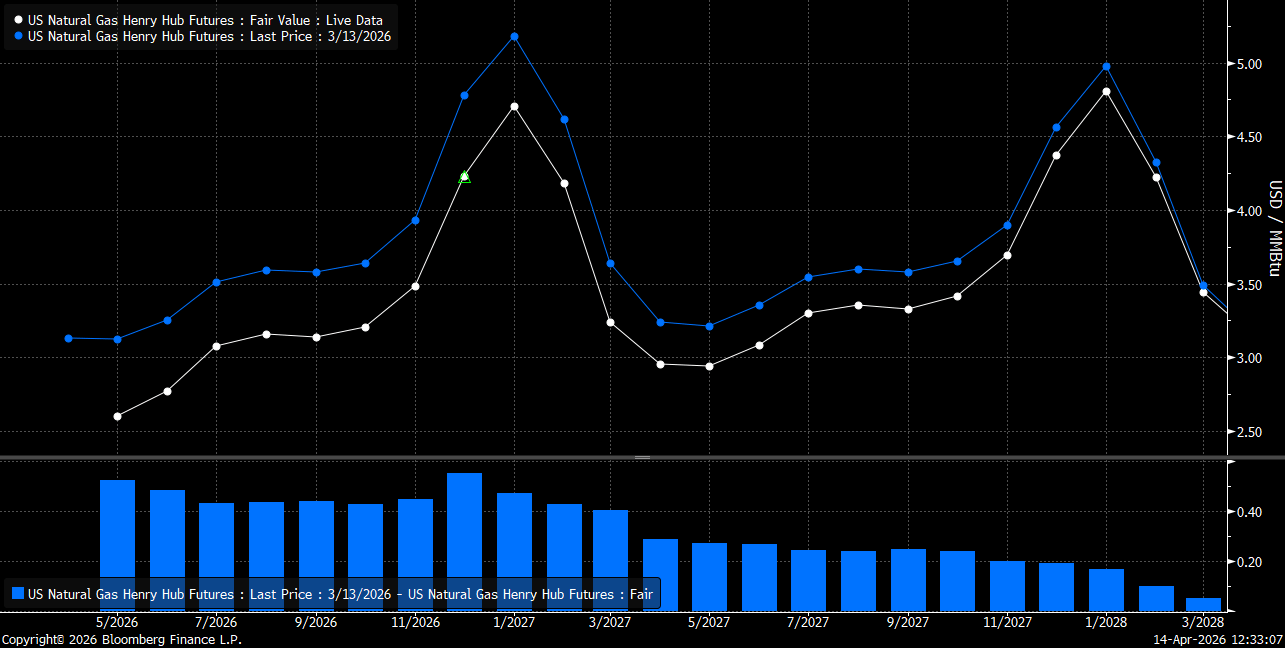 Over the past month, contango has widened slightly, both in the short term and regarding the January contract, which usually represents price peaks. Notably, as the market transitions to the July contract, the forward curve structure will allow for price adjustments without the burden of significant roll costs. Source: Bloomberg Finance LP
Silver:
- The market appears currently unconcerned by the risks of silver physical availability. While COMEX inventories continue to decline, there is no immediate prospect of an actual shortage (exchange authorities have also recently lowered margin requirements).
- The gold-to-silver ratio remains elevated relative to recent lows, but the current situation is increasingly reminiscent of the 1990s, when the ratio traded for several months within a historical average range above 50 points.
- ETFs have ceased selling off silver, which serves as a constructive signal for medium- and long-term investors.
- At the same time, silver remains primarily an industrial commodity. High oil prices will dampen economic activity, which could translate into a narrower deficit or even a balanced market this season.
- For this reason, gold currently holds slightly better prospects for a continued rebound this year compared to silver. On the other hand, high oil prices could accelerate the energy transition, adding more structural demand for silver in the long run.
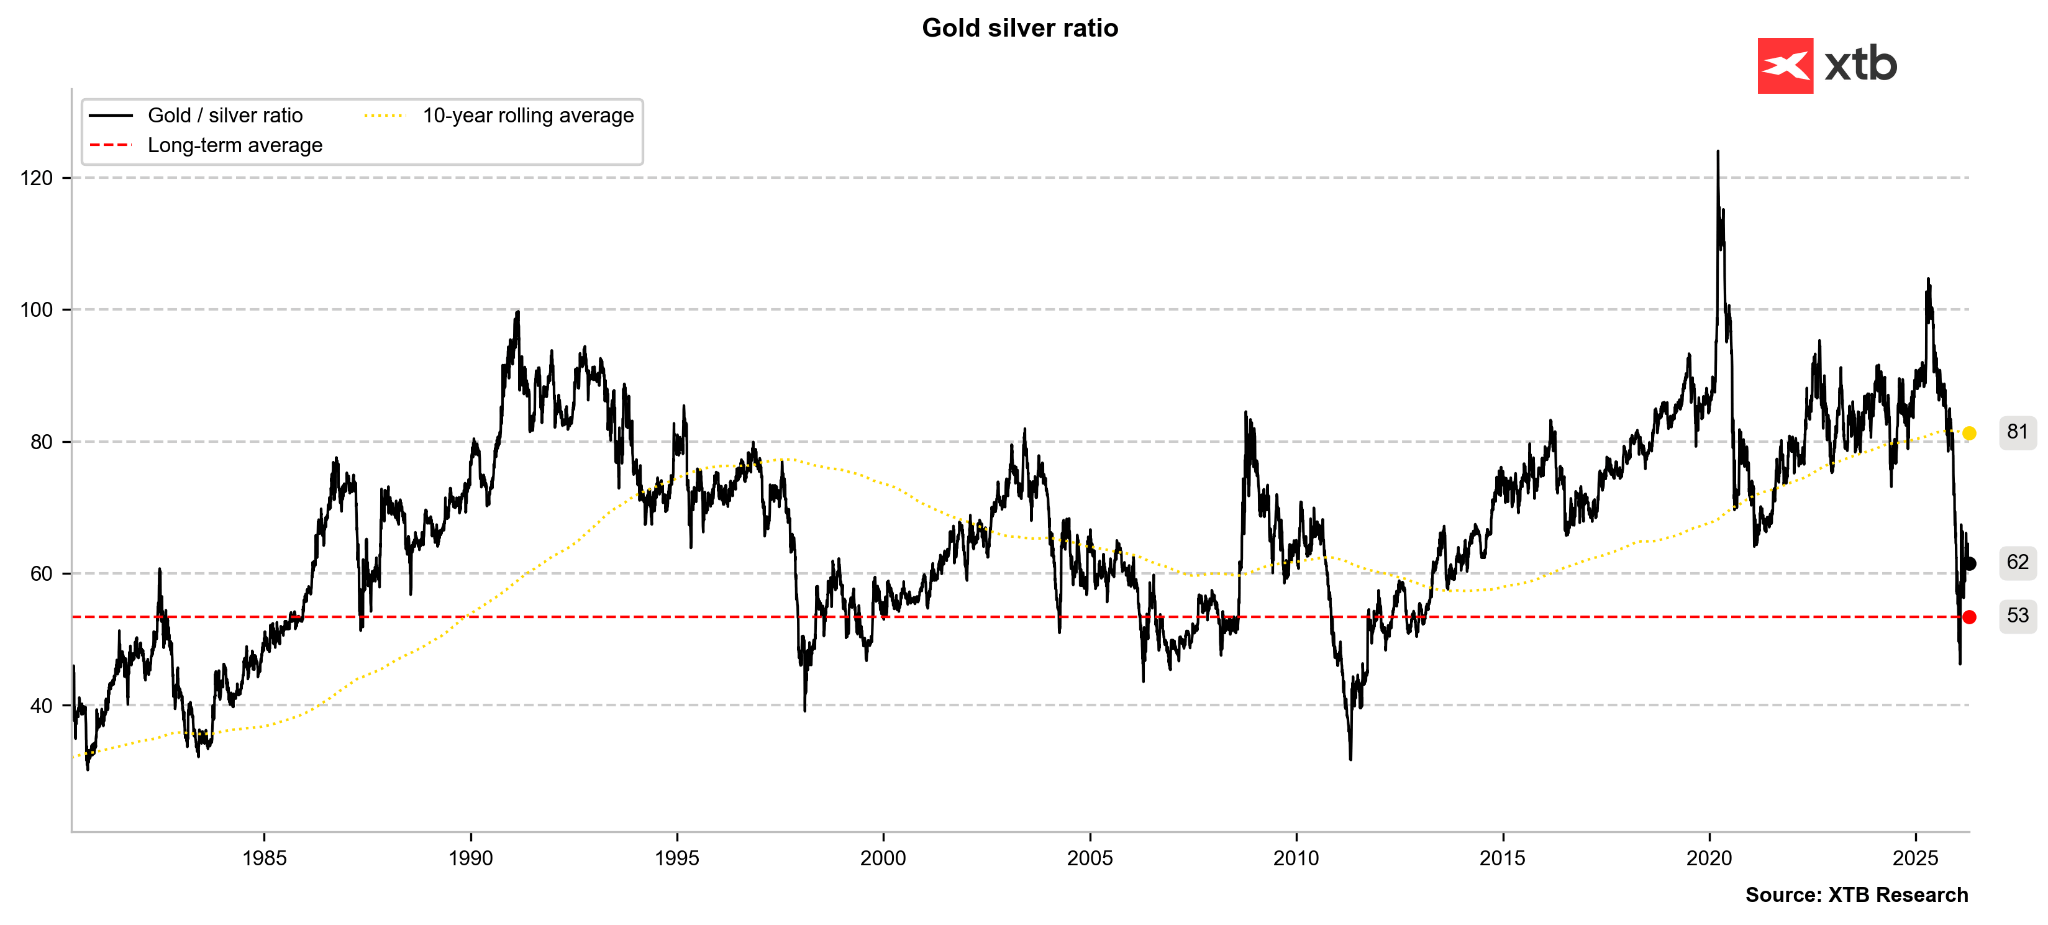 The gold-to-silver ratio remains elevated, but has failed to see a dynamic rebound toward the 70–80 range. The current setup mirrors the late 1990s; prices were significantly lower then, but were within an established uptrend. Source: Bloomberg Finance LP, XTB
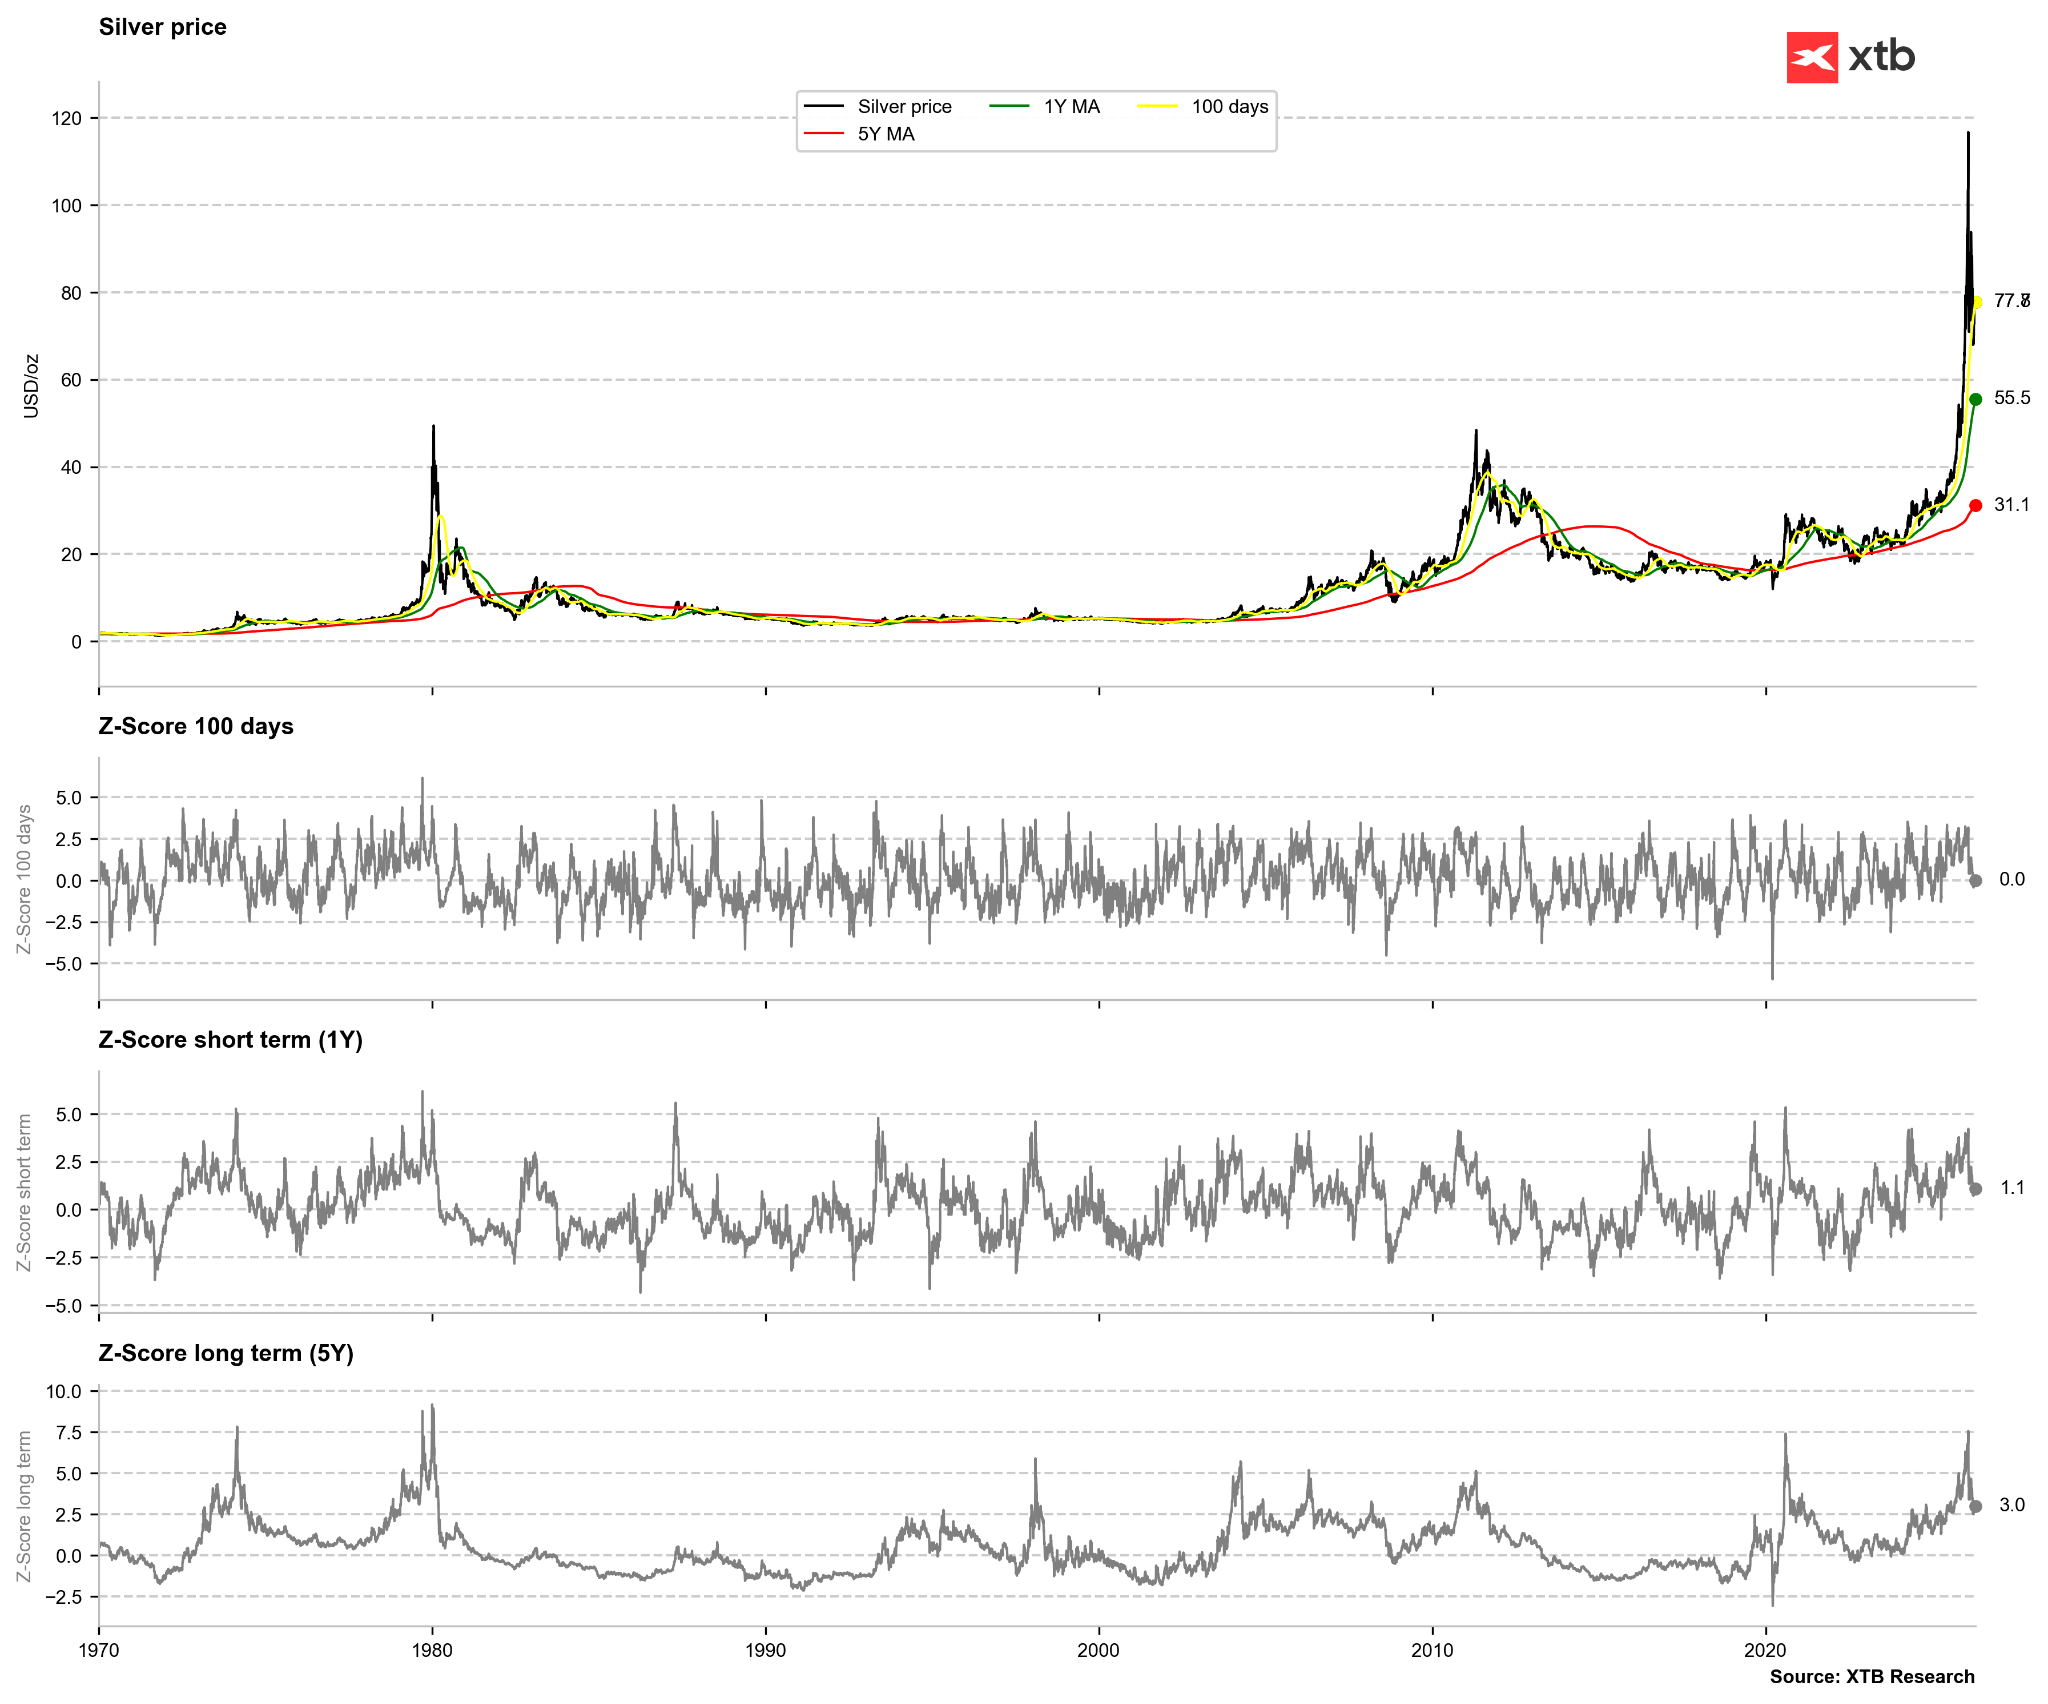 The price has converged with the 100-period moving average. Trading remains one standard deviation away from the 1-year mean, indicating that no oversold signal has yet materialized. Source: Bloomberg Finance LP, XTB
Cotton:
- Cotton planting in the United States is proceeding in line with expectations. Recent data shows planting progress at 7% this season, consistent with the 5-year average.
- Before the most recent contract roll, the May contract rose approximately 16% from February to the present, climbing from 64 cents per pound to just over 74 cents.
- Previously, the price began to rebound in early February after hitting roughly 60 cents per pound—the lowest level since 2020.
- The price appreciation is partly linked to rising oil prices, as more expensive crude increases the cost of synthetic alternatives.
- The sharp price move is tied to “short-covering.” Large short positions held by funds were forced to close after the market found a floor near 60 cents.
- Additionally, the outlook for Chinese cotton imports has improved, as confirmed by U.S. export data.
- Drought risks are also rising in the U.S. “Cotton Belt” in Texas. In India, forecasts of a weaker monsoon due to El Niño are dampening crop prospects.
- The latest USDA WASDE report showed a slight upward revision in ending stocks for this year, marking the second consecutive annual increase. Production is expected to exceed last year’s levels, while consumption is forecast to decline.
- Stock accumulation is primarily expected in India (excluding China, which still holds roughly half of global inventories).
- Rising global inventories and the prospect of falling oil prices later this year cast doubt on the sustainability of the current cotton rally, although prices remain far below 2022 peaks.
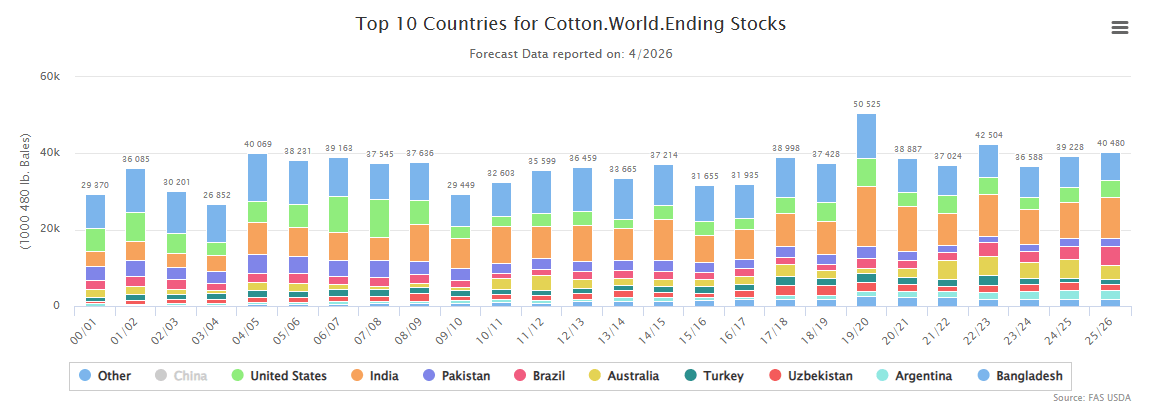 Cotton inventories are expected to grow for the second consecutive year this season. Furthermore, excluding the 19/20 and 22/23 seasons, this would represent the highest level of stocks on record (excluding China). Source: USDA
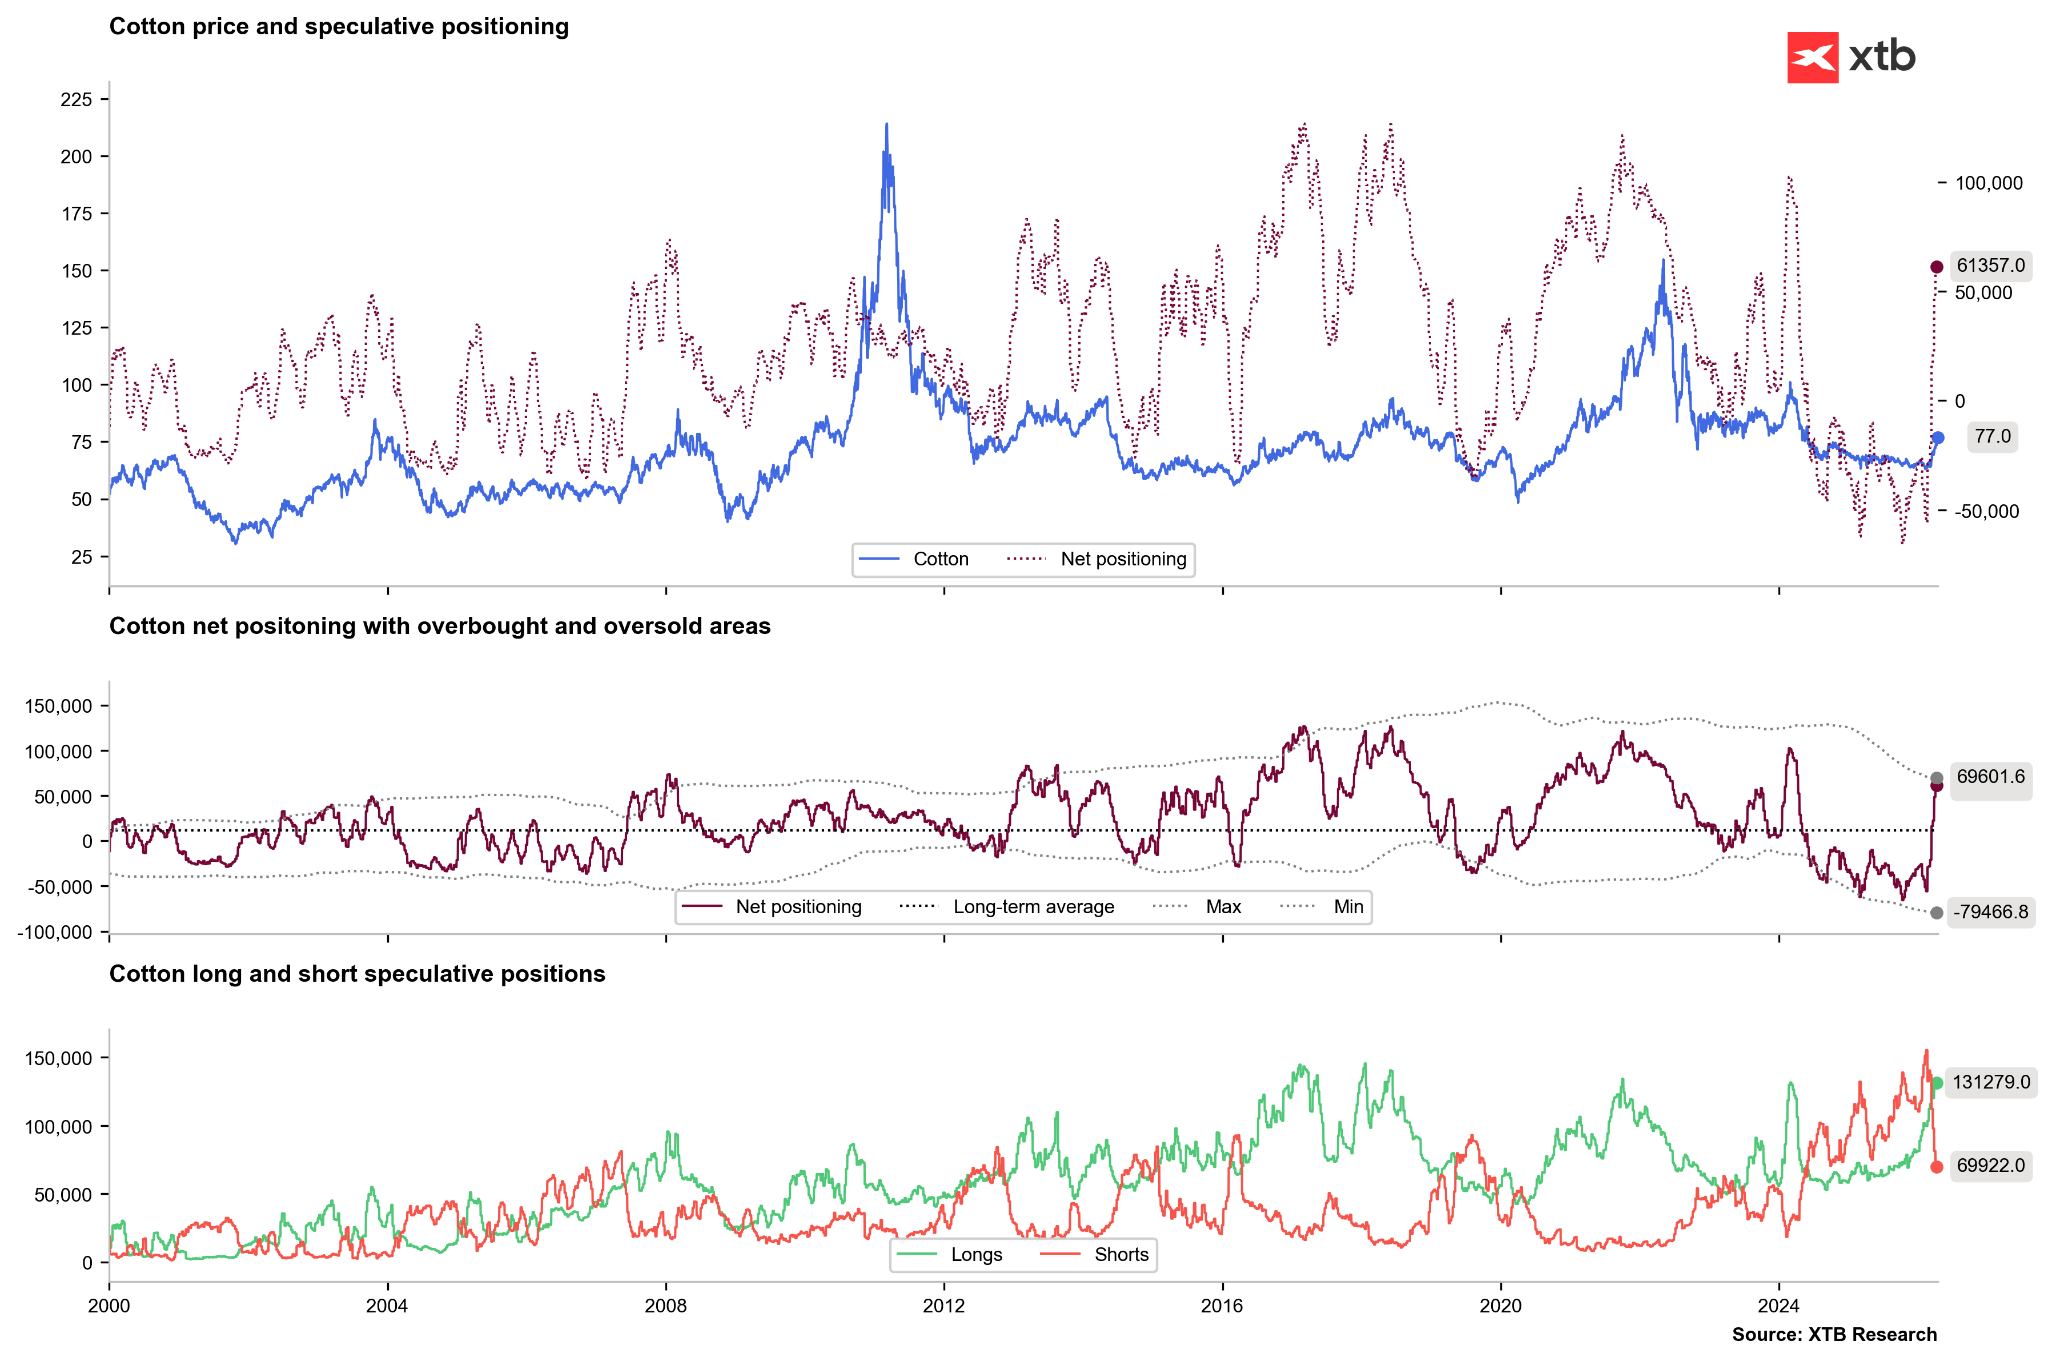 We continue to observe aggressive short-covering among non-commercial investors. The volume of short positions has dropped to near-lows for early 2026. Conversely, long positions have matched their early 2026 peak. Net positioning remains lower than in 2024 and 2022, when prices traded near 150 cents amid high oil prices. For now, we are seeing expectations of deteriorating fundamentals rather than an actual shift. A reduction in long positions could signal a reversal, though price levels remain relatively low. Source: Bloomberg Finance LP, XTB
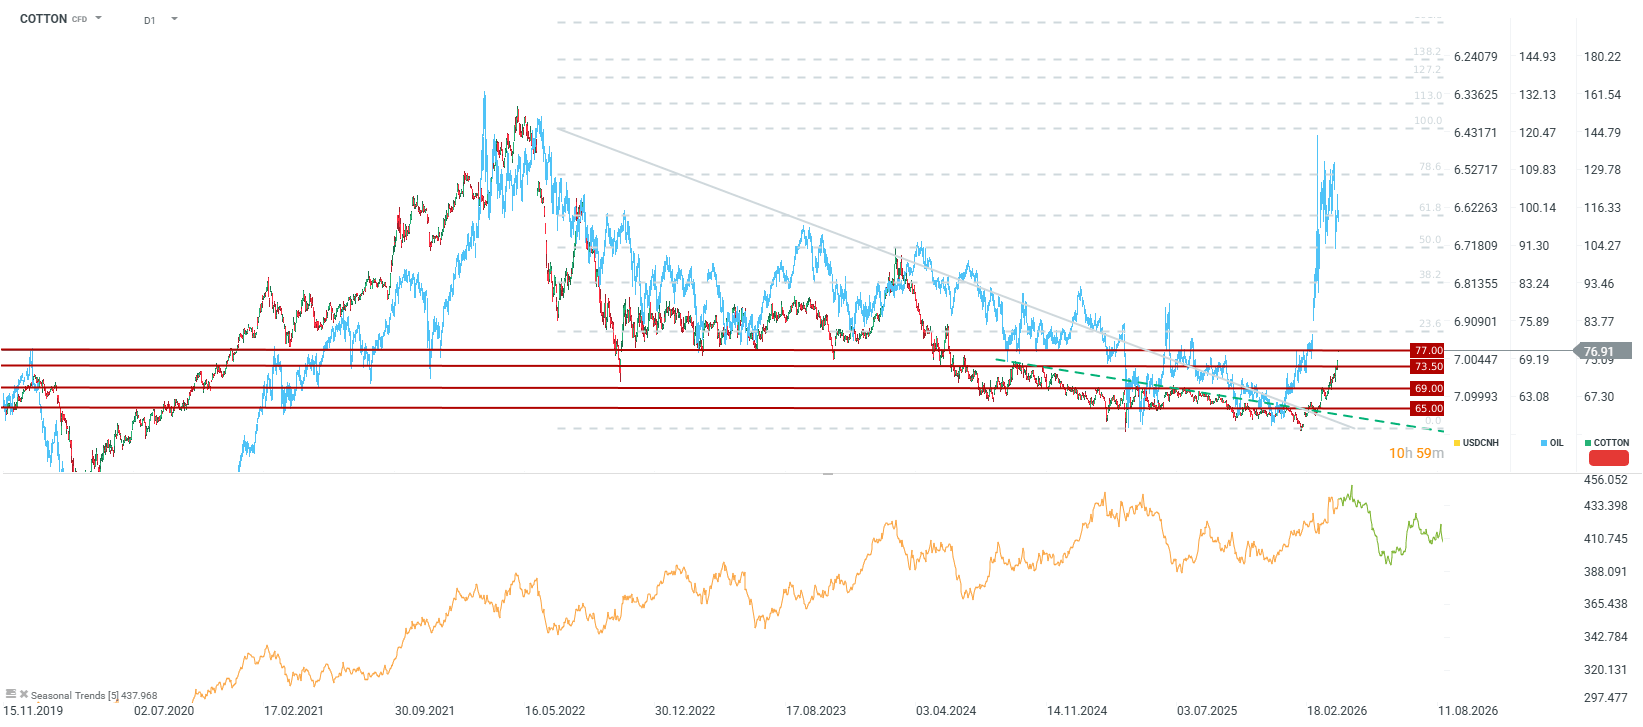 Prices have risen considerably since early February, though they remain well below 2022 or 2024 peaks. Seasonality suggests that within a few weeks, prices could return to lower levels. Source: xStation5
The material on this page does not constitute financial advice and does not take into account your level of understanding, investment objectives, financial situation or any other specific needs. All information provided, including opinions, market research, mathematical results and technical analyzes published on the Website or transmitted To you by other means, it is provided for information purposes only and should in no way be construed as an offer or solicitation for a transaction in any financial instrument, nor should the information provided be construed as advice of a legal or financial nature on which any investment decisions you make should be based exclusively To your level of understanding, investment objectives, financial situation, or other specific needs, any decision to act on the information published on the Website or sent to you by other means is entirely at your own risk if you In doubt or unsure about your understanding of a particular product, instrument, service or transaction, you should seek professional or legal advice before trading. Investing in CFDs carries a high level of risk, as they are leveraged products and have small movements Often the market can result in much larger movements in the value of your investment, and this can work against you or in your favor. Please ensure you fully understand the risks involved, taking into account investments objectives and level of experience, before trading and, if necessary, seek independent advice.