S&P 500 — US Large Cap Index
 FTSE 100 — UK Blue Chips
 Euro Stoxx 50 — Eurozone Leaders
 DAX 40 — German Equities
 CAC 40 — French Market Index
 Nikkei 225 — Japan Benchmark
 Hang Seng — Hong Kong Index
 Shanghai Composite — China Mainland
 ASX 200 — Australian Market
 TSX Composite — Canada Index
 Nifty 50 — India Large Cap
 STI Index — Singapore Market
 KOSPI — South Korea Index
 Bovespa — Brazil Equities
 JSE Top 40 — South Africa Index
 IPC Index — Mexico Market

- Gold: The market underwent a significant Q2 correction due to a hawkish Federal Reserve shift, yet central banks continue to accumulate the metal as a hedge against US fiscal risks.
- Natural Gas: US prices face pressure from oversupply, while the European market remains strained by a severe storage deficit and potential supply disruptions from Qatar and Norway.
- Coffee: Prices saw a dramatic rebound driven by El Niño concerns, weather-related harvest issues in Brazil, and rising production costs in Vietnam.
- Cocoa: After a period of price collapse, cocoa markets experienced a sharp recovery in July, fueled by supply issues such as excessive rainfall and tree disease epidemics in West Africa.
Gold
- In the second quarter of 2026, the gold market underwent one of the deepest quarterly corrections in history, losing nearly 15% of its value, comparable only to 2013 or several quarters in the early 1980s (the largest drop then occurred in 1982).
- Gold fell below the $4,000 per ounce threshold for the first time since November 2025, while the end of the war between the US and Iran, followed by easing pressure for interest rate hikes, led to a rebound, even approaching $4,200 per ounce.
- The main catalyst for the earlier declines was initially a sharply hawkish shift by the Federal Reserve under the leadership of its new chairman, Kevin Warsh. Despite keeping rates in the 3.50%–3.75% range in June, as many as 9 of 19 members indicated a possible hike this year in their forecasts, triggering an outflow of over $5 billion from ETF funds in June alone. Weaker US labor market data at the end of the month slightly mitigated these hawkish expectations.
- At the beginning of the second week of July, prices reacted to resistance related to the 25-period average, pulling back to $4,125 per ounce.
- One of the reasons was a renewed increase in crude oil prices after Brent stabilized above $70 per barrel, following further Iranian attacks on merchant ships in the Strait of Hormuz.
- Recent attacks by Iran suggest that returning to normality will be very difficult, even during the 60-day memorandum. Only the sea route located near Oman remains open, but it has severely limited capacity.
- One of the most important factors in the context of monetary policy will be Wednesday’s release of the FOMC minutes. If the minutes indicate that bank members are indeed preparing for rate hikes, even later in the year after the midterm congressional elections, gold may face further pressure with the return of ETF sell-offs in the market.
- Interestingly, one of the Chinese gold ETFs in the market became the largest ETF in the country by assets under management, mainly due to massive outflows from equity ETFs.
- However, it is worth noting that June was expected to bring massive purchases by central banks, likely some of the strongest this year, showing that central banks continue to accumulate gold for diversification and to move away from the highly volatile US dollar.
- A survey conducted by the World Gold Council indicates that 30% of central banks intend to increase their gold reserves within 24 months, while simultaneously limiting their exposure to the dollar due to the fiscal risks of the United States under the leadership of Donald Trump.
- Goldman Sachs maintains its forecast at $4,900 per ounce, following its recent reduction from $5,400 per ounce.
- State Street, one of the world’s largest ETF providers, suggests that gold could head toward the $4,750–$5,500 range by Q1 2027, primarily due to record global debt. The firm indicates that the hard floor for gold lies in the $3,750–$4,000 range.
- JP Morgan, one of the biggest bulls in the gold market in recent quarters, sharply lowers its forecast for the end of this year to $4,500 per ounce from $6,000 per ounce.
The chart shows quarterly changes in gold prices since 1975
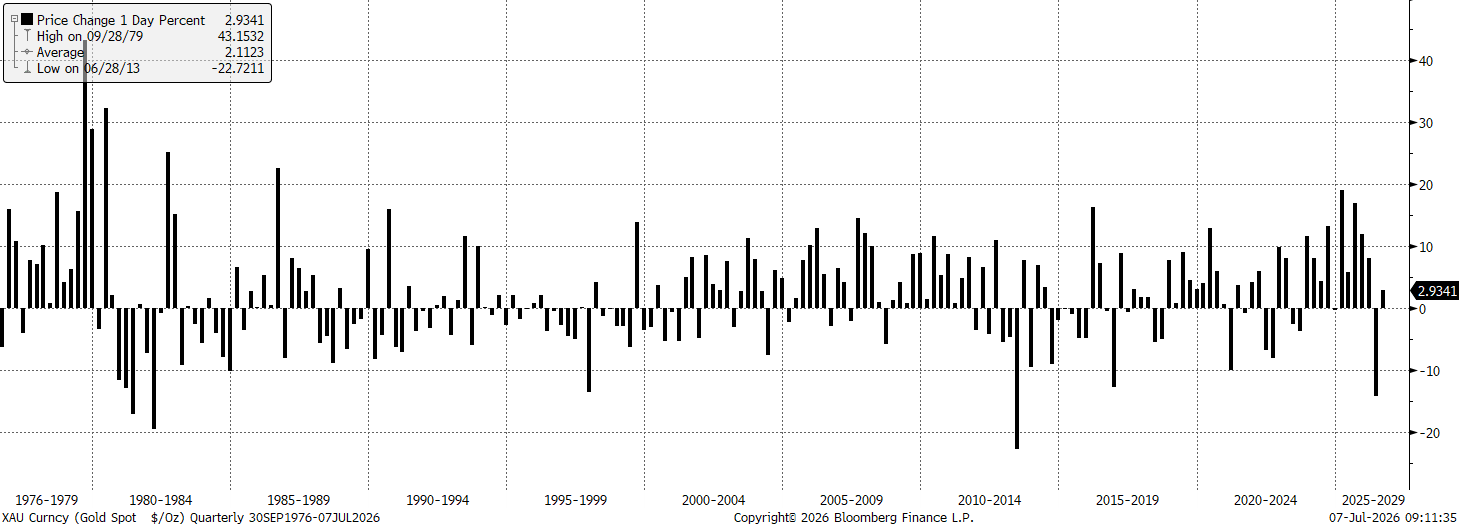
Gold lost more than 14% of its value during Q2 2026, which was one of the largest quarterly declines in history. It is worth noting that in the case of losses greater than 10% in a quarter, every subsequent quarter (except for the early 1980s) was a quarter of growth. Source: Bloomberg Finance LP Comparative chart of gold quantity in ETF funds and gold price
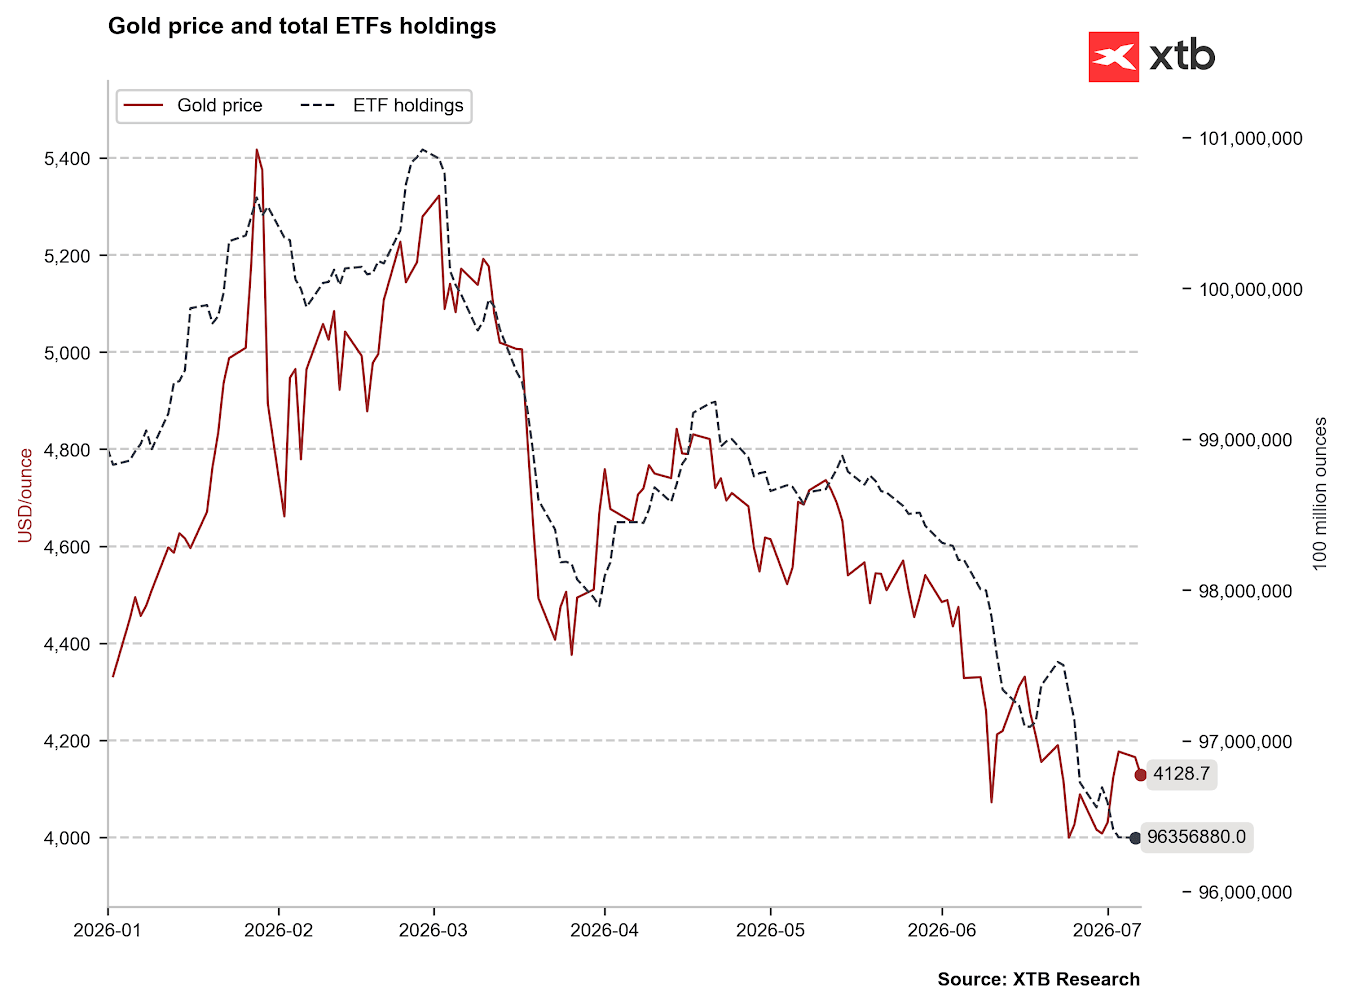
The amount of gold in ETF funds continues to fall. Purchasing power in the funds is highly correlated with expectations regarding US interest rates and the behavior of the US dollar. Source: Bloomberg Finance LP, XTB Natural Gas (NATGAS and TTF)
- In April, US gas prices fell to $2.5/MMBtu due to oversupply and record domestic production, which exceeded 110 Bcf/d monthly.
- By the end of June, shale production in the Permian and Haynesville regions rose to 112.5 Bcf/d.
- The rebound in prices in May (average $2.9/MMBtu) and at the end of June (futures contracts closed at $3.20) was driven by a heatwave covering two-thirds of the country, which increased demand from the power sector for air conditioning.
- In June, gas-fired power plants accounted for 44% of US electricity generation.
- Furthermore, the construction of an increasing number of data centers in the US indicates that US electricity consumption will continue to grow, although heating issues during the winter season will remain the main source of gas demand.
- The latest BNEF (Bloomberg) data, however, indicates that the potential for further increases in Henry Hub prices is limited by forecasts of cooler weather in the US. Gas inventories at the end of June were close to 3,000 Bcf, which is about 5% higher than the 5-year average.
- The US gas price is supported by the ongoing problem related to gas exports from the Persian Gulf, which keeps demand for US LNG at the highest possible level.
- The European gas market operates in drastically different, strained conditions. At the beginning of July, the TTF spot price fluctuated in the range of 44-47 EUR/MWh.
- Europe’s main problem is a severe storage deficit. At the beginning of July, EU inventories were only 46–50% full, while the 5-year seasonal average for this period is 65%.
- The supply situation is complicated by the paralysis of deliveries from Qatar; after the March attack on the Ras Laffan terminal, 17% of its production capacity was destroyed, and QatarEnergy extended the force majeure status until September, canceling, among others, 21 cargoes for Italy’s Edison.
- TTF gas prices are rebounding by about 4% to a level close to 46 EUR/MWh in response to recent reports regarding attacks on merchant ships carried out by Iran in the Strait of Hormuz. A Qatari LNG tanker, the Al Rekayyat, was reportedly damaged, which may halt further deliveries in the near future.
- Currently, the balance of the European market relies on continuous supplies from Norway for over 30% (approx. 332 million m³/d). However, the market fears planned maintenance shutdowns of Norwegian capacity in September, amounting to 71 million m³/d, which could make it difficult to fill storage facilities to the 90% level required by EU law.
- Additional demand pressure in Europe is generated by the heatwave in France, which forced the EDF energy company to drastically limit power generation from several nuclear reactors due to water temperatures.
Coffee (Arabica and Robusta)
- The coffee market in the last dozen or so months has been characterized by a collision of long-term bearish forecasts with sudden disruptions in current physical supply.
- As recently as June 9, Arabica futures prices fell to their lowest level in over 19 months (243 cents per pound) under the influence of USDA estimates forecasting record harvests in Brazil in the 2026/27 season at 71.9 million bags.
- The situation changed dramatically at the turn of June and July. Prices began a moderate rebound after the last rollover of futures contracts, and the last few sessions brought a massive price recovery.
- During the session on July 6, September Arabica contracts recorded an unprecedented one-day jump in the range of 15-18%, breaking the level of 350 cents per pound for the first time since the beginning of January, when we observed a sharp downward wave (the largest single-day movement since 2000), while Robusta rose by 8%, exceeding $4,100 per ton.
- The impulse was momentum buying and short-covering by funds in the face of the official formation of the El Niño weather anomaly in the Pacific (67% probability of a “Super El Niño” version), threatening the flowering of coffee trees.
- El Niño brings mixed weather to South America: intense and excessive rainfall in some regions, and considerable droughts in others. In the case of Arabica, we usually deal with rainfall that destroys crops and infrastructure.
- The main physical factor driving the current crisis was weather anomalies in Minas Gerais (the largest Arabica growing region in Brazil). Intense rainfall in June (in the week ending June 28, precipitation was almost 2,000% higher than the historical norm) made it impossible for machines to enter the fields and deteriorated bean quality, delaying the harvest to 52% (compared to 60% a year earlier). After the downpours, at the beginning of July, there was a drastic turn in the form of a complete lack of precipitation (0 mm) in Minas Gerais.
- Arabica stocks monitored by the ICE exchange fell to the lowest level in over 2 years. At the same time, in Vietnam (a key Robusta producer), farmers are struggling with the drought from the beginning of the year and a drastic annual increase in fertilizer and fuel costs by 30% and labor by 33%, even though the USDA report forecasts an increase in local production by 2.5% to 32.5 million bags in the new season.
The chart shows daily price changes for Arabica
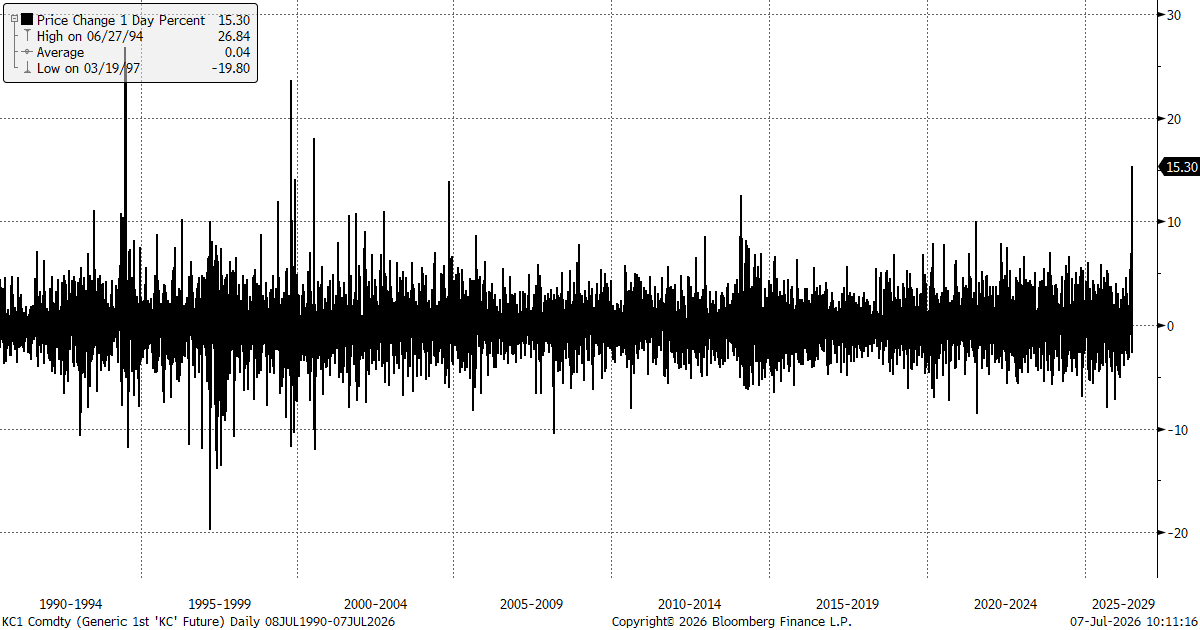
The price of Arabica rose by over 15% at the beginning of the new week in July and was the largest daily increase since 2000. Source: xStation5 The chart showing coffee price behavior since the start of a strong El Niño
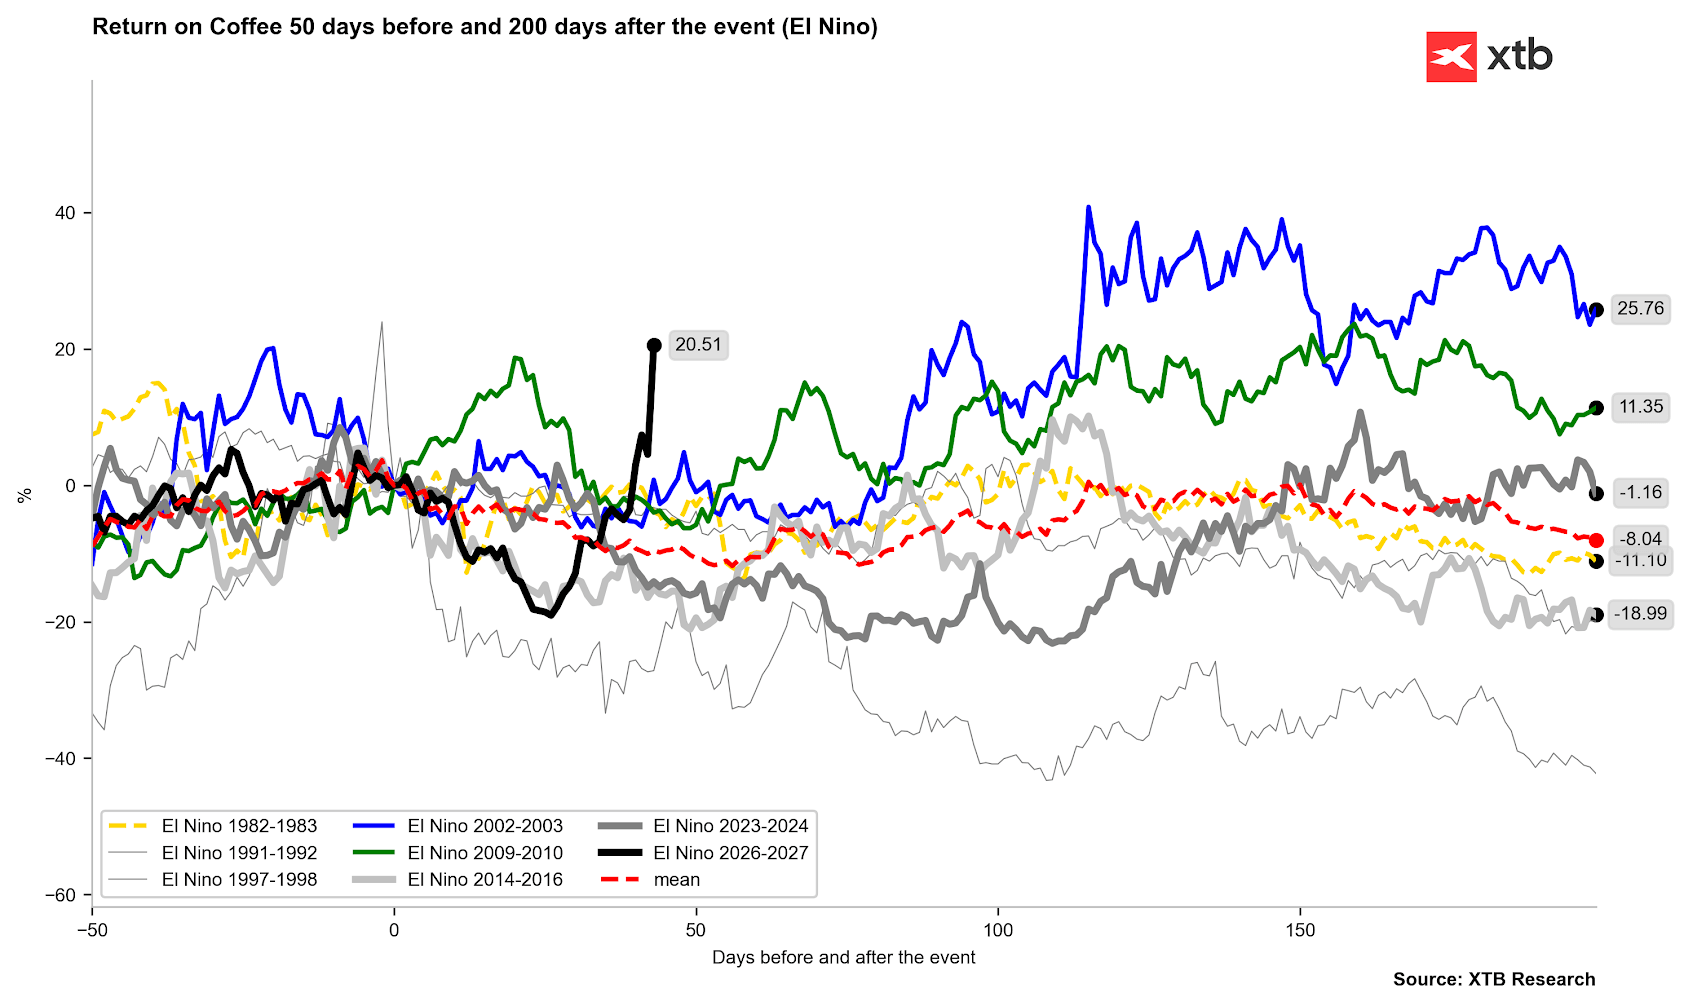
As you can see, in the case of coffee, there is no single obvious trend during the formation of El Niño. El Niño usually has a positive effect on coffee prices in the first phase (in 1997, when we had the previous major El Niño, the increase in coffee prices essentially ended at the turn of May and June). Source: Bloomberg Finance LP, XTB The chart illustrates changes in Arabica coffee prices in individual months
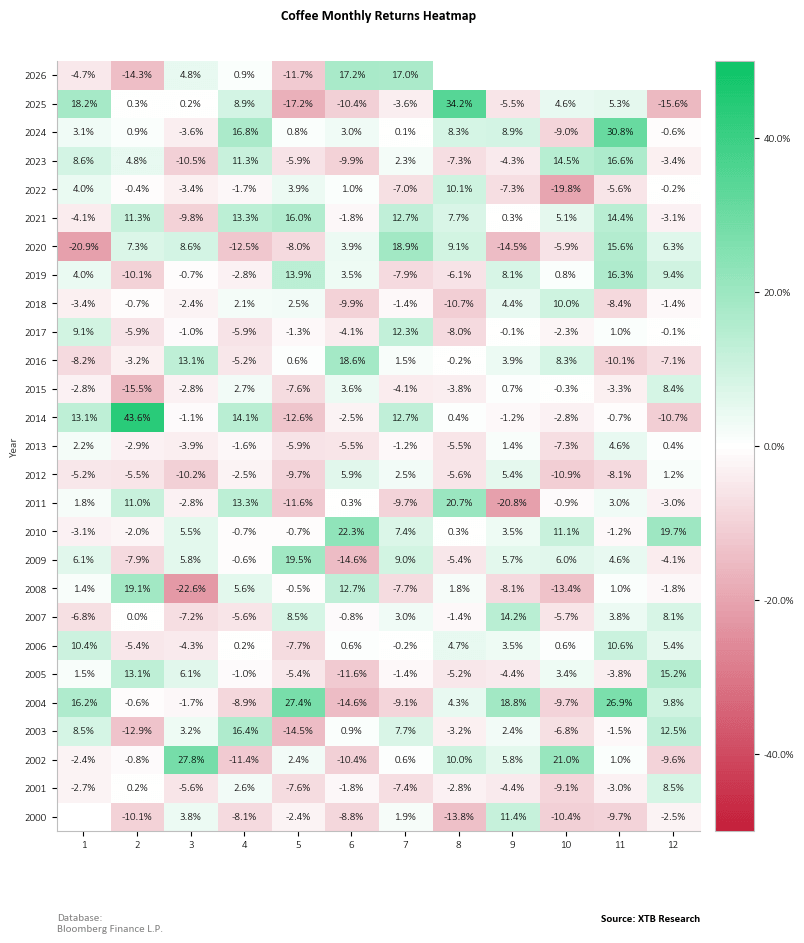
Coffee prices have been rising very sharply for the second month in a row. It is worth noting that August has been one of the best months of the year in recent years. If this seasonality were to repeat, the next month could bring a continuation of increases. Source: Bloomberg Finance LP, XTB The chart shows coffee price behavior relative to averages and deviations from them
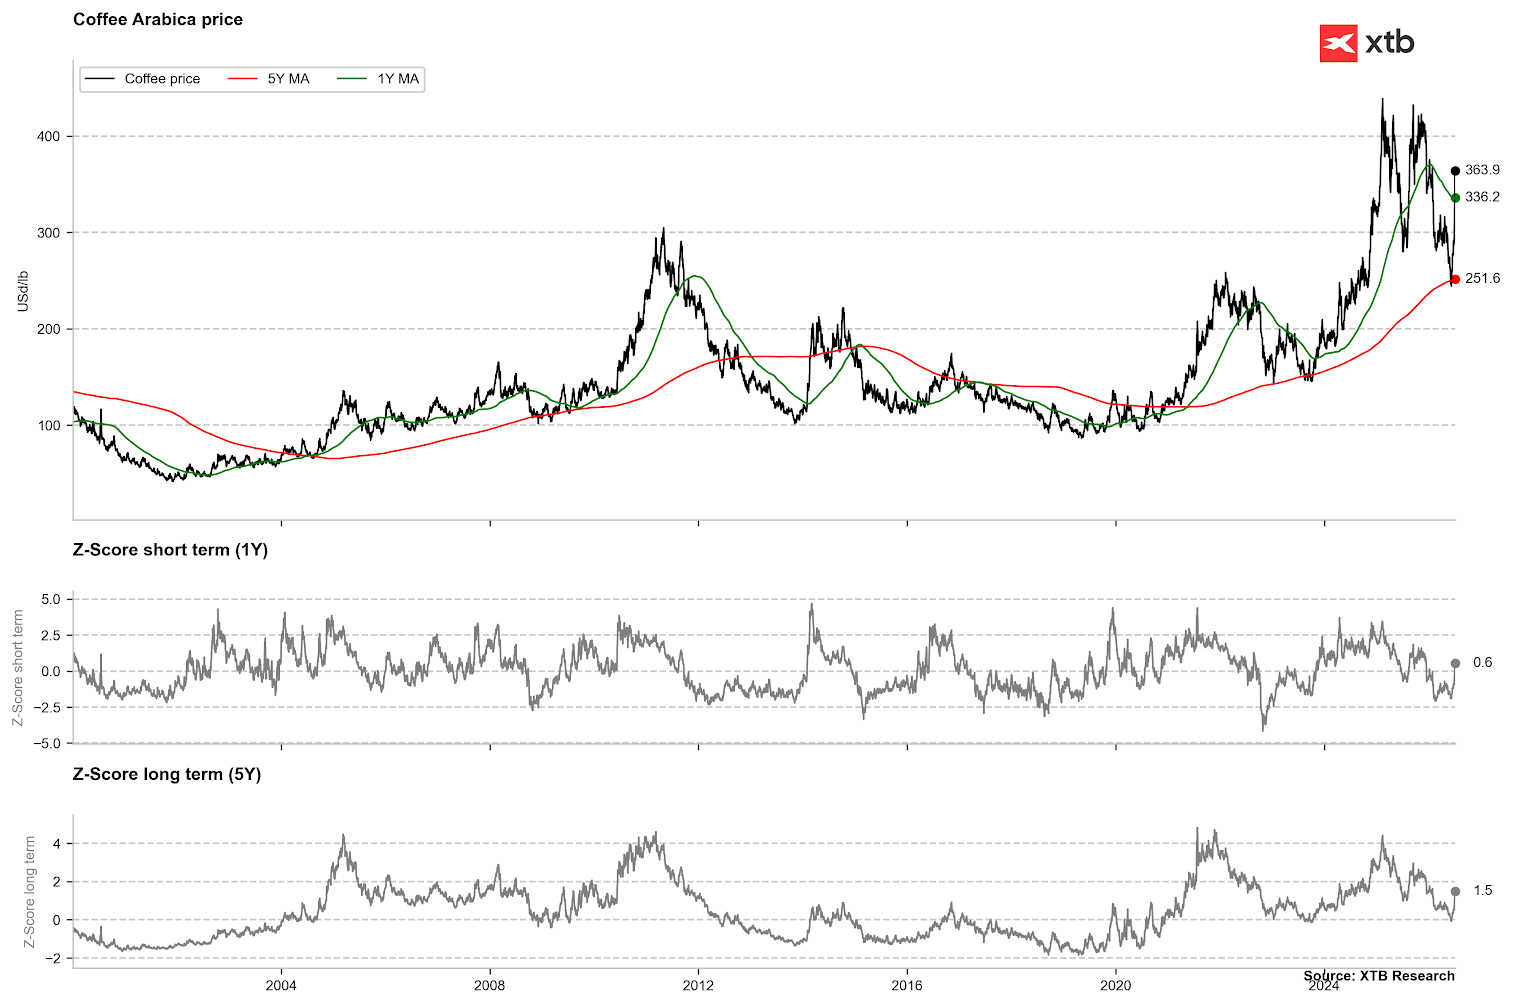
The price of coffee is rising very sharply after rebounding from the 5-year average. A similar situation occurred at the end of 2023. At that time, the price entered a long-term upward trend, which ended with prices rising to almost 440 cents per pound. Source: Bloomberg Finance LP, XTB The chart shows coffee price seasonality over the last 5 years
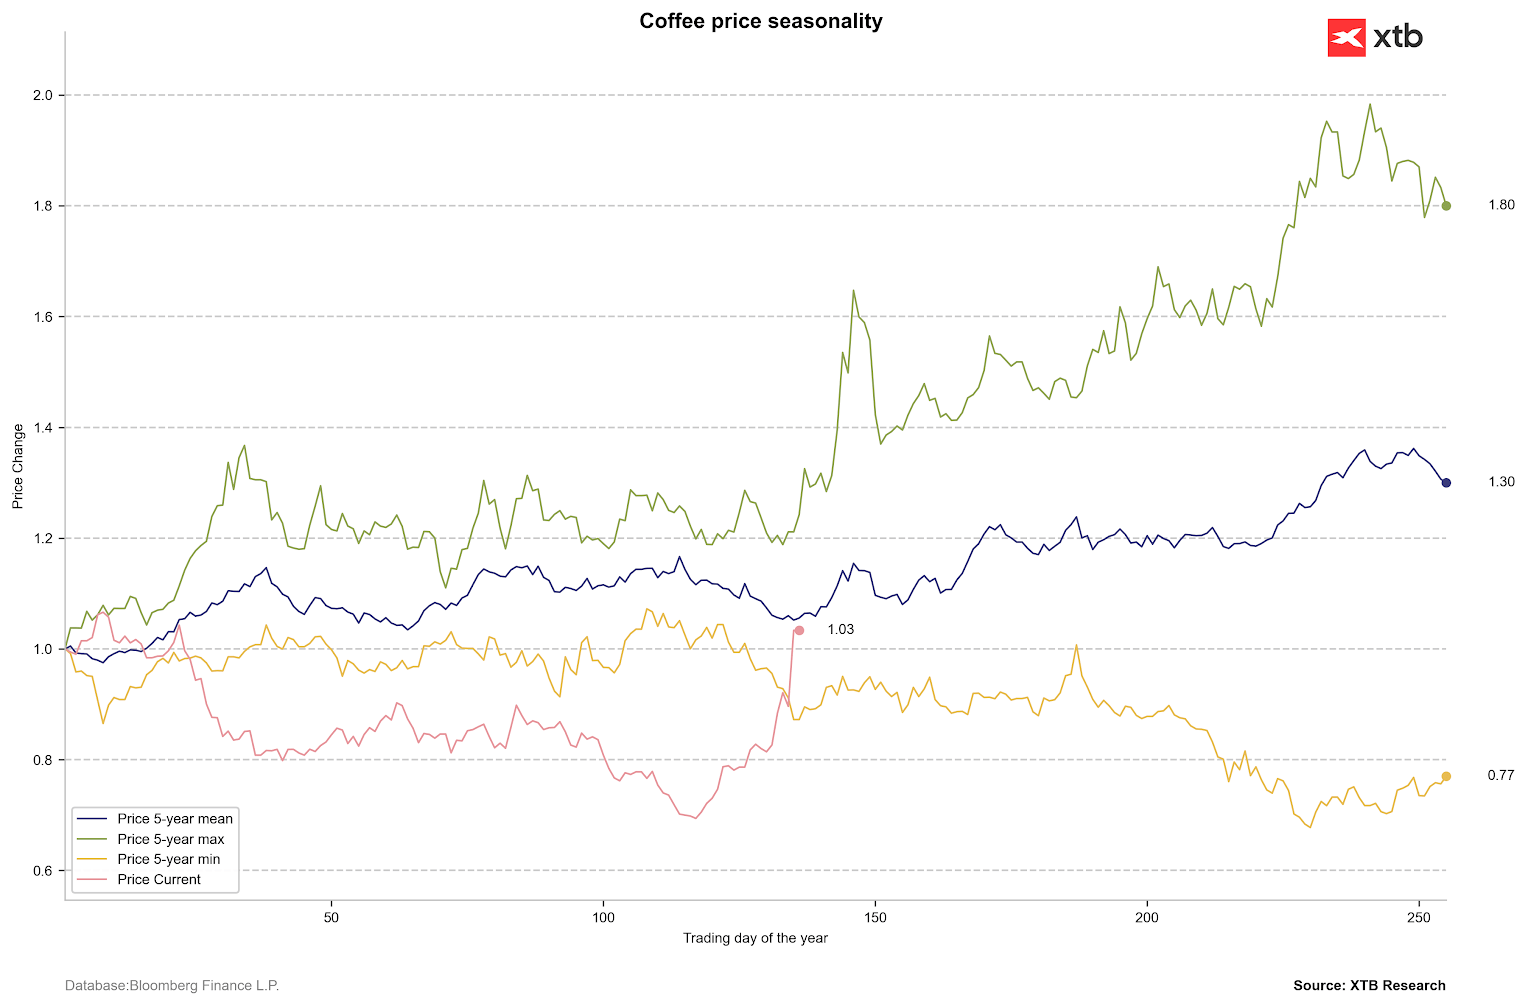
Looking at the 5-year average, we observe growth potential even until the end of this year. Before the rebound in the last 30 days, we observed the worst price change in at least 5 years. Source: Bloomberg Finance LP, XTB The chart shows the change in coffee inventories (inverted axis) on exchanges and coffee prices themselves
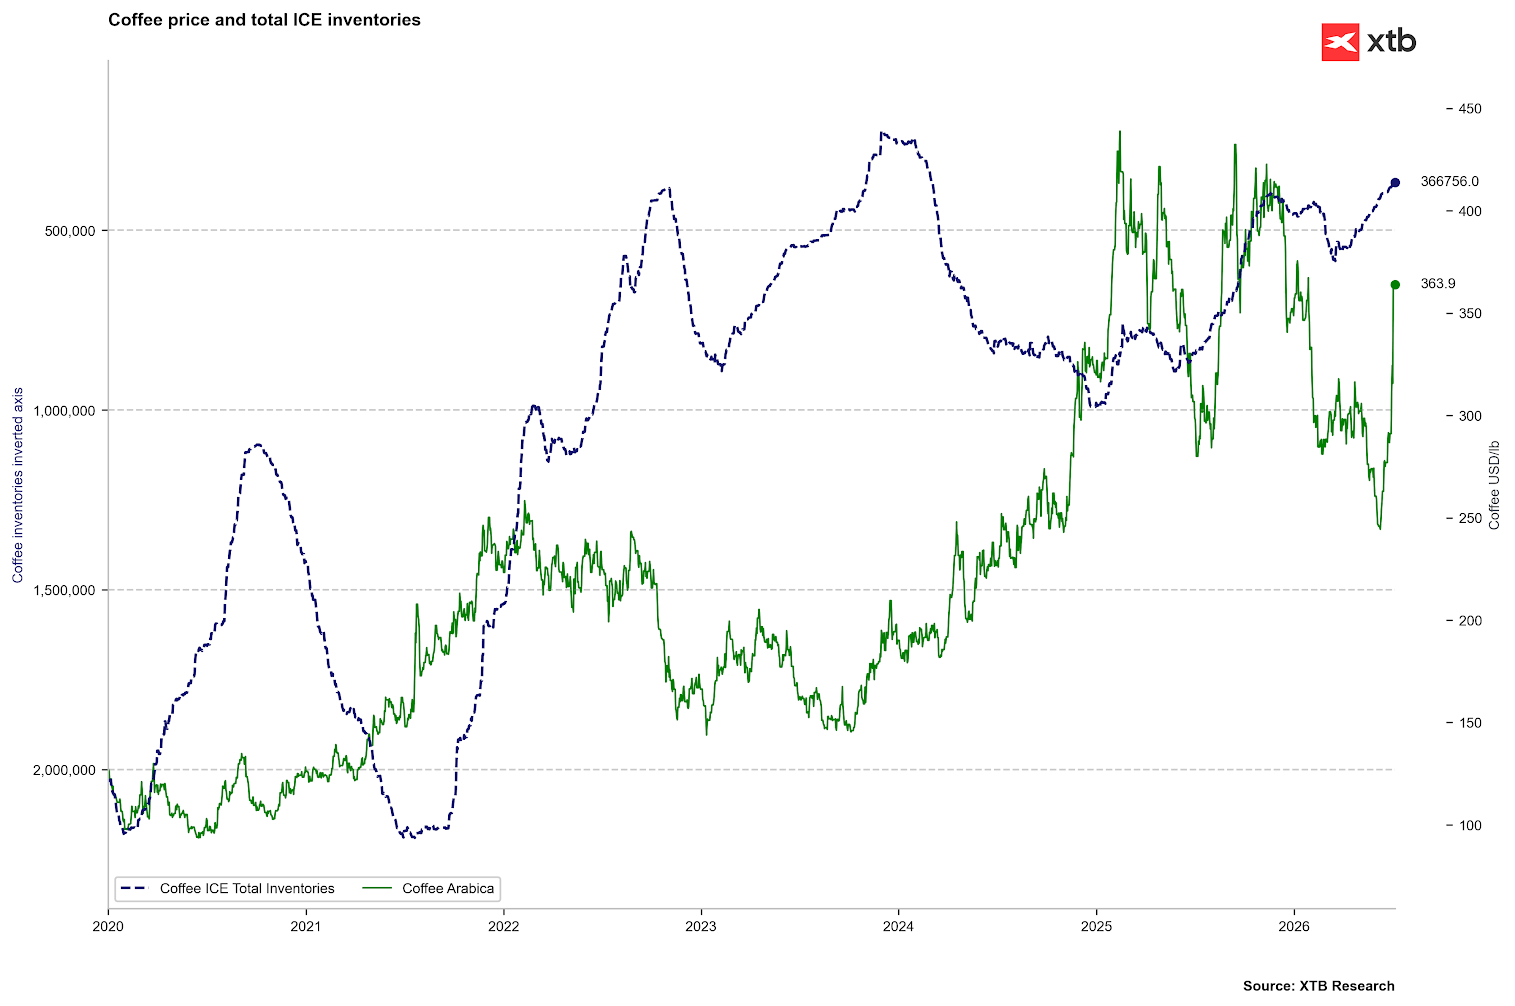
Coffee stocks tracked by ICE have been falling since almost the beginning of this year and reached their lowest level since 2024. Source: Bloomberg Finance LP, XTB The chart shows the change in stocks according to ICE and global ending stocks according to USDA.
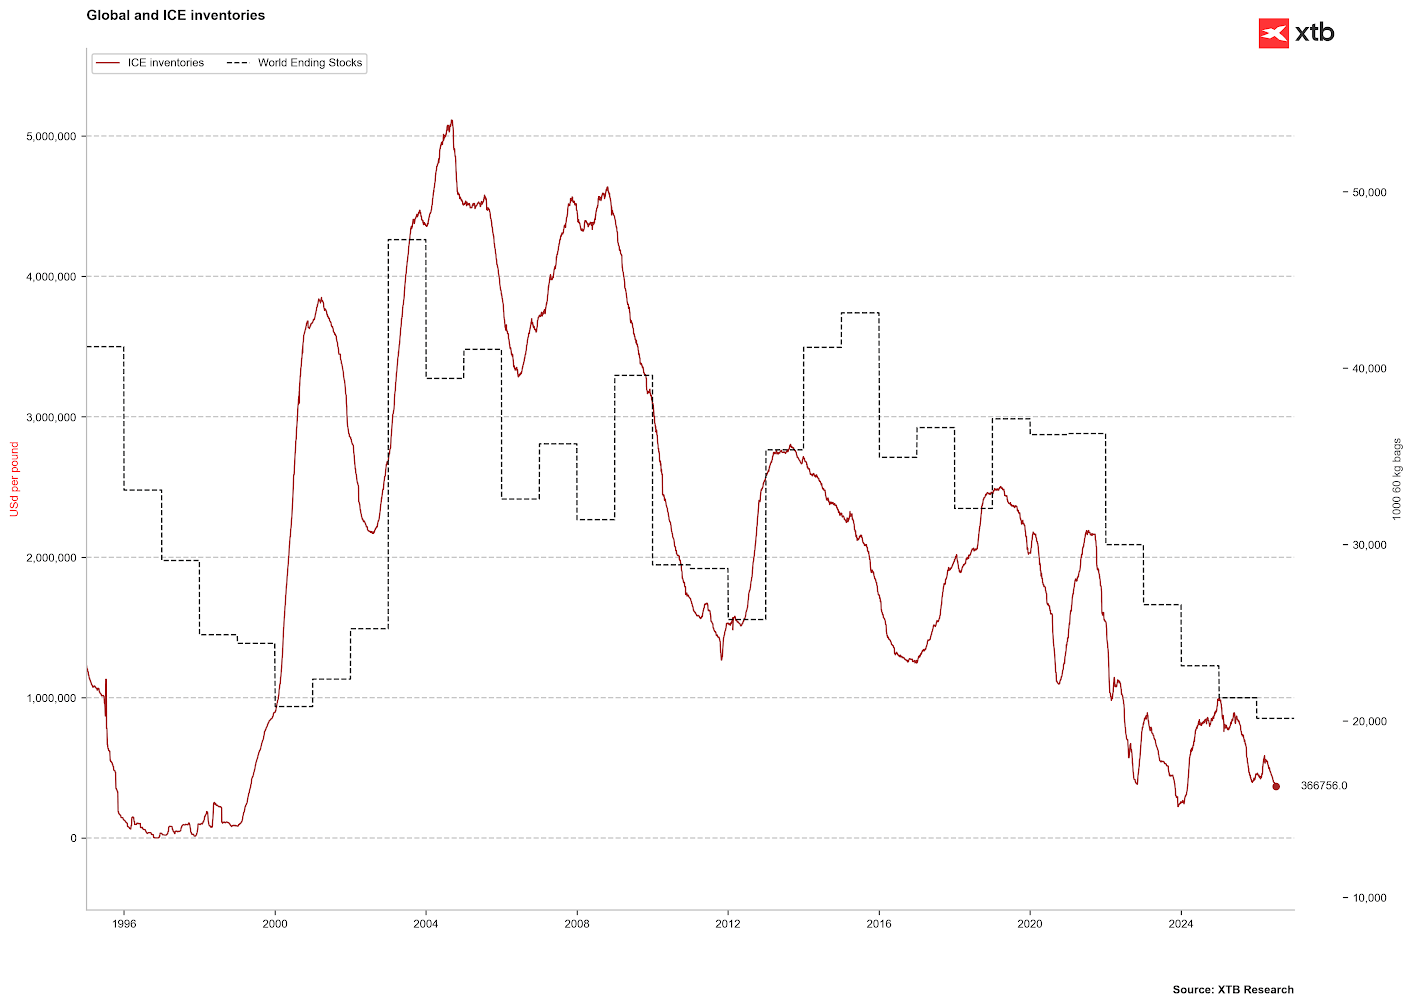
Despite the expectation of record production in Brazil, ending stocks are expected to fall below 2000 levels. Source: Bloomberg Finance LP The chart shows the price rebound from 2026 compared to the situation in 2014
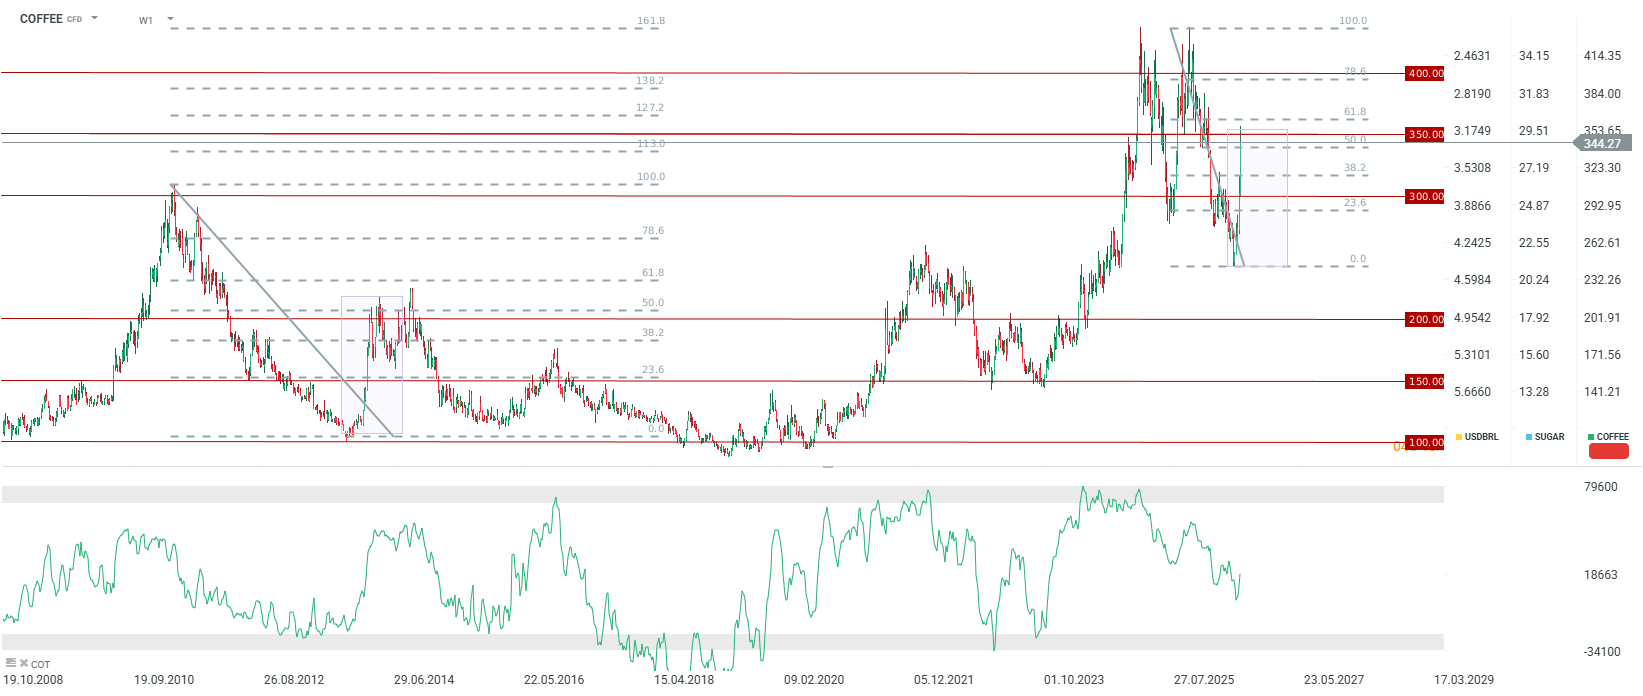
The dynamics of the price rebound are very similar to what we observed in 2014. At that time, the rebound amounted to about 50% of the previous downward wave. Source: xStation5 Cocoa
- After a record price increase in 2024 to a level close to $13,000 per ton, the cocoa market experienced a spectacular collapse. At the beginning of April 2026, spot prices momentarily plunged to $3,000 per ton in response to deep demand destruction.
- Confectionery producers limited purchases, and Q1 data confirmed a 7.8% y/y drop in European processing (grindings) (the lowest result in 17 years).
- Next week, on July 16, we will learn data on European processing, which may determine the continuation or challenge of the recent spectacular price rebound.
- In response to the crash in 2025 and the first half of 2026, the governments of Côte d’Ivoire and Ghana drastically reduced the official guaranteed prices for farmers (farmgate) by 57% and 30%, respectively. However, the rigid minimum prices diverged from the market valuation, and international companies refused to buy at the old rates. This led to the blocking of unsold stocks in ports (over 330,000 tons in Ghana and goods worth almost $0.5 billion in Côte d’Ivoire) and a deep liquidity cut-off for local regulators (COCOBOD, PBC). The cocoa held in inappropriate conditions began to rot in warehouses, which led to limiting the potential for further inventory growth.
- A sharp increase occurred at the beginning of July. During the session on July 6, the September contract in New York soared by about 13-14% to $5,700 per ton (reaching a 6-month high). Powodem są nadmierne deszcze w Afryce Zachodniej, które podtopiły drogi transportowe oraz wywołały epidemię chorób drzew.
- The CFTC report for the week ending June 30 showed that money managers heavily reduced their bearish bets. Short positions were reduced not only on the London market but also in New York, although non-commercial positioning still remains negative.
The chart shows speculators’ positioning in the New York cocoa futures market
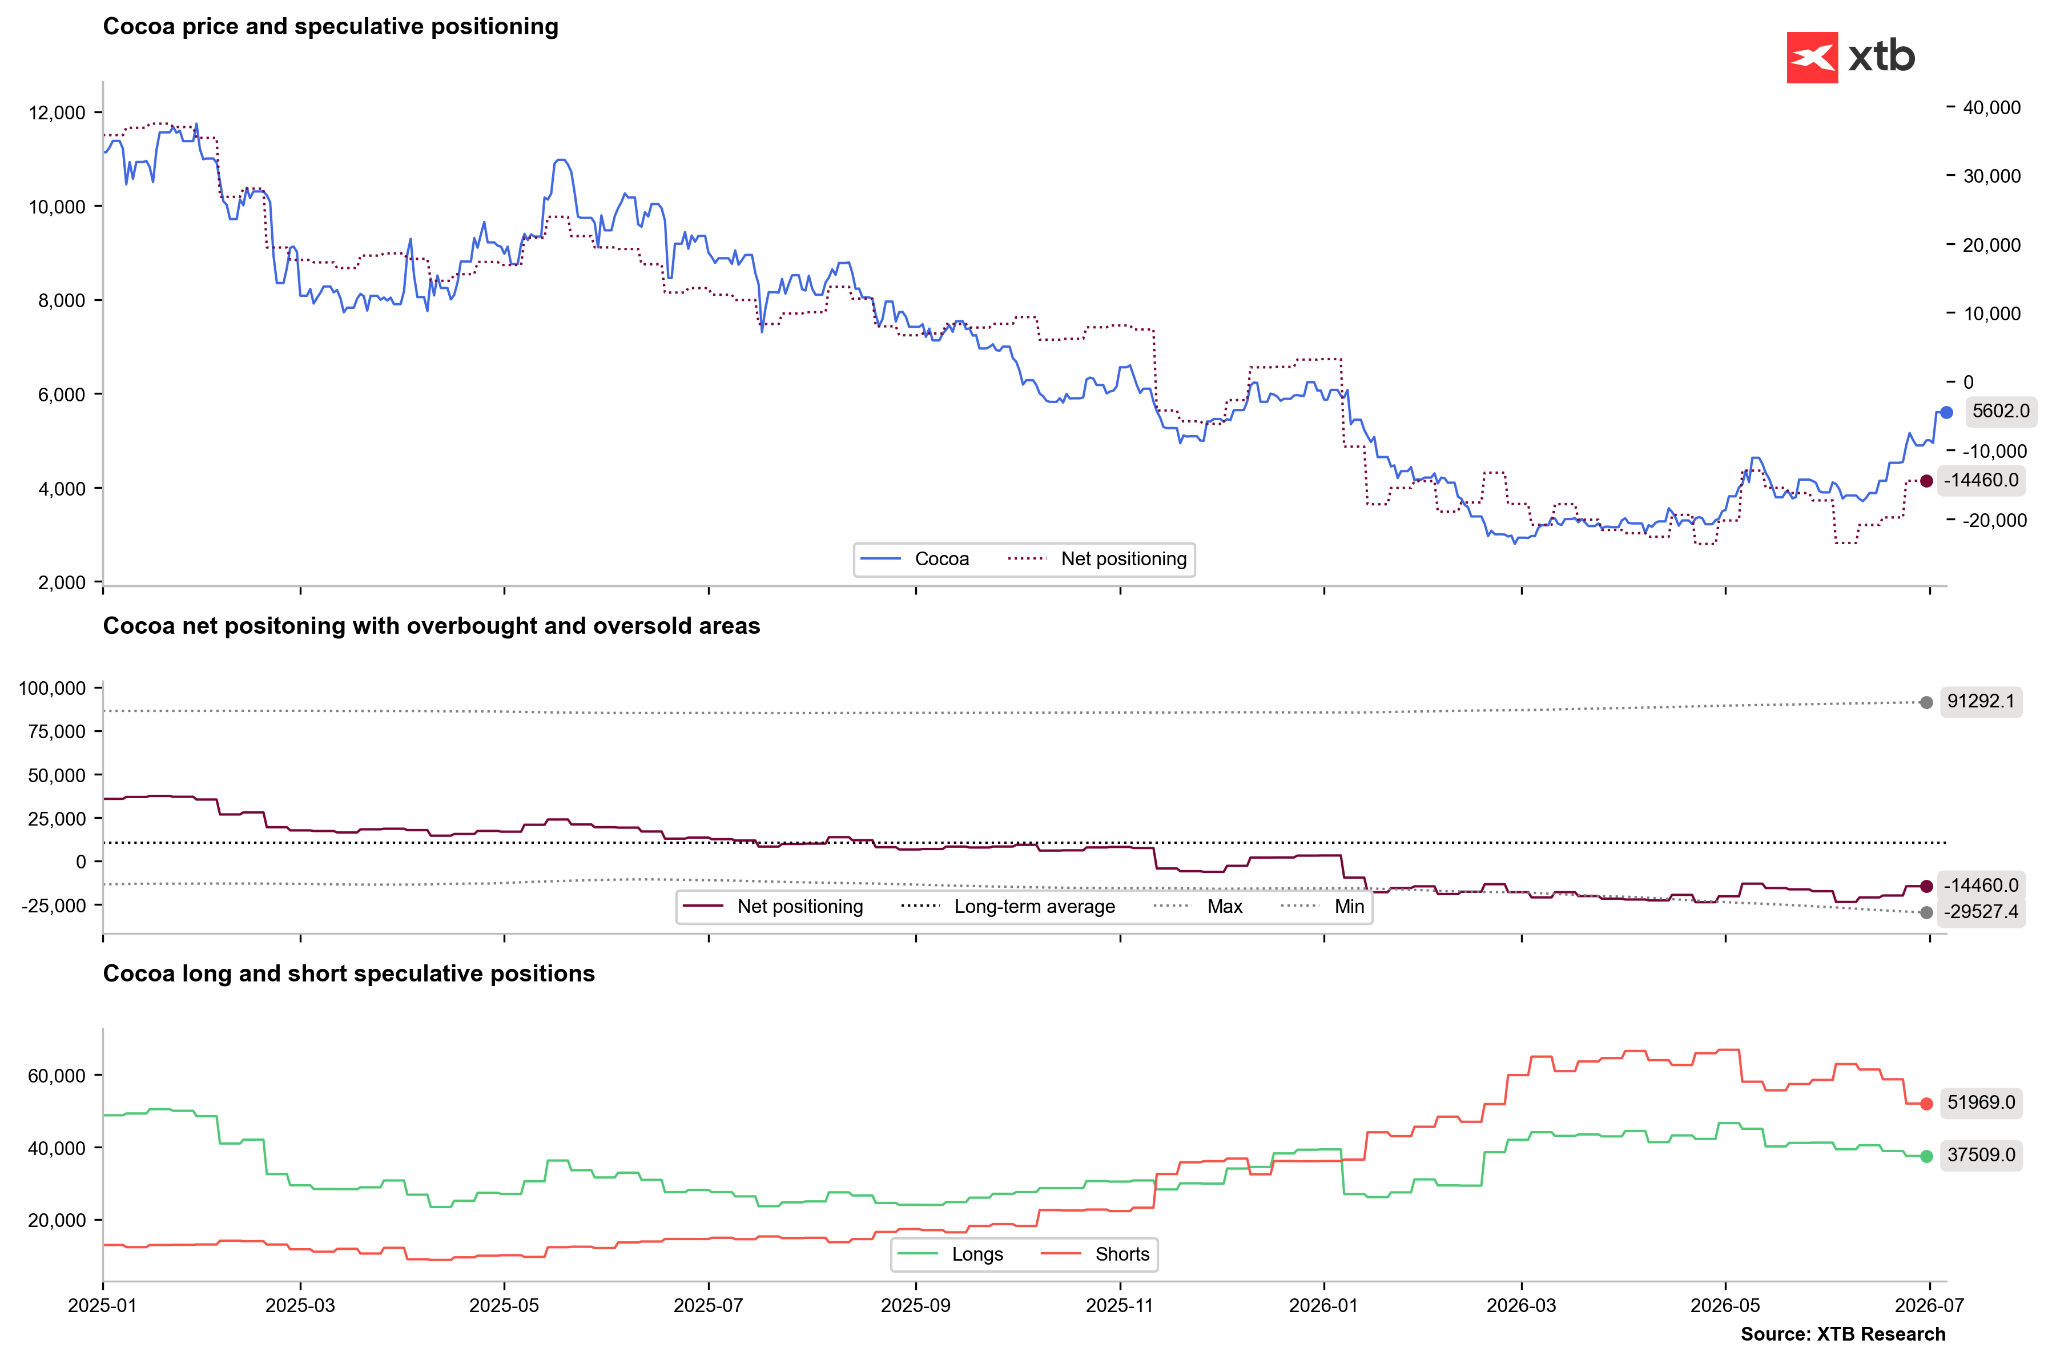
We are seeing a clear reduction in short positions, although net positions still remain clearly negative. The open interest itself is also decreasing.
Source: Bloomberg Finance LP, XTB The chart shows speculators’ positions on cocoa in the London futures market
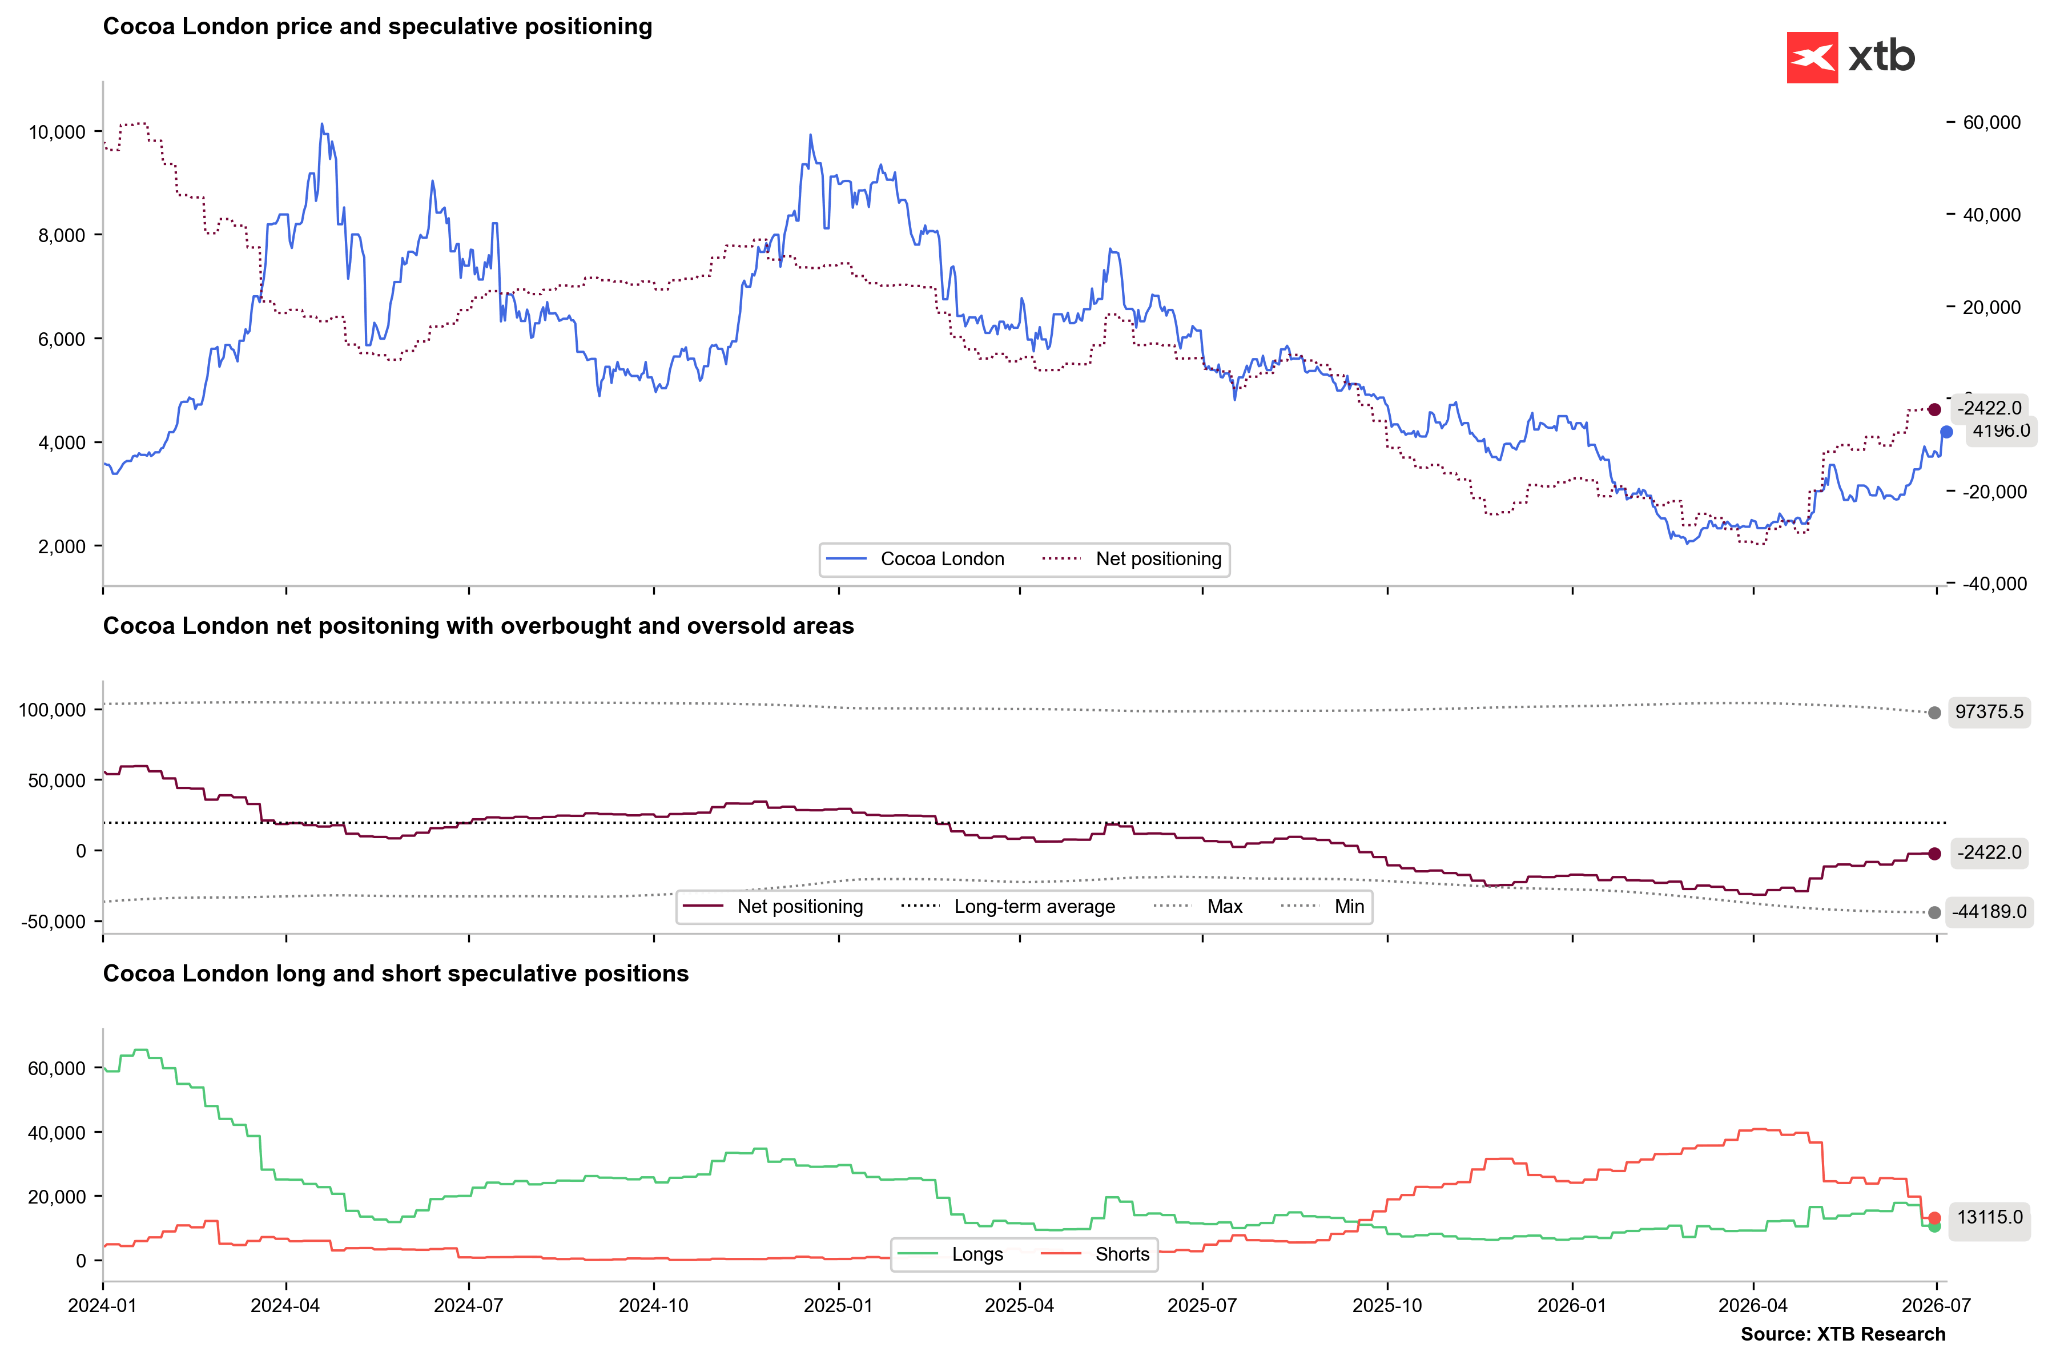
Short positions on cocoa in London have been reduced to the lowest level since autumn 2025.
Source: Bloomberg Finance LP, XTB The chart shows cocoa prices compared to moving averages
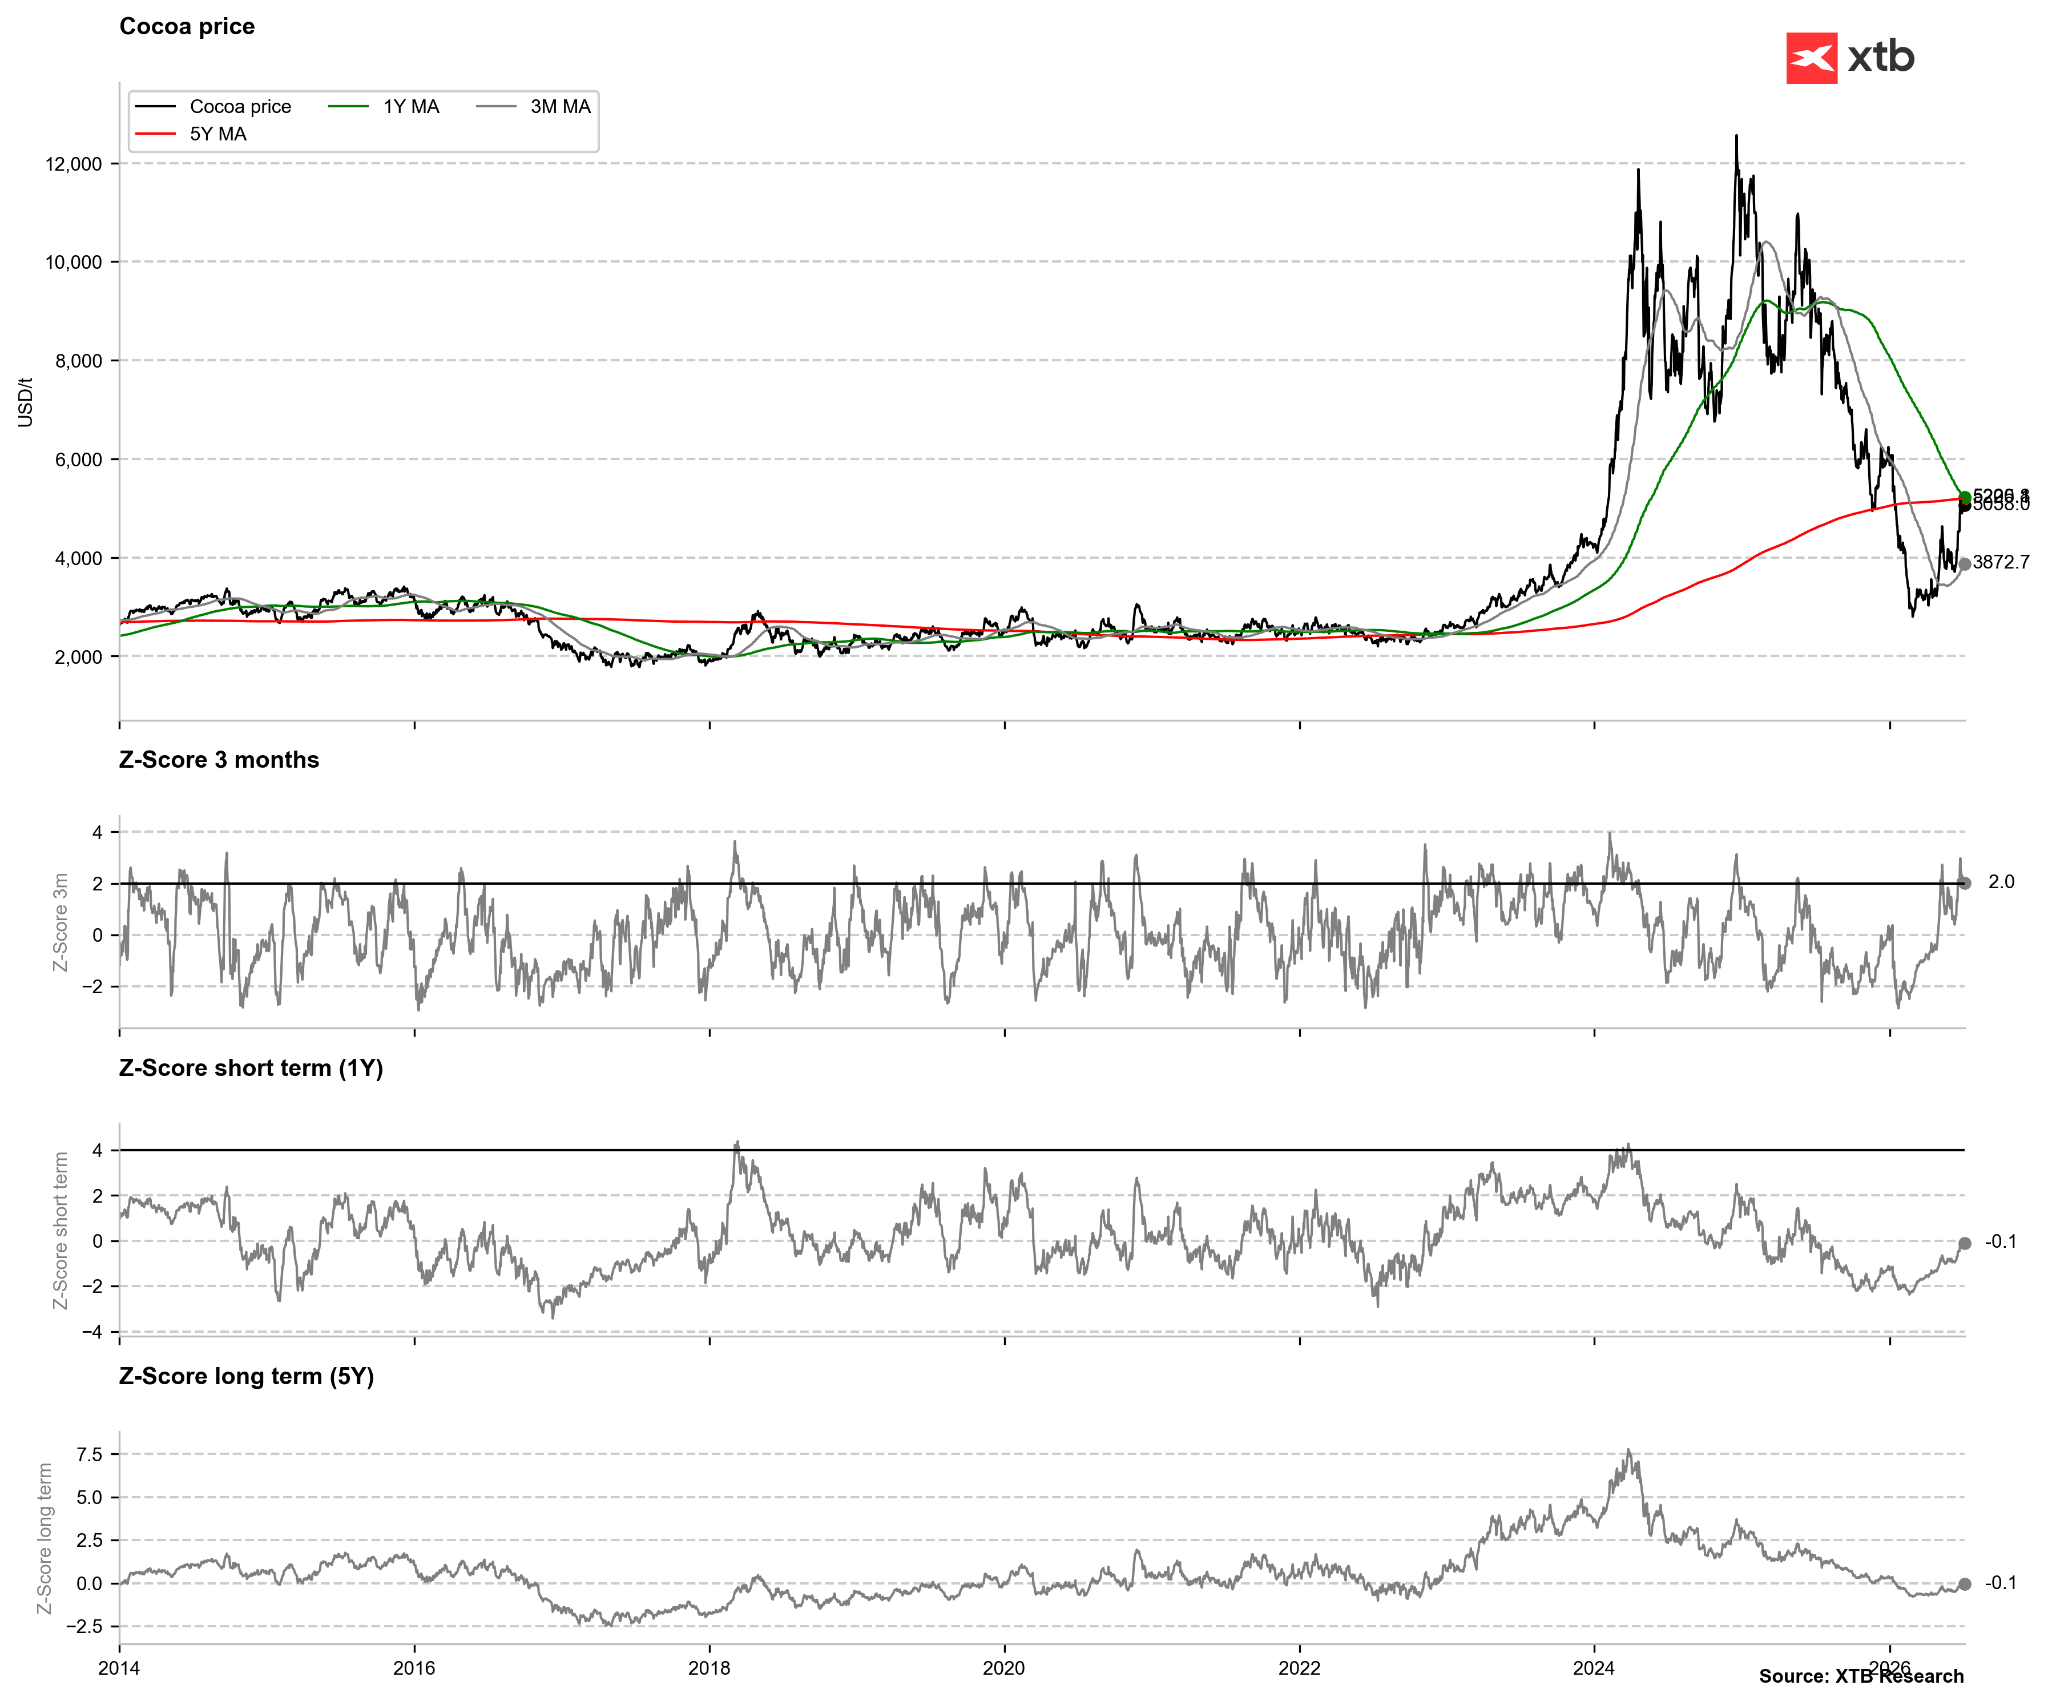
Cocoa prices are currently testing the 1-year and 5-year averages, and the deviation from the 3-month average indicates excessive short-term overbuying.
Source: Bloomberg Finance LP, XTB The chart shows a comparison of cocoa prices with inventories tracked by ICE (inverted axis)
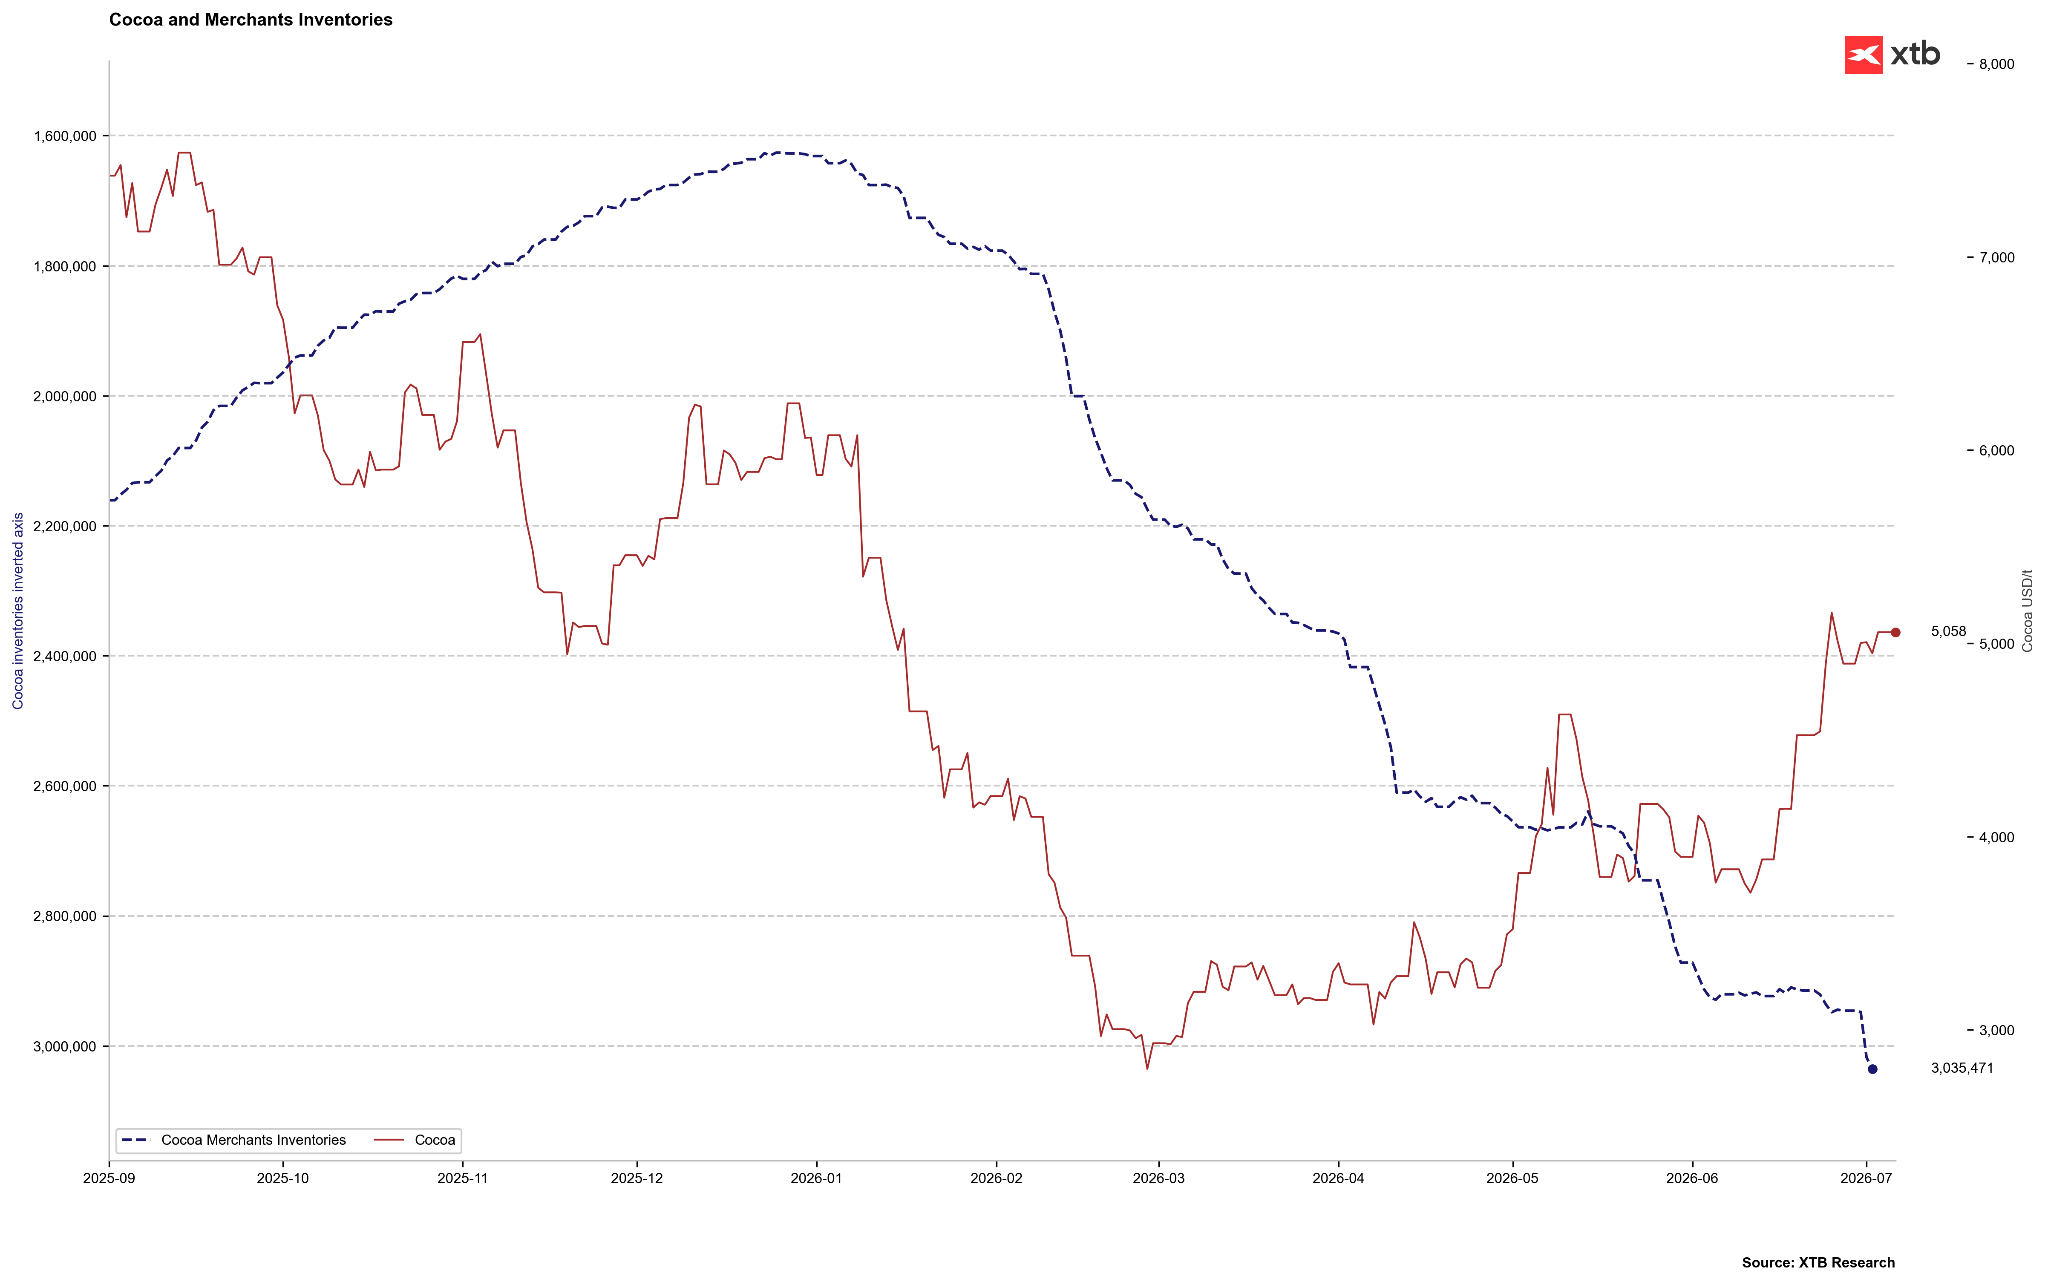
Stocks tracked by ICE have clearly increased recently, despite seasonality indicating that we should reach the peak moment. If inventories continue to rise, the recent price increase may turn out to be excessive. The key moment for cocoa will be the European processing data on July 16.
Source: Bloomberg Finance LP, XTB The chart shows the cocoa price chart
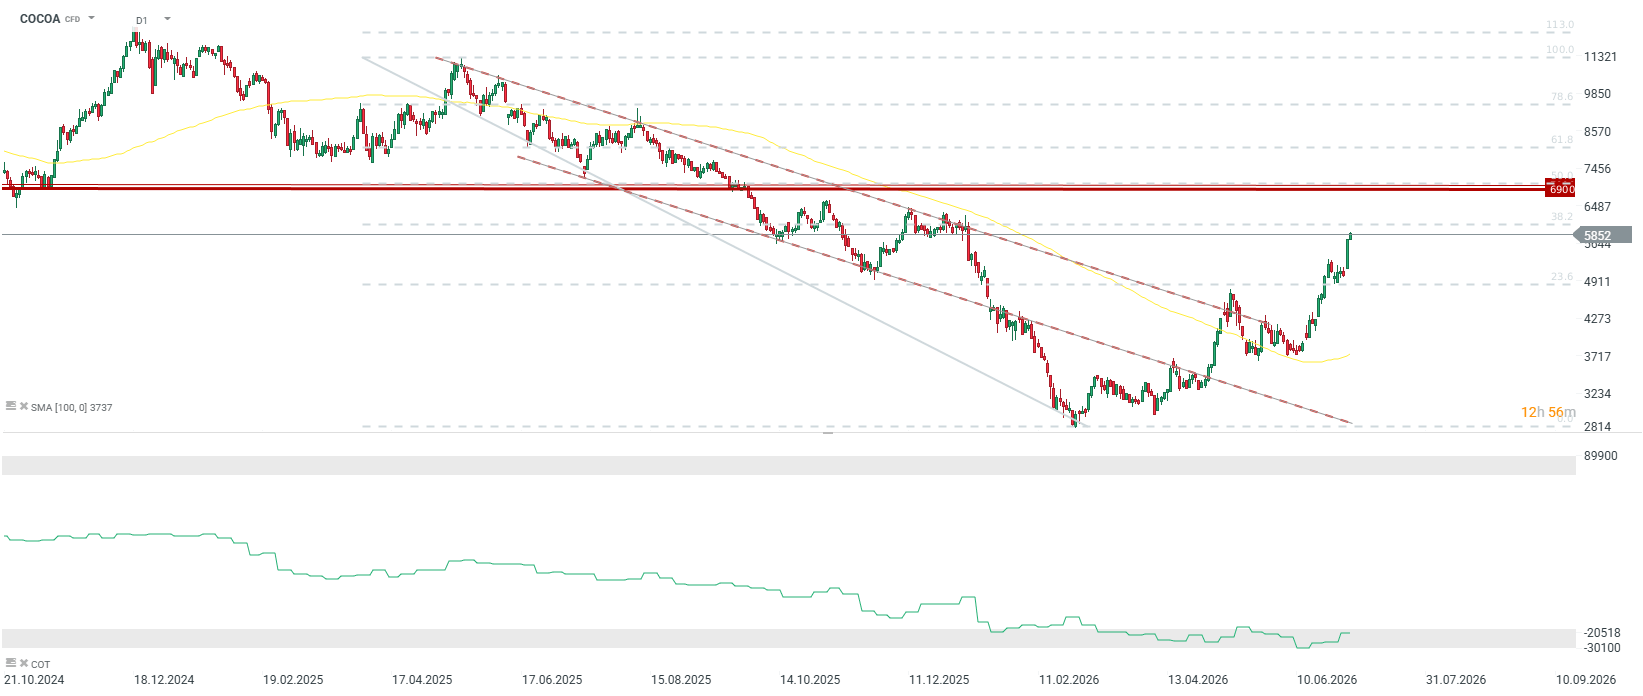
The cocoa price has already increased by almost 100% from its local low in February (not including the rollover of futures contracts). Key resistance is around $7,000 per ton, where the 50.0 retracement of the last full downward wave is located.
Source: xStation5 The chart shows changes in cocoa price during periods of strong El Niño
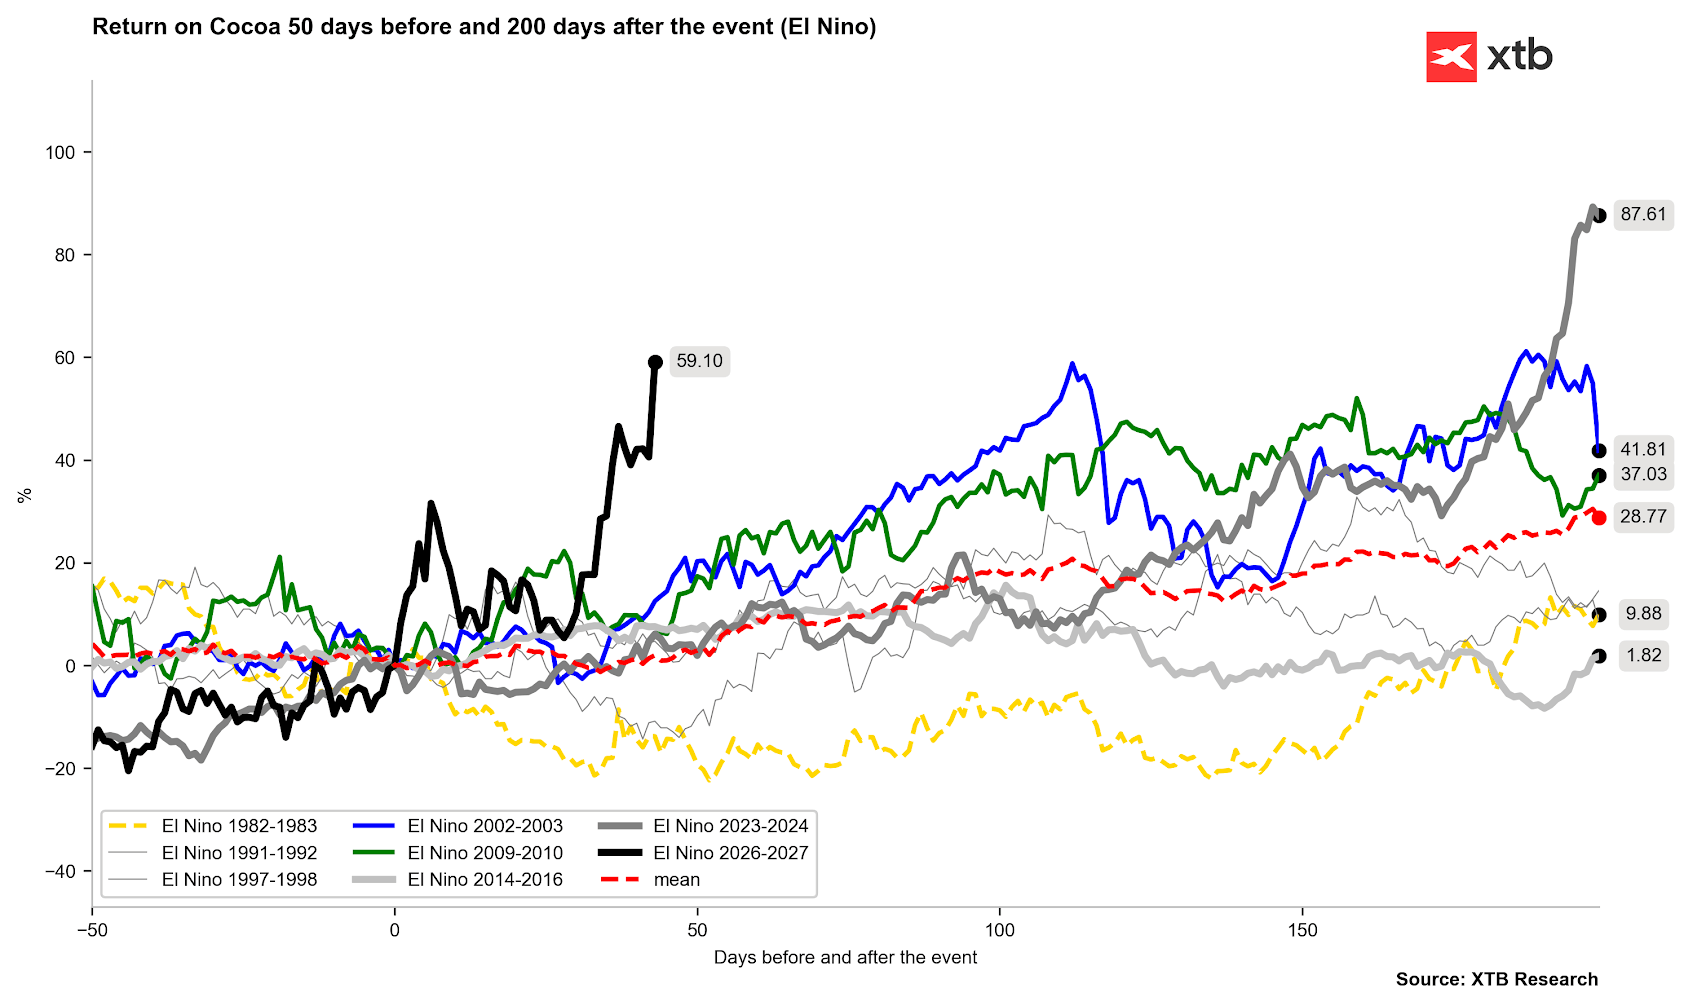
The current change in cocoa prices is significantly stronger than during previous El Niño periods, which may be an exaggerated upward movement, considering demand problems. On the other hand, if there has been actual destruction of supply, it may turn out that even weak demand will have trouble accessing the commodity.
Source: Bloomberg Finance LP, XTB