S&P 500 — US Large Cap Index
 FTSE 100 — UK Blue Chips
 Euro Stoxx 50 — Eurozone Leaders
 DAX 40 — German Equities
 CAC 40 — French Market Index
 Nikkei 225 — Japan Benchmark
 Hang Seng — Hong Kong Index
 Shanghai Composite — China Mainland
 ASX 200 — Australian Market
 TSX Composite — Canada Index
 Nifty 50 — India Large Cap
 STI Index — Singapore Market
 KOSPI — South Korea Index
 Bovespa — Brazil Equities
 JSE Top 40 — South Africa Index
 IPC Index — Mexico Market

Key takeaways
- The Strait of Hormuz crisis remains the primary risk factor for the energy markets, with the potential to drive Brent oil prices toward $120 per barrel if no diplomatic breakthrough is reached.
- The upcoming transition in Fed leadership—with Kevin Warsh expected to succeed Jerome Powell—signals a significant shift toward balance sheet reduction and active interest rate management, fueling market uncertainty.
- The UAE’s decision to leave OPEC on May 1st is a major shift that could lead to higher production in the future, even as global LNG markets remain tight due to ongoing naval blockades.
- While silver and cocoa are currently facing downward pressure due to weak demand, rising production costs (fertilizers, freight) and supply risks suggest a potential price recovery in the second half of the year.
Oil:
- Iran reportedly presented a plan to the United States to reopen the Strait of Hormuz , assuming the lifting of the naval blockade and postponing nuclear negotiations.
- According to Trump , Iran has 3 days left before logistical problems related to extraction and storage occur.
- Major American media outlets pointed to a timeframe of approximately 15–30 days before storage issues arise.
- According to Bloomberg , Iran’s storage will be full within 12–22 days . Currently, Iranian exports have fallen below 0.5 million bpd . After May 15 , production may potentially need to be cut by 1.5 million barrels per day .
- The UAE has decided to leave OPEC as of May 1 , which potentially signals higher production and a shift in regional dynamics in the future.
- Iran has the capability to transfer oil via the Caspian Sea , but so far this route has been used for swaps: oil from Caspian countries went to Iranian refineries, while Iran exported oil from the Persian Gulf on their behalf.
- Iran wants to introduce a fee system for oil transport through the Strait of Hormuz. Authorities have already ordered the opening of 4 accounts in various currencies at the central bank.
- Previously, it was suggested the fee would be around $1 per barrel . This is a relatively low amount compared to insurance costs, which currently reach up to a dozen dollars. On the other hand, agreeing to these fees would seal Iran’s control over the Strait.
- Goldman Sachs raised its forecast for Brent/WTI to $90/$83 per barrel due to production outages in the Persian Gulf. GS also points to a return to relatively normal exports by the end of June.
- GS indicates that production shutdowns could reach 14.5 million bpd by the end of April, with a global supply drop of 11–12 million bpd.
- In an extreme scenario , where exports return to normalcy at the end of July, the average price in Q4 could reach $100 per barrel (Brent) . A “black scenario” involving permanent capacity reductions could lead to $120 by the end of the year .
- Crack spread 3-2-1 has essentially doubled to $52 per barrel , suggesting possible demand destruction .
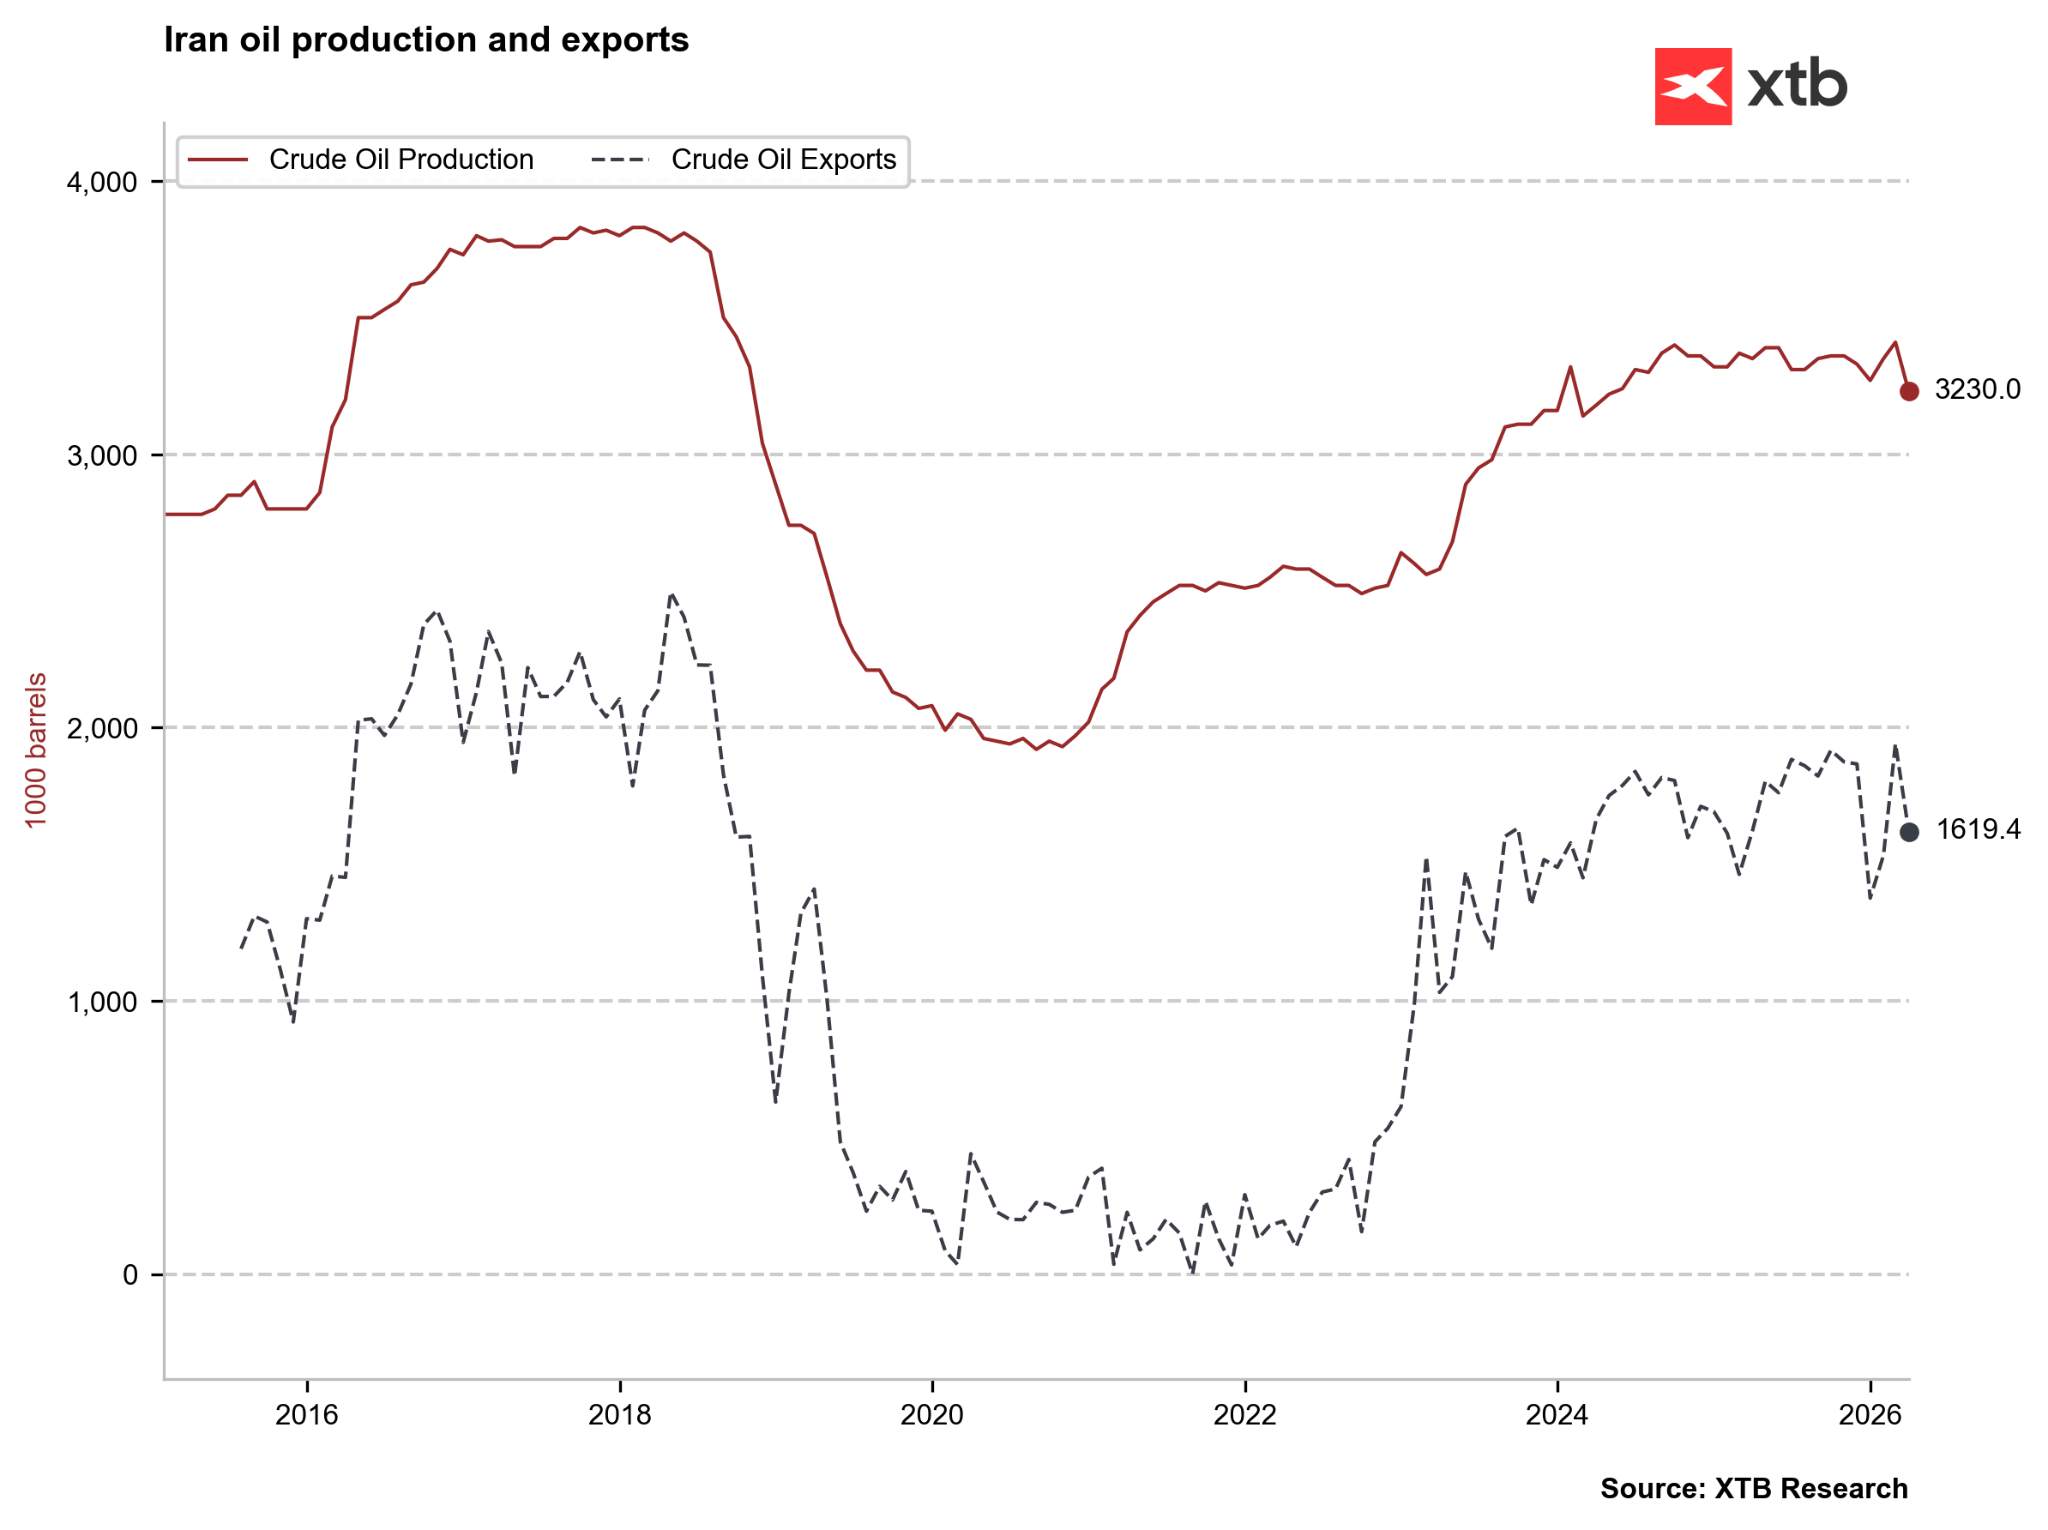
If no agreement is reached by mid-May, production in Iran could fall even faster than after 2016. Exports have already dropped to approx. 0.5 million bpd. Source: Bloomberg Finance LP, XTB
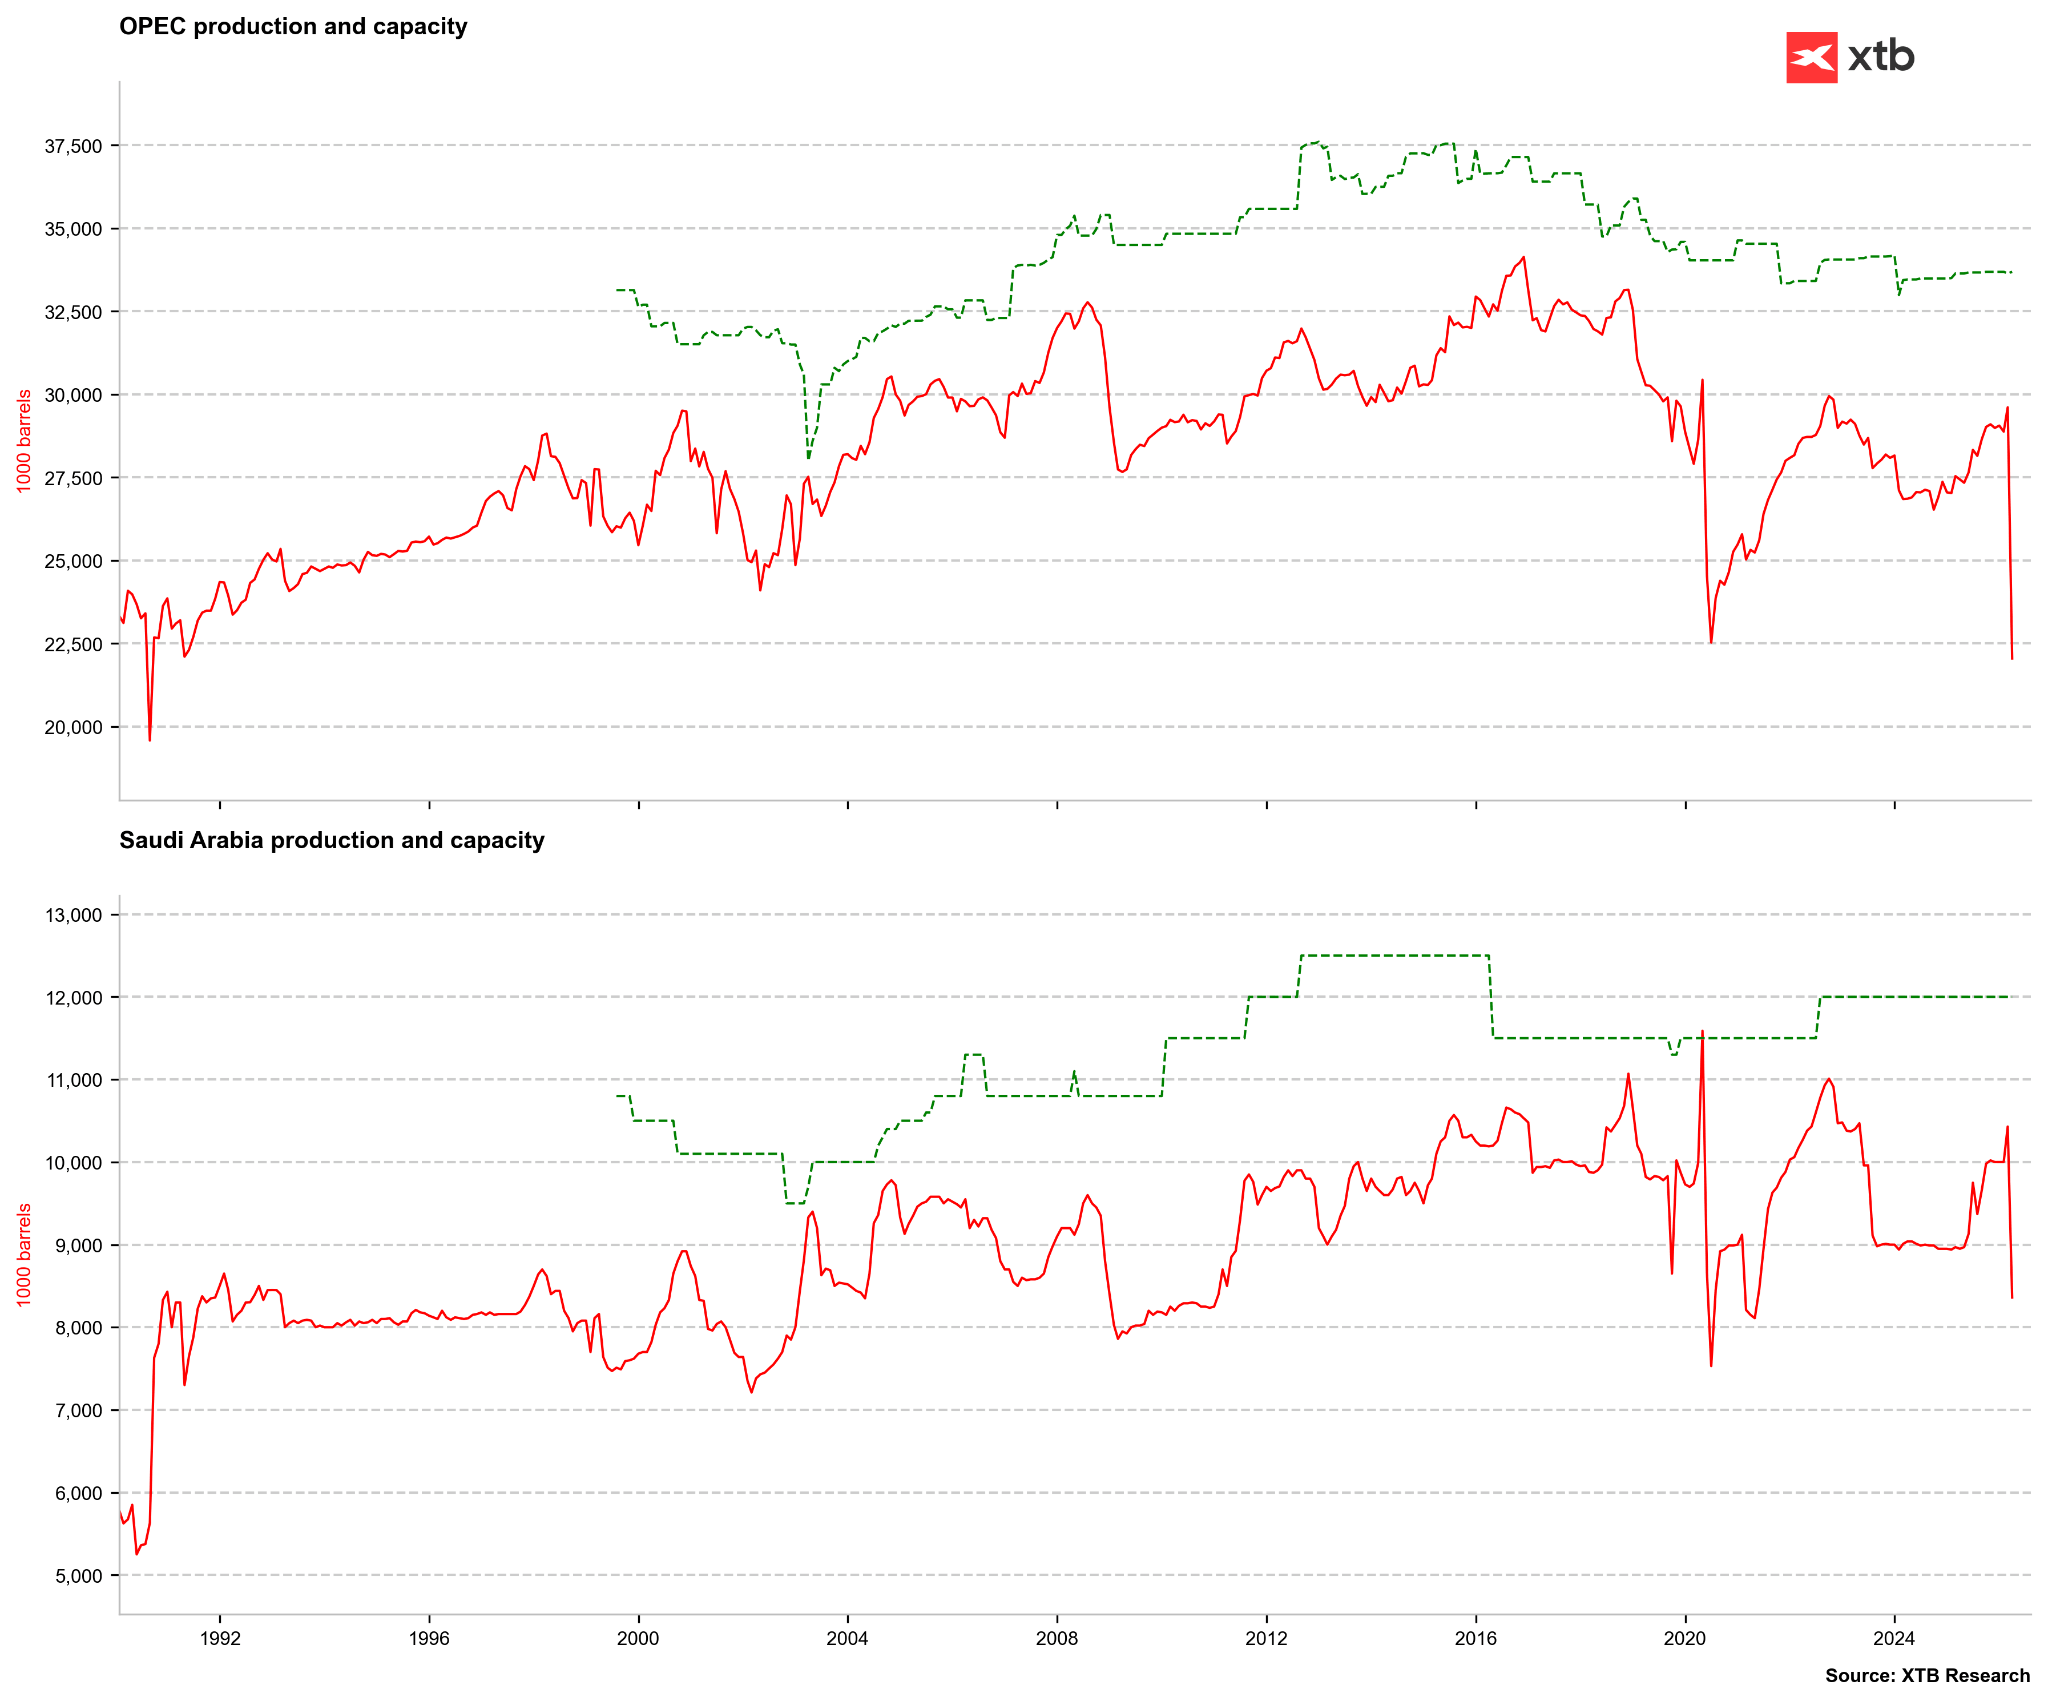
OPEC production for April may show a drop well below 20 million barrels per day, the lowest level since the Gulf War in the early ’90s. Source: Bloomberg Finance LP, XTB
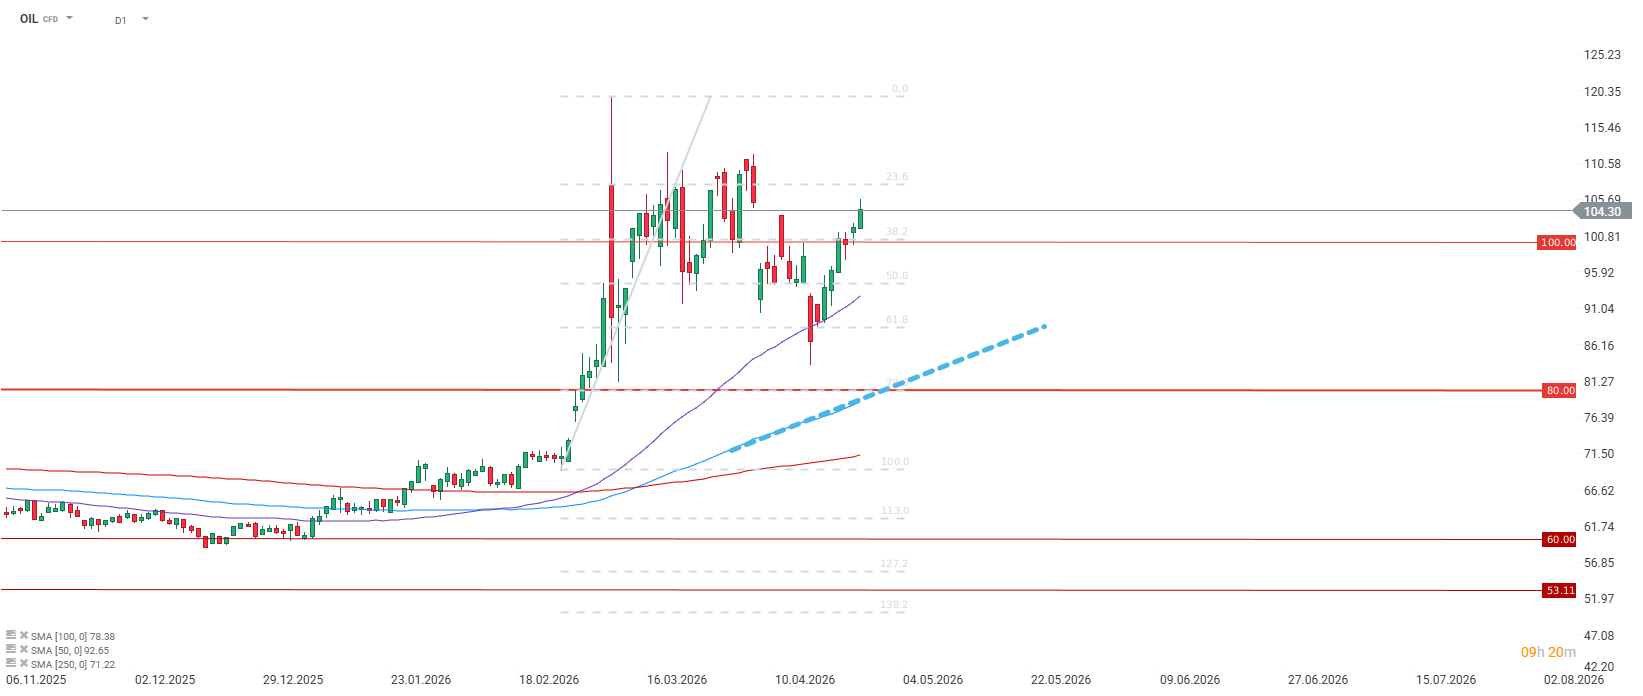
The price of Brent oil for July is rising to $104 per barrel, while the June contract exceeds $110. Without a breakthrough signal, next week could see a move toward $120. Source: xStation5 Gas:
- Gas prices remain under pressure due to weak local fundamentals, though globally they should gain from the Hormuz crisis .
- The USA began the refill season with inventories at 1890 bcf , which is 3% higher than the 5-year average.
- EIA indicates that 2125 bcf will enter storage during the refill period. Higher production is expected to be balanced by increased LNG exports .
- EIA points to an 18% increase in gas exports in 2026 and another 10% in 2027.
- In 2025, a record for exports to Europe was reached (10.3 bcf), accounting for nearly 70% of all LNG exports. The largest growth occurred in exports to Poland and Italy .
- On April 22, another LNG export terminal was launched in the USA. This coincides with a market crisis where 20% of global trade is halted due to the blockade of the Strait of Hormuz.
- This is the only terminal to be commissioned in the USA in 2026, meaning the market will remain tight without the reopening of the Strait.
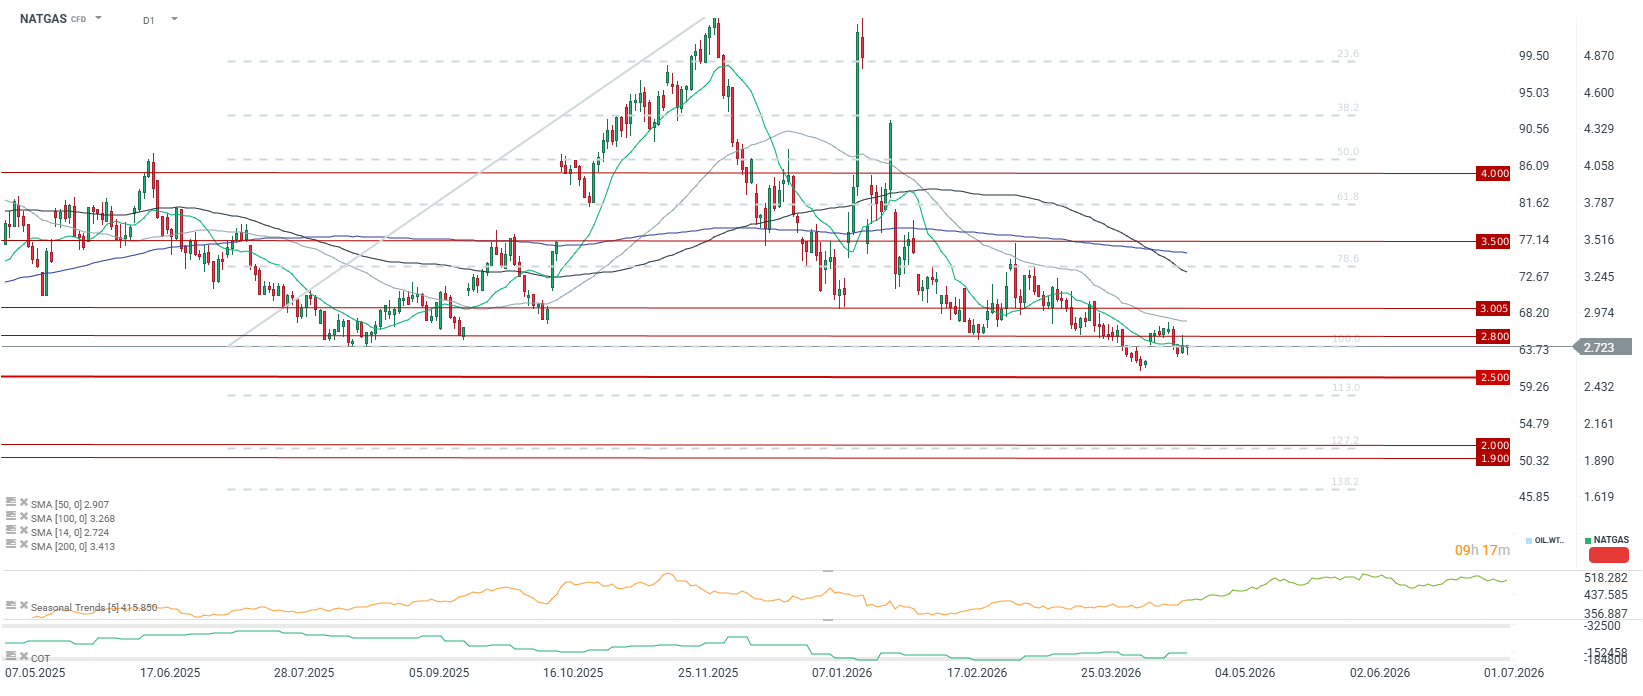
Prices remain under pressure. LNG-linked prices (TTF and JKM) are also falling. In May, the market should begin pricing in the summer season. Source: xStation5 Silver:
- Silver remains under pressure from rising oil prices ahead of the Federal Reserve’s interest rate decision.
- Kevin Warsh’s policy may be a long-term question mark. He is expected to view inflation differently, provide less forward guidance , and actively manage rates while reducing the balance sheet .
- Reducing the balance sheet means lower liquidity , which is negative for precious metals, but balancing monetary policy could eventually mean a return to lower rates.
- Silver remains relatively expensive compared to gold and oil. If a mean-reversion mechanism triggers, the price could decline in the coming months.
- The price is currently below the 100-period average . Only a drop to 2 standard deviations from this average would signal an oversold condition.
- Long-term seasonality suggests consolidation in the near term and a rebound in the second half of the year.
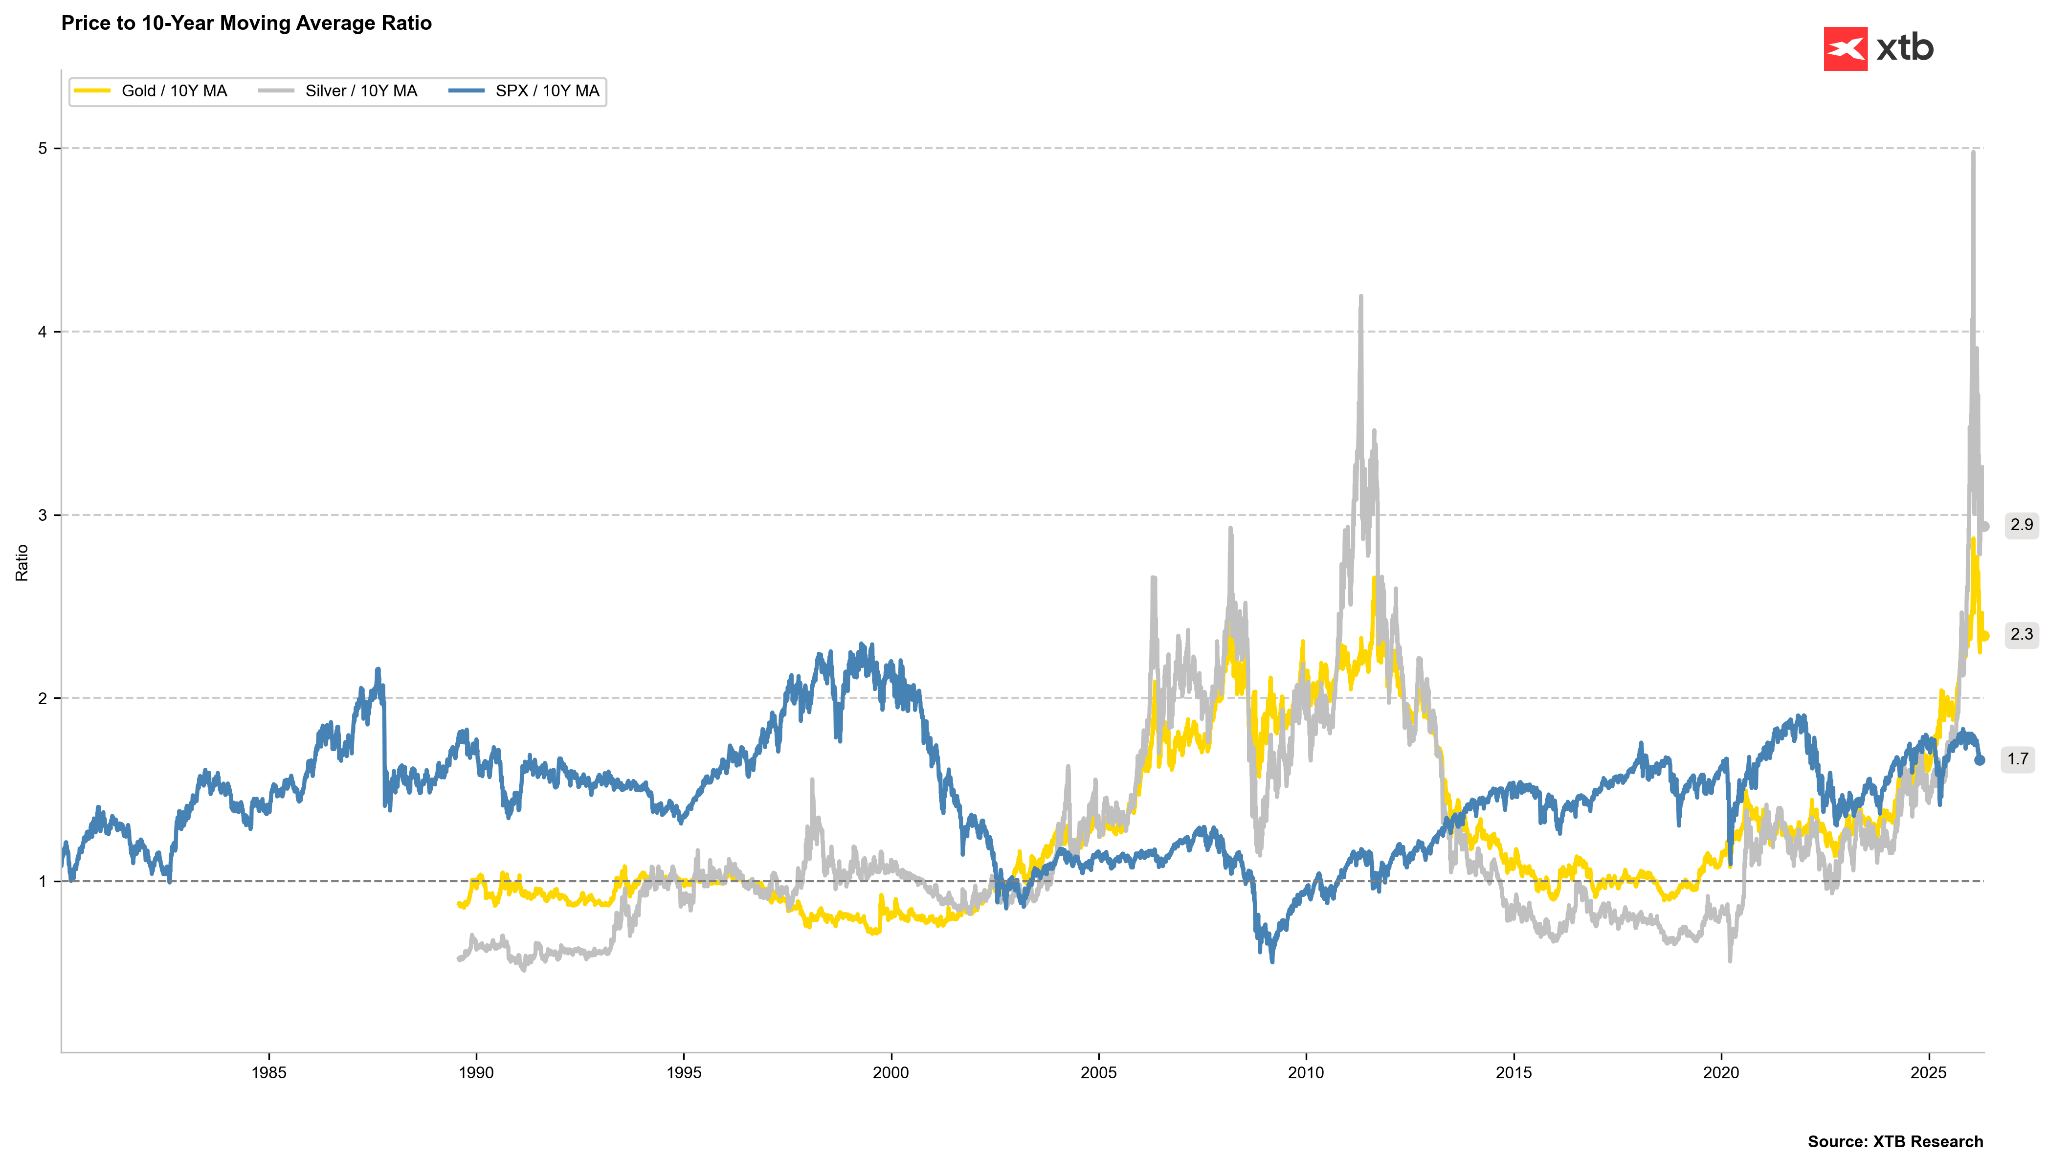
Silver remains expensive relative to its 10-year average and the S&P 500. If the 2011 scenario repeats, gold and silver should approach their averages. Source: Bloomberg Finance LP, XTB
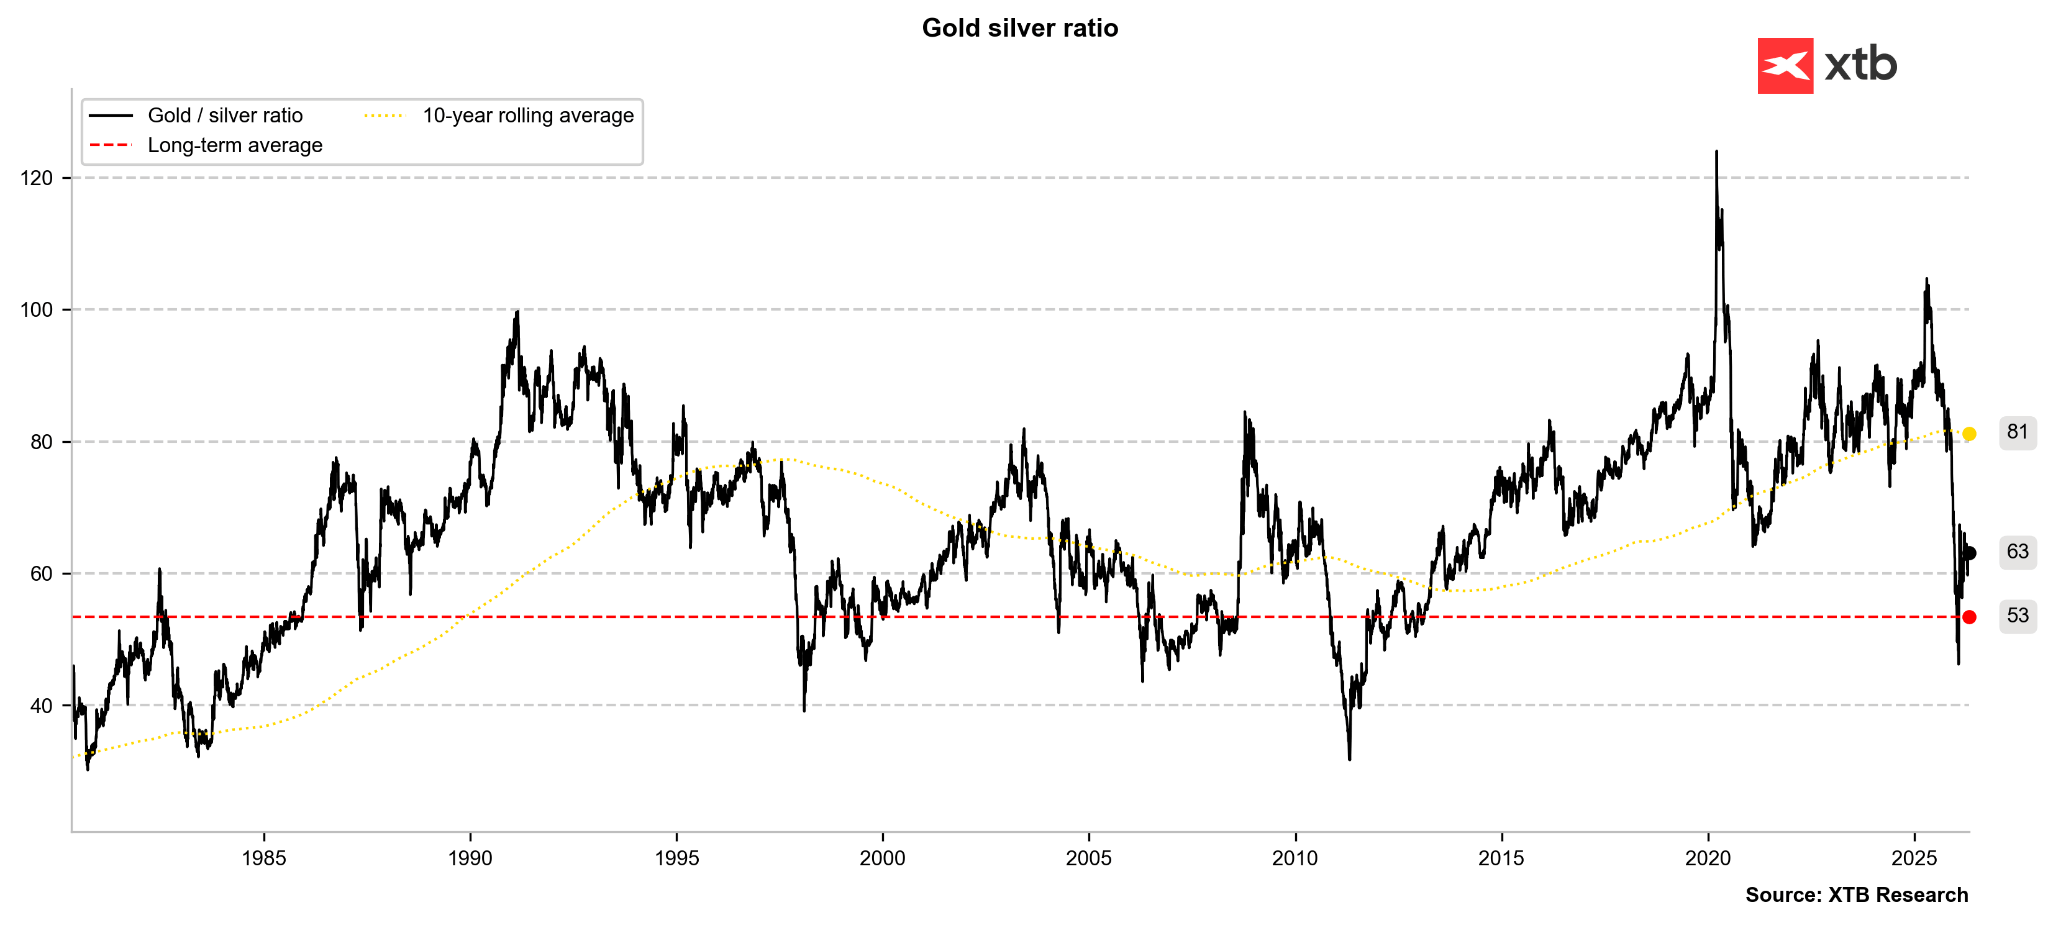
The gold-to-silver ratio is consolidating. Historically, we could see further increases toward 70–80 points. Source: Bloomberg Finance LP, XTB
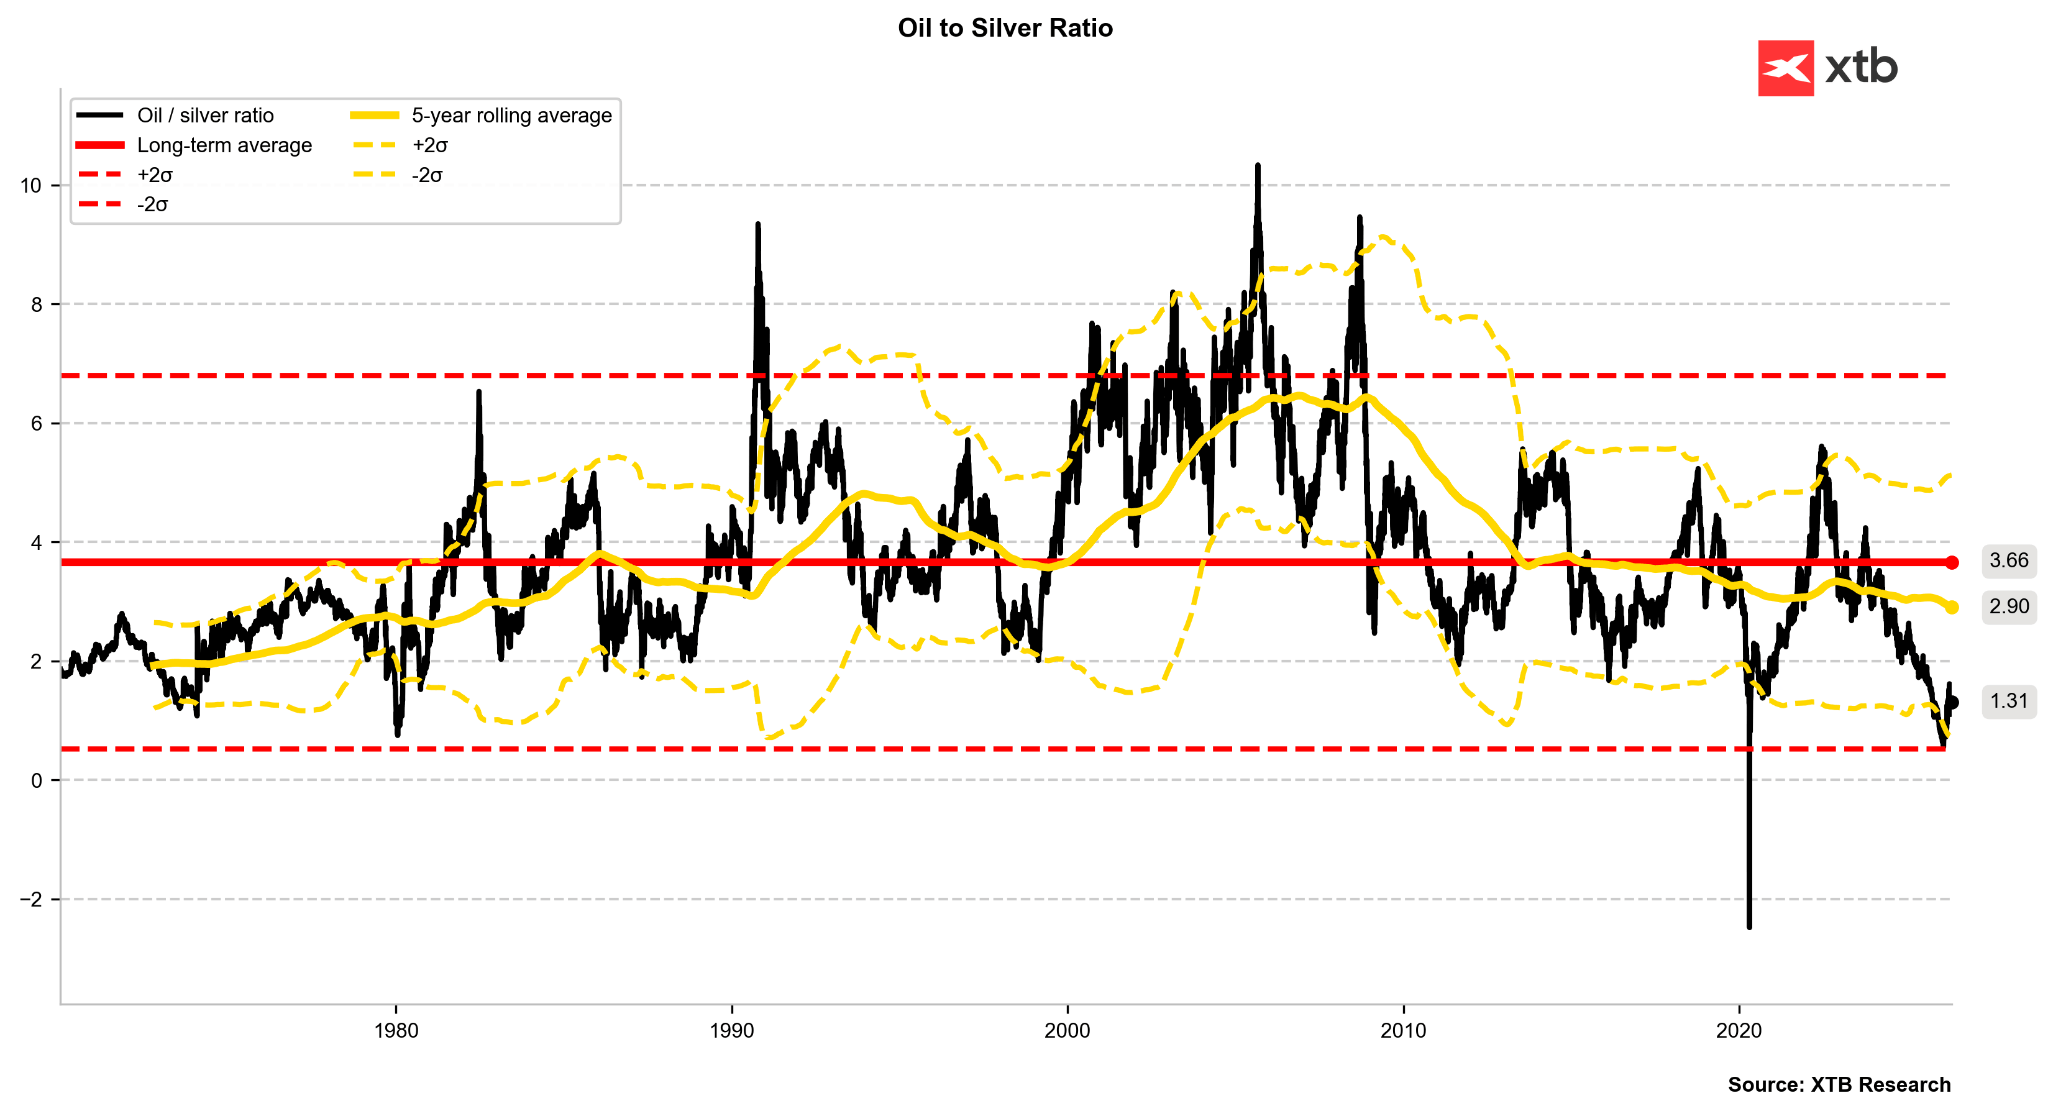
Silver is still extremely expensive compared to oil. One could assume a scenario of $50 silver and $100 WTI or $60 silver and $120 WTI. Source: Bloomberg Finance LP
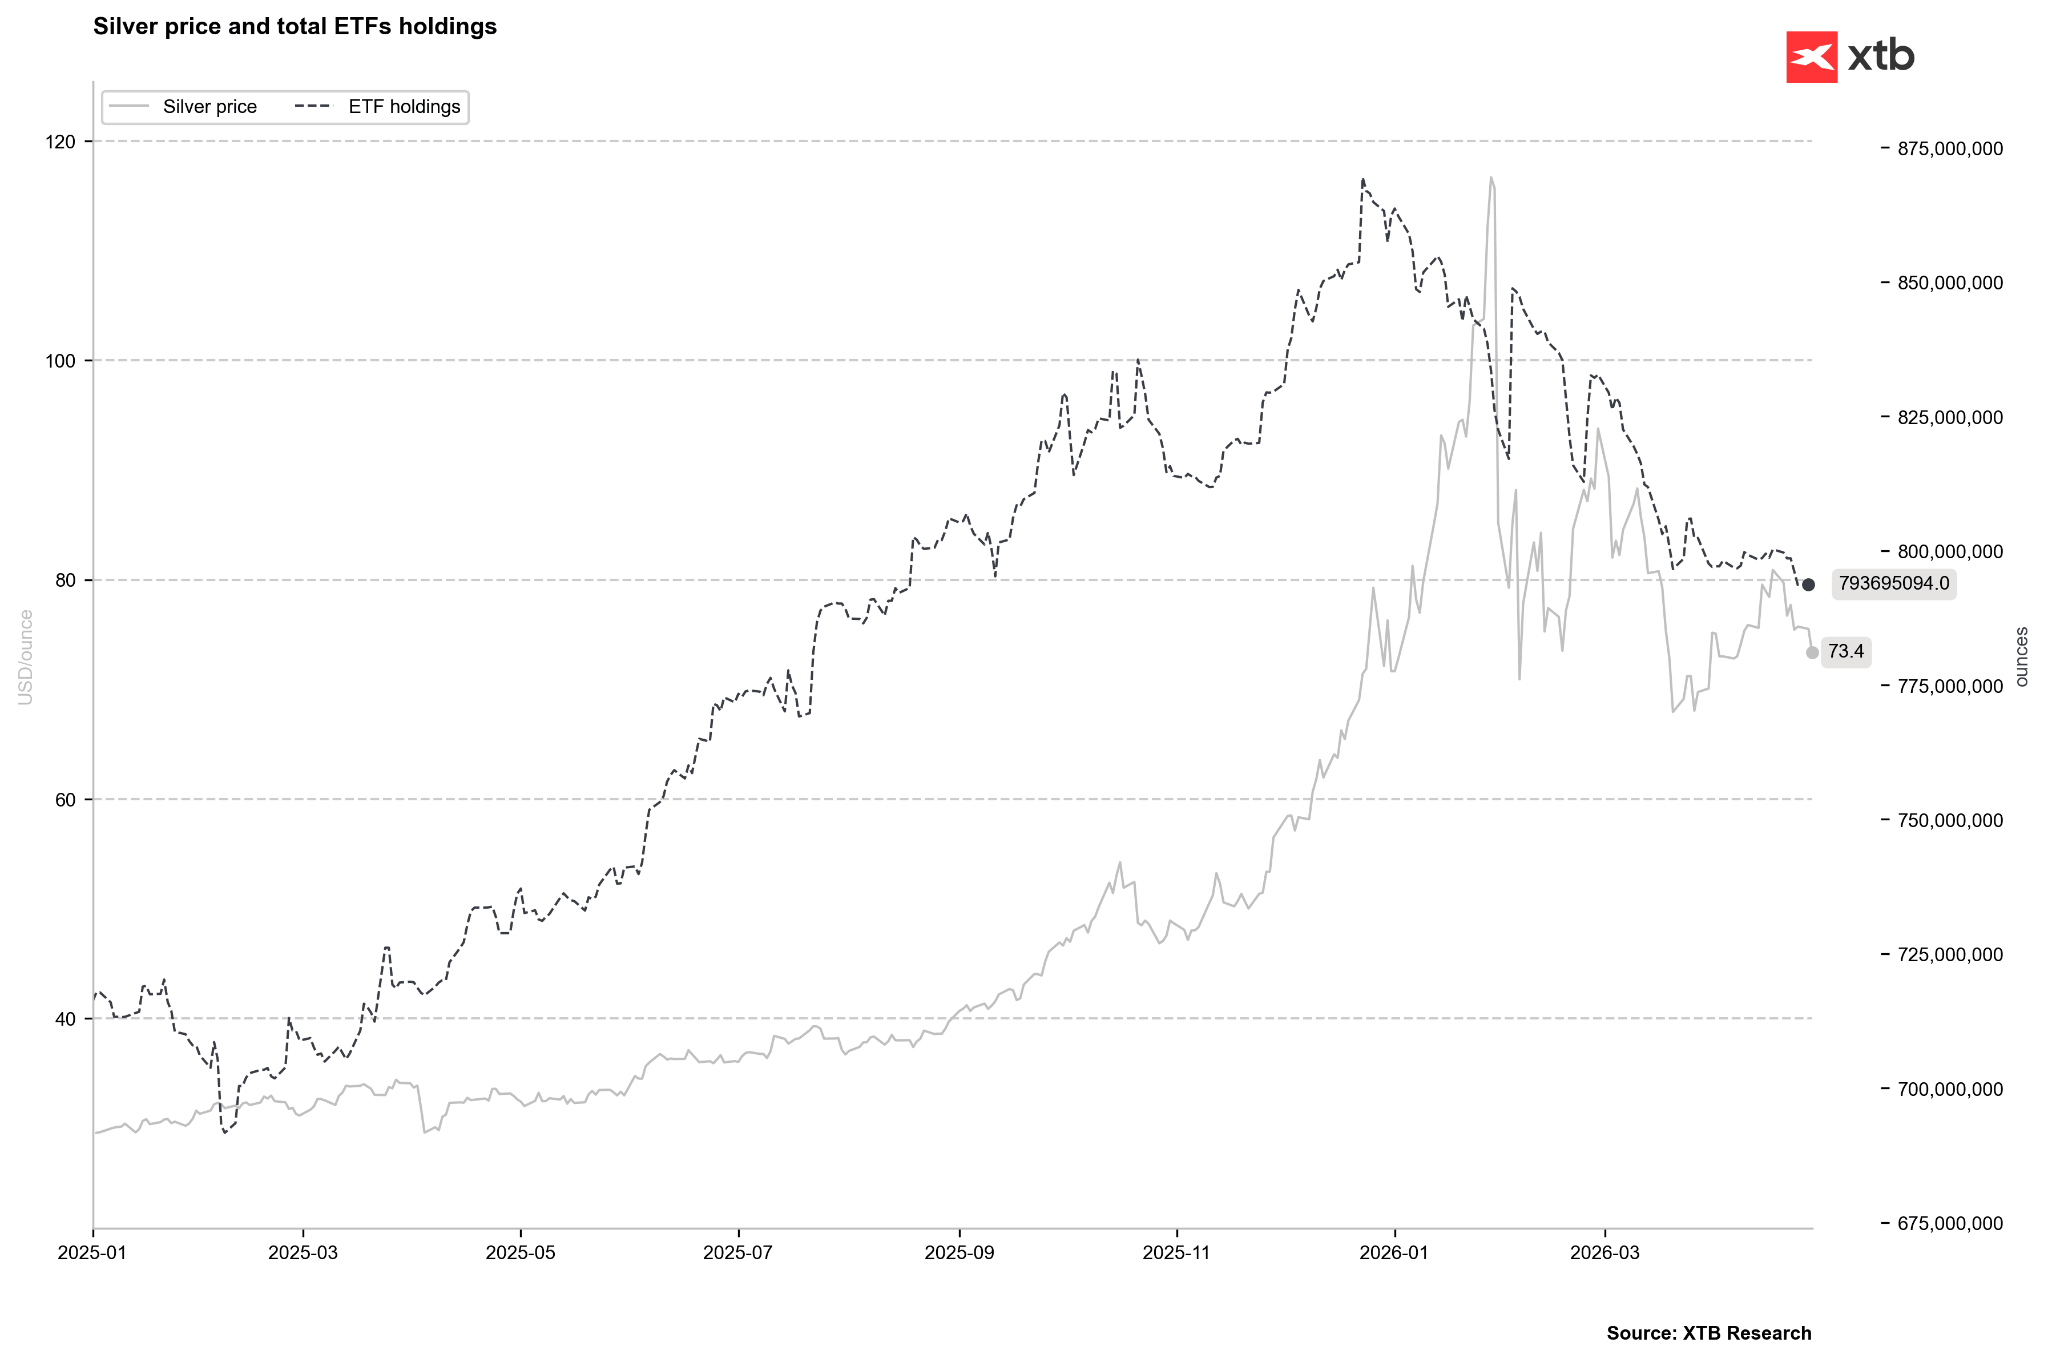
ETFs have returned to selling silver. Without a revival in buying, silver could face further downward pressure toward this year’s lows. Source: Bloomberg Finance LP, XTB Cocoa:
- Production in African countries remains elevated. Deliveries from Ivory Coast for the 2025/2026 season reached 1.51 million tons (up 1% y/y).
- Despite high production, demand remains low . In Q1 2026, Europe processed 7.8% less cocoa than a year ago.
- In the USA, chocolate demand during the Easter period fell by 5% y/y .
- Inventories have risen to 2.63 million bags, hitting a 1.5-year high, though they remain relatively low in a historical context.
- Logistics is a major factor, as the blockade of the Strait of Hormuz and threats in the Bab al-Mandab Strait significantly increase freight costs.
- Fertilizer prices are rising, as up to 1/3 of the world’s urea originated from the Persian Gulf region.
- Short-term factors (high stocks, weak demand) should keep prices low until mid-year. However, concerns over drought and lack of fertilization may create potential for a price recovery in the second half of the year.
- In a bearish scenario, prices could drop back toward $2500 per ton , which would be destructive for African farmers (marginal cost is $1500–$2000).
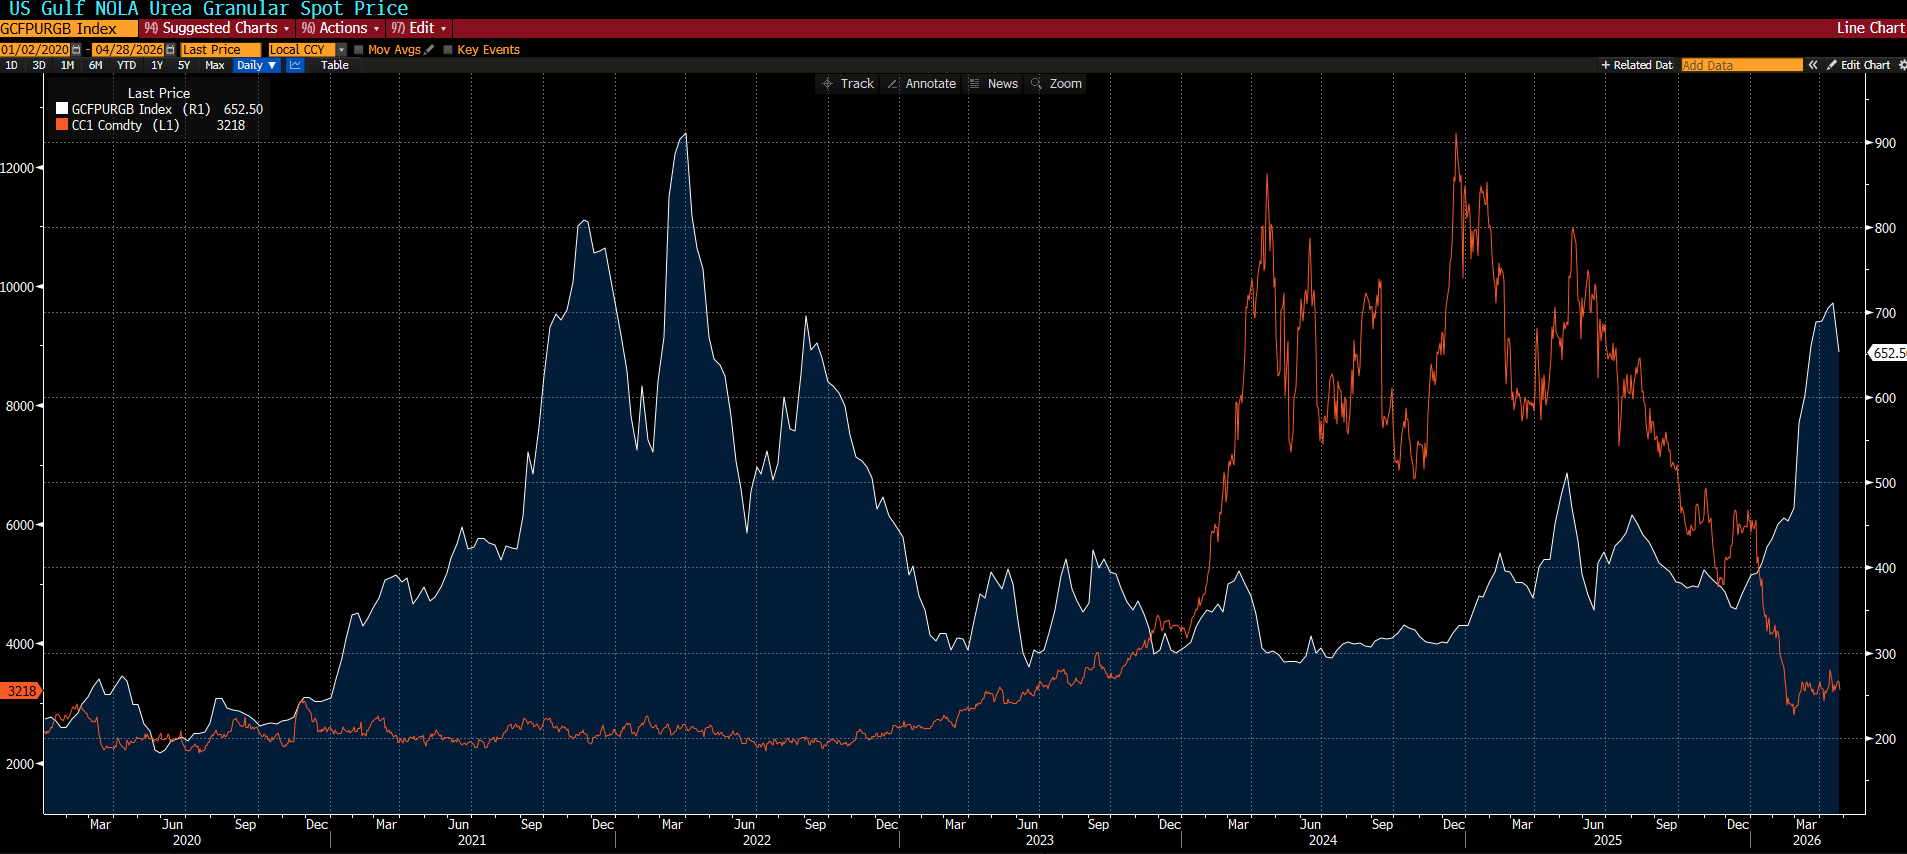
Urea prices remain significantly higher than in 2024/2025. If this translates to lower harvests, we might wait up to 2 years for a major price spike. Source: Bloomberg Finance LP
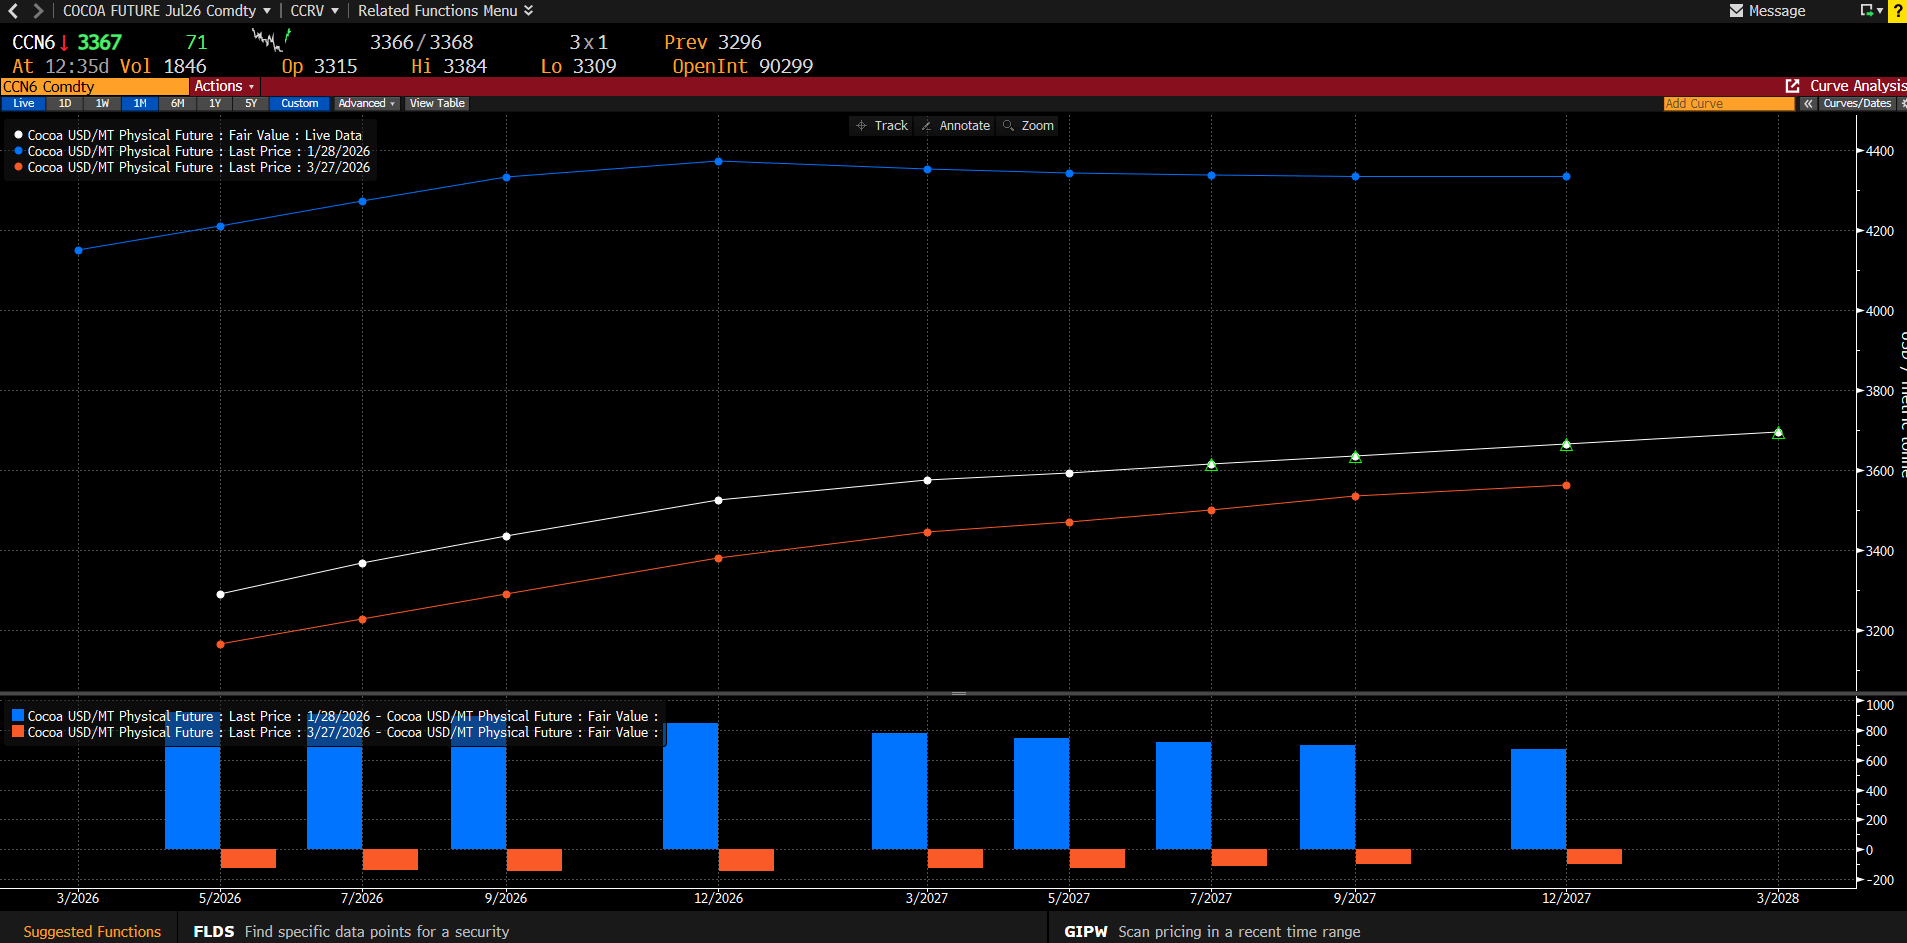
The forward curve is stable, showing moderate contango. However, the entire curve has shifted lower by $600–$1000 since the start of the year, indicating supply pressure. Source: Bloomberg Finance LP