S&P 500 — US Large Cap Index
 FTSE 100 — UK Blue Chips
 Euro Stoxx 50 — Eurozone Leaders
 DAX 40 — German Equities
 CAC 40 — French Market Index
 Nikkei 225 — Japan Benchmark
 Hang Seng — Hong Kong Index
 Shanghai Composite — China Mainland
 ASX 200 — Australian Market
 TSX Composite — Canada Index
 Nifty 50 — India Large Cap
 STI Index — Singapore Market
 KOSPI — South Korea Index
 Bovespa — Brazil Equities
 JSE Top 40 — South Africa Index
 IPC Index — Mexico Market
The Overbalance analysis aims to identify three financial instruments, analysed mainly on a four-hour interval (H4). The analysis uses only the Overbalance methodology, which allows us to determine where the trend may continue or where it may change.
Today’s analysis covers three instruments, assessed solely in terms of the 1:1 correction structure.
EURNZD technical analysis – Overbalance (H4/D1 interval)
The analysis of the EURNZD currency pair has been slightly modified due to the fact that the current correction resembles the corrections observed in 2020. Looking more broadly, the entire upward movement that began in April 2022 has a trend structure in which several corrections of very similar range have already appeared. These corrections are clearly marked with vertical rectangles and fit well with the Overbalance methodology. Currently, we are again observing the calculation of the downward range of the correction, with key support falling in the 1.9590 area, where the lower limit of the 1:1 pattern is located. Resistance, on the other hand, is located in the 1.9880 area and results from the local 1:1 downward pattern that is forming as part of the correction.
Importantly, this entire corrective movement is still part of a larger upward trend that began in April 2021 and continued in 2022–2023. The fact that corrections of comparable magnitude have occurred repeatedly in this trend reinforces the significance of the current support. As long as the price remains above 1.9590, the baseline scenario remains a continuation of the upward trend after the correction ends. Only a sustained breach of the lower limit of the 1:1 pattern would pave the way for a deeper change in market structure.
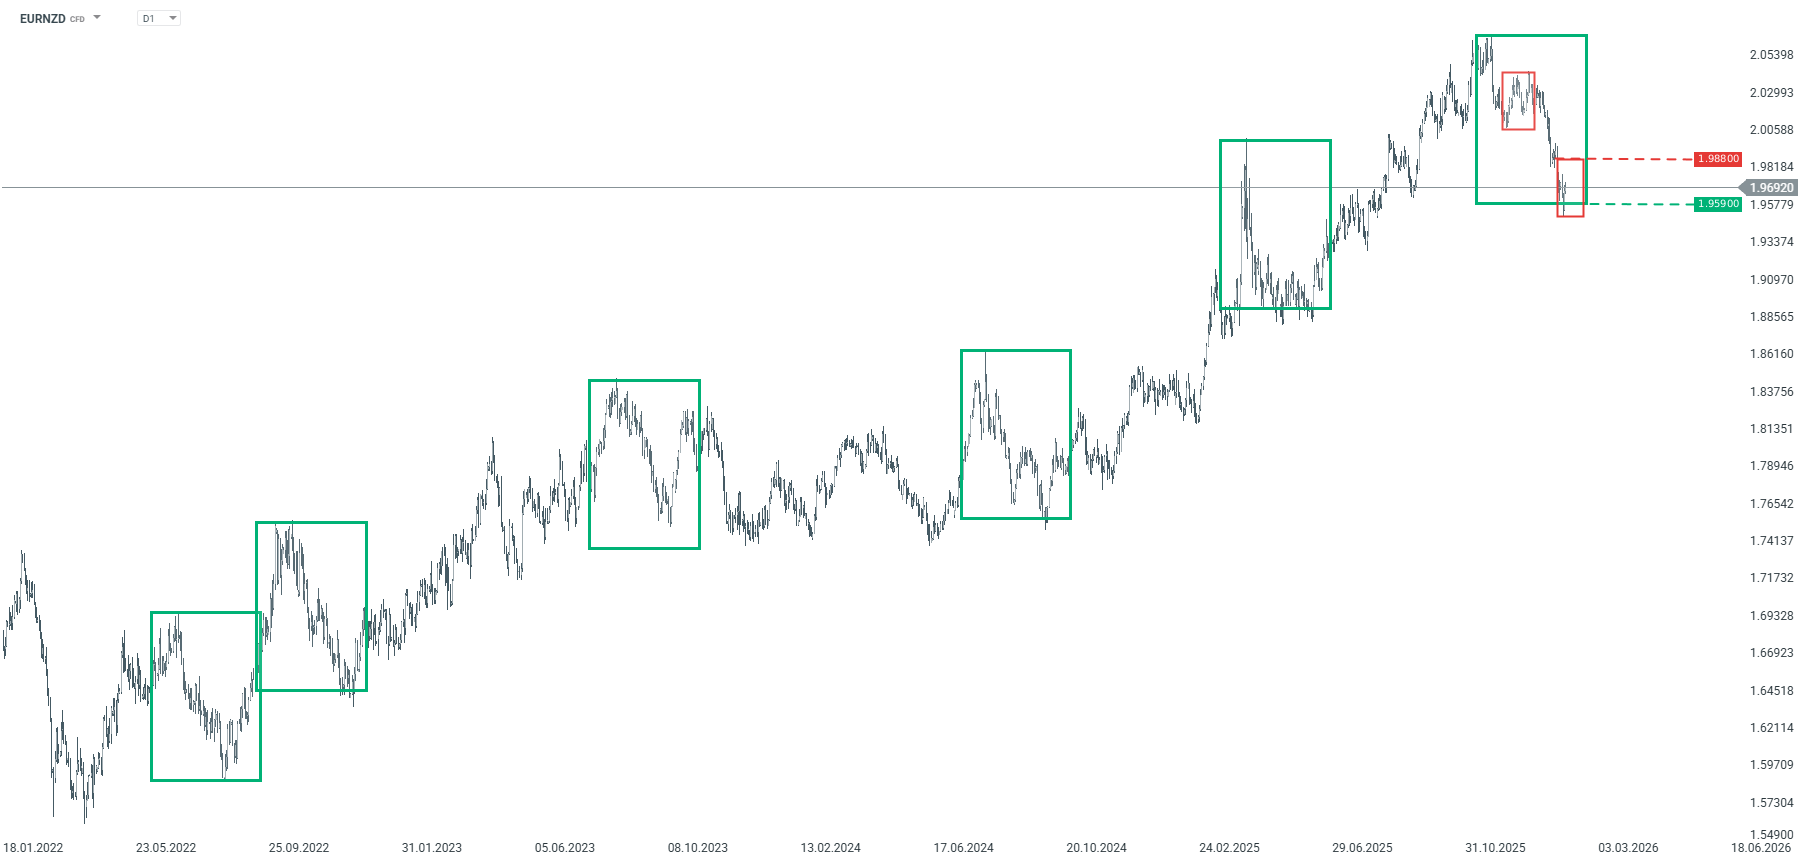
EURNZD – D1 interval. Source: xStation5
Technical analysis of GBPUSD
Since November last year, the GBPUSD currency pair has been on an upward trend, but recently it broke through the key support level of 1.3690 and negated the external coefficient of 127.2%, which, according to the Overbalance methodology, may indicate a potential trend reversal.
Additionally, counting from the peak at the end of January, the chart shows a local 1:1 downward pattern, which remains respected. The key resistance for this pattern is 1.3721. As long as the price remains below this level, the baseline scenario remains a continuation of the downward movement. Only a sustained return above 1.3721 could negate the local downward pattern and weaken supply pressure.
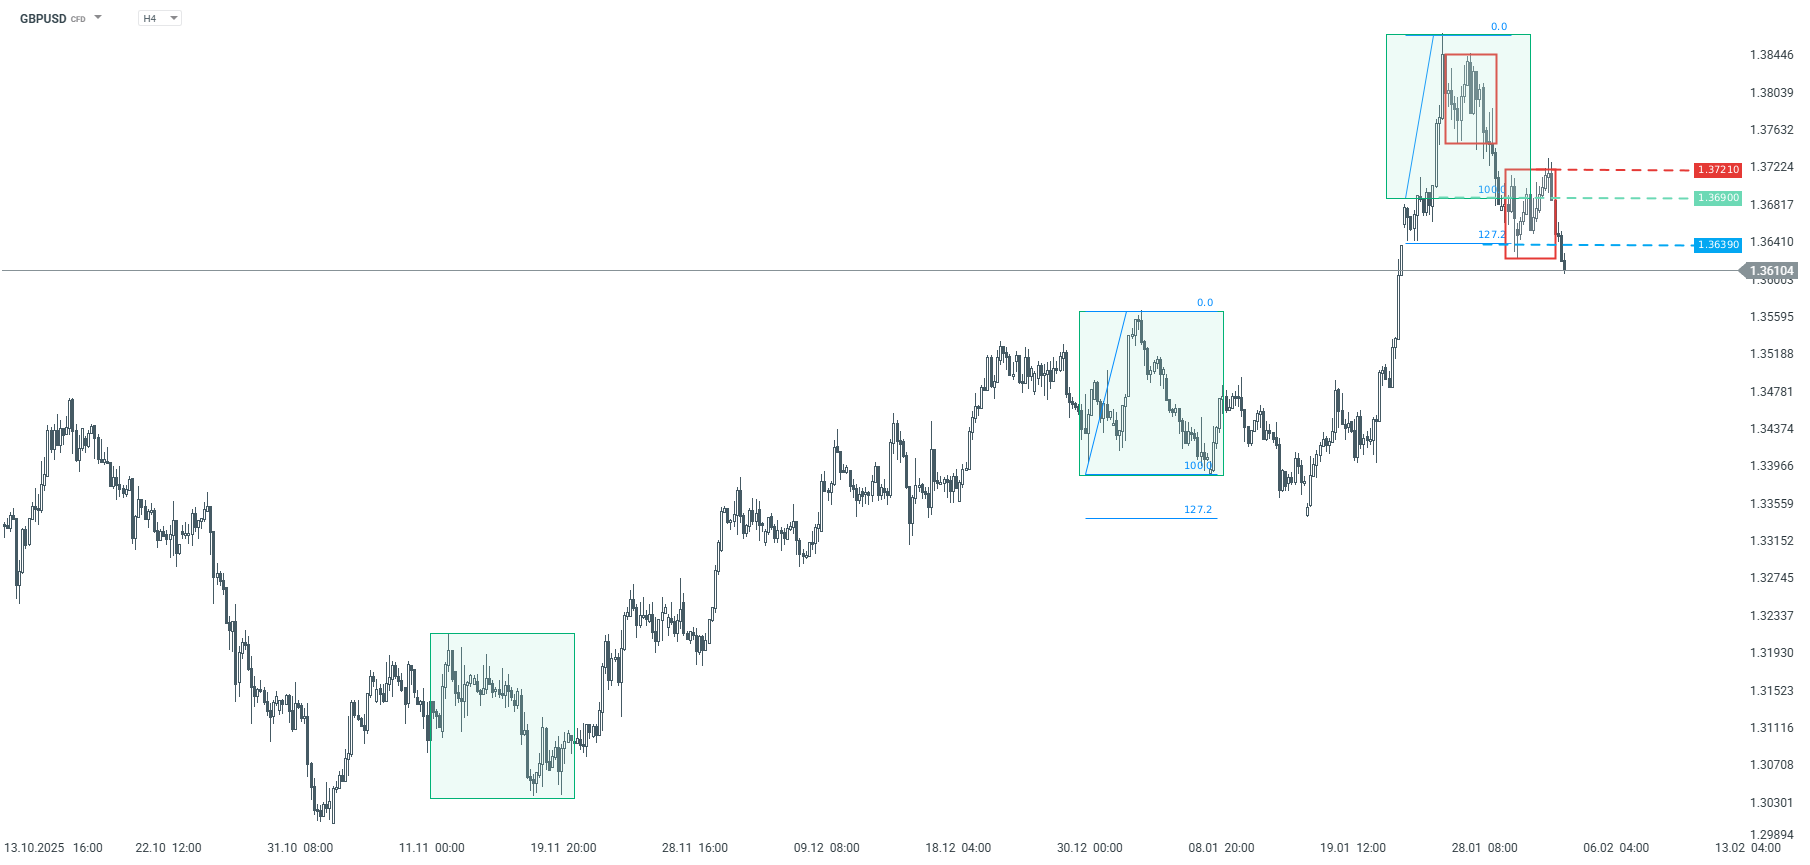
GBPUSD – H4 interval. Source: xStation5
Technical analysis of NZDUSD
The NZDUSD currency pair has been on an upward trend since the second half of November, but we are currently seeing a downward correction within that trend. According to the Overbalance methodology, if the correction continues to expand, key support will be found at 0.5950, which is the lower limit of the larger 1:1 pattern.
On the other hand, resistance to any upward movements is located at 0.6033, which results from the upper limit of the local 1:1 downward pattern. As long as the price remains above 0.5950, the main upward trend remains intact, and the current movement should be treated as a correction in the trend.
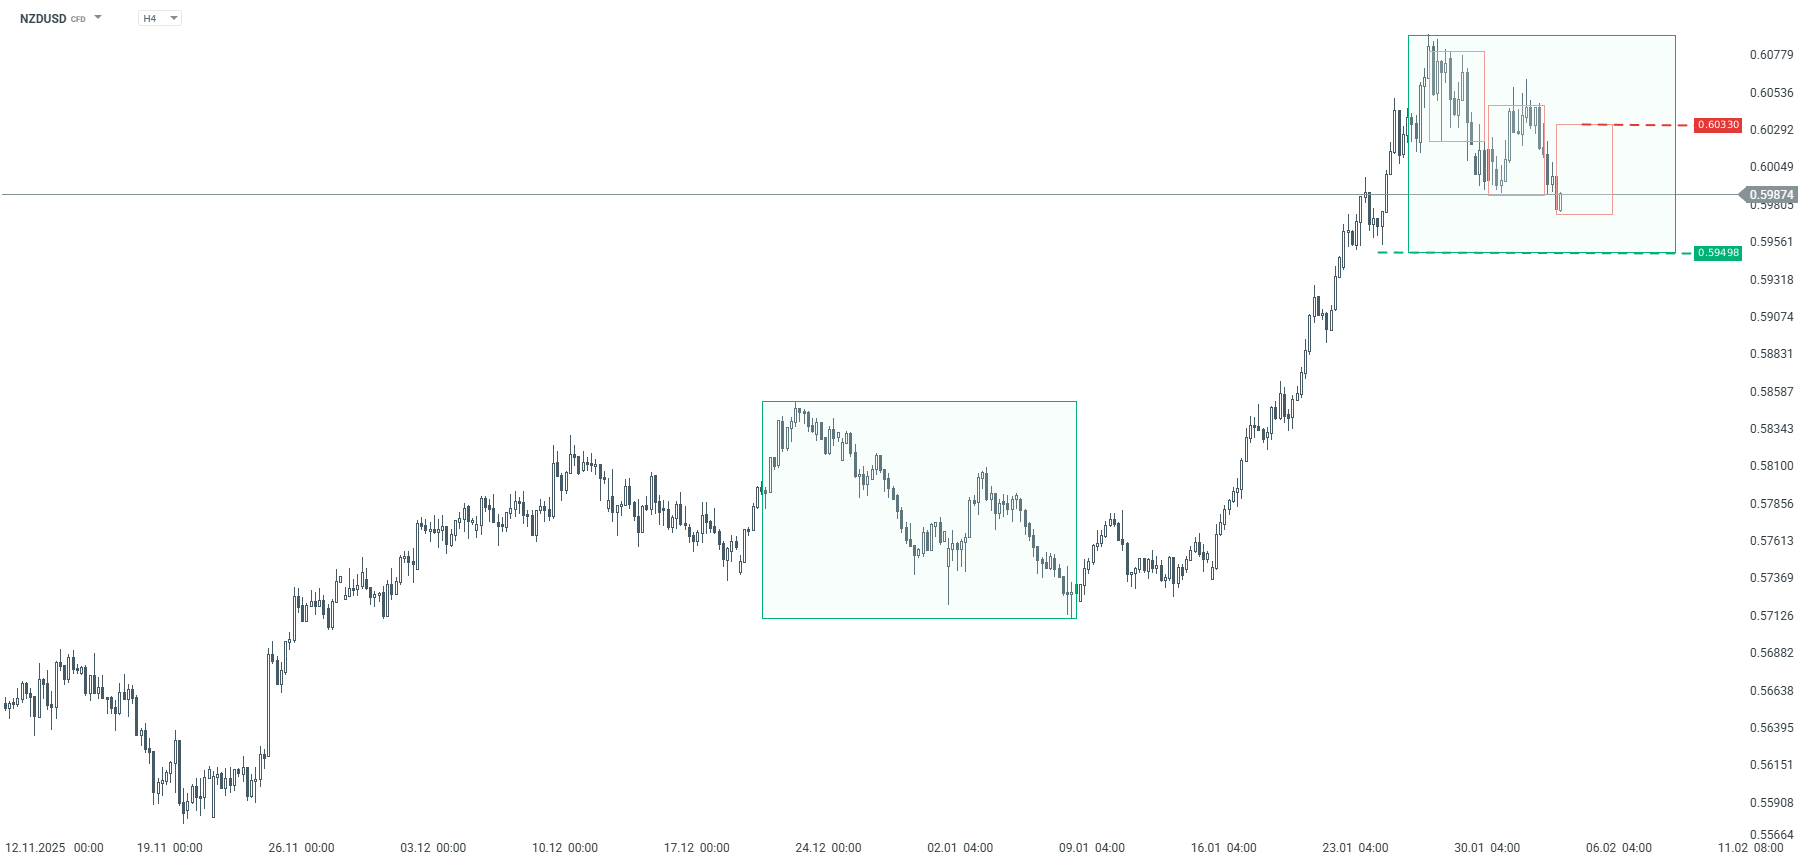
NZDUSD – H4 interval. Source: xStation5
The material on this page does not constitute financial advice and does not take into account your level of understanding, investment objectives, financial situation or any other specific needs. All information provided, including opinions, market research, mathematical results and technical analyzes published on the Website or transmitted To you by other means, it is provided for information purposes only and should in no way be construed as an offer or solicitation for a transaction in any financial instrument, nor should the information provided be construed as advice of a legal or financial nature on which any investment decisions you make should be based exclusively To your level of understanding, investment objectives, financial situation, or other specific needs, any decision to act on the information published on the Website or sent to you by other means is entirely at your own risk if you In doubt or unsure about your understanding of a particular product, instrument, service or transaction, you should seek professional or legal advice before trading. Investing in CFDs carries a high level of risk, as they are leveraged products and have small movements Often the market can result in much larger movements in the value of your investment, and this can work against you or in your favor. Please ensure you fully understand the risks involved, taking into account investments objectives and level of experience, before trading and, if necessary, seek independent advice.