S&P 500 — US Large Cap Index
 FTSE 100 — UK Blue Chips
 Euro Stoxx 50 — Eurozone Leaders
 DAX 40 — German Equities
 CAC 40 — French Market Index
 Nikkei 225 — Japan Benchmark
 Hang Seng — Hong Kong Index
 Shanghai Composite — China Mainland
 ASX 200 — Australian Market
 TSX Composite — Canada Index
 Nifty 50 — India Large Cap
 STI Index — Singapore Market
 KOSPI — South Korea Index
 Bovespa — Brazil Equities
 JSE Top 40 — South Africa Index
 IPC Index — Mexico Market
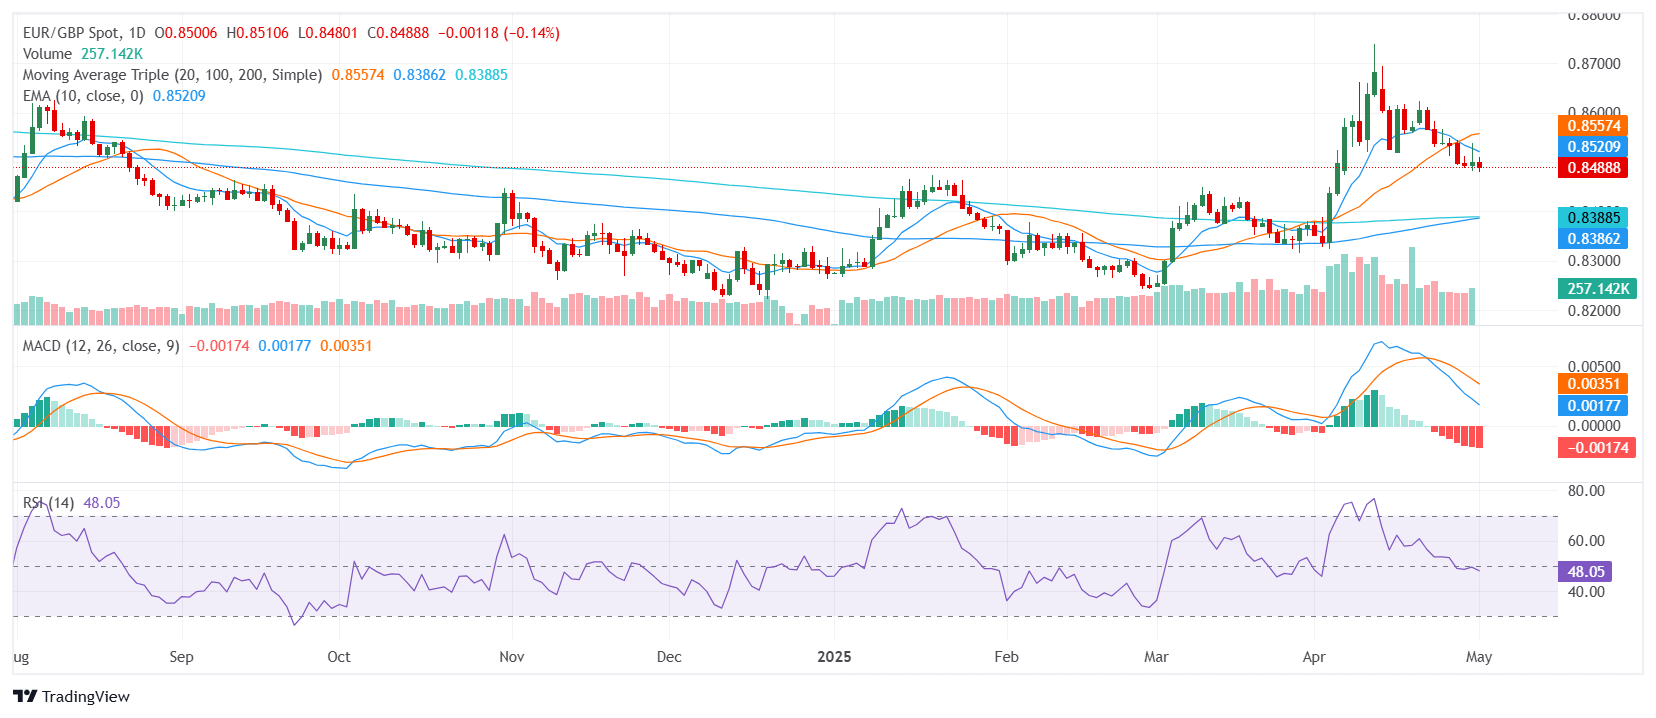
EUR/GBP Price Analysis: Euro holds bullish tone while drifting near 0.8500

- EUR/GBP trades near the 0.8500 zone after slipping modestly in Thursday’s session.
- Bullish trend remains intact despite mixed momentum signals.
- Supportive long-term averages contrast with short-term resistance capping upside.
The EUR/GBP pair saw slight weakness on Thursday, trading near the 0.8500 zone after the European session. Despite today’s marginal drop, the overall structure remains supportive of a bullish bias, backed by a firm base of longer-term moving averages. Short-term indicators, however, show conflicting signals, with momentum fading even as the broader trend holds steady.
From a technical standpoint, EUR/GBP is leaning bullish overall. The Relative Strength Index remains neutral near the midpoint, suggesting no extreme conditions. The MACD currently delivers a sell signal, indicating slowing momentum, while the Stochastic %K has dropped into oversold territory, flashing a potential buy setup. The Commodity Channel Index also sits neutral, adding to the mixed short-term picture.
The structural strength comes from the moving averages. The 50-day Exponential and Simple Moving Averages sit well below current prices and continue to point upward, reinforcing the broader bullish setup. In contrast, the 20-day SMA — positioned slightly above spot — may act as a short-term ceiling. Meanwhile, the 100-day and 200-day SMAs remain firmly bullish, continuing to provide a strong foundation for buyers.
Support is seen at 0.8478, followed by 0.8462 and 0.8434. Resistance stands at 0.8492, 0.8497, and 0.8516.
Daily Chart