S&P 500 — US Large Cap Index
 FTSE 100 — UK Blue Chips
 Euro Stoxx 50 — Eurozone Leaders
 DAX 40 — German Equities
 CAC 40 — French Market Index
 Nikkei 225 — Japan Benchmark
 Hang Seng — Hong Kong Index
 Shanghai Composite — China Mainland
 ASX 200 — Australian Market
 TSX Composite — Canada Index
 Nifty 50 — India Large Cap
 STI Index — Singapore Market
 KOSPI — South Korea Index
 Bovespa — Brazil Equities
 JSE Top 40 — South Africa Index
 IPC Index — Mexico Market

- GBP/USD edges down to near 1.3460 while investors shift their focus to the US NFP data.
- The US official employment data will have a significant impact on the Fed’s monetary policy outlook.
- The Cable appears to be gathering strength for a decisive breakout of the VCP pattern.
The British Pound (GBP) trades marginally lower at around 1.3460 against the US Dollar (USD) during the European trading session on Thursday. The GBP/USD pair is expected to trade sideways as investors await the United States (US) Nonfarm Payrolls (NFP) data for July, which will be released on Friday.
US payrolls seen posting modest July gain as Deutsche Bank flags participation risks
Economists at Deutsche Bank expect Friday’s July payrolls report to show a further, if modest, improvement in hiring. They look for “employment growth of +65k, modestly above June’s +57k reading”.
On the labor market’s slack, Deutsche Bank forecasts that “the unemployment rate is forecast to remain at 4.2%, although risks are skewed towards a rounding up to 4.3% if labor force participation rebounds after last month’s sharp decline.” Wage and hours data are expected to be steady, with “average hourly earnings… expected to increase by +0.3% month-on-month, unchanged from June, while average hours worked are forecast to hold at 34.3 hours.”
Investors will pay close attention to the US NFP data as it will influence market expectations for the Federal Reserve’s (Fed) monetary policy outlook.
Ahead of the US NFP data for July, the ADP Employment Change data remained weaker-than-projected. On Wednesday, the ADP reported that the private sector created 44K jobs in July, fewer than estimates of 70K and the prior release of 98K.
Technical Analysis
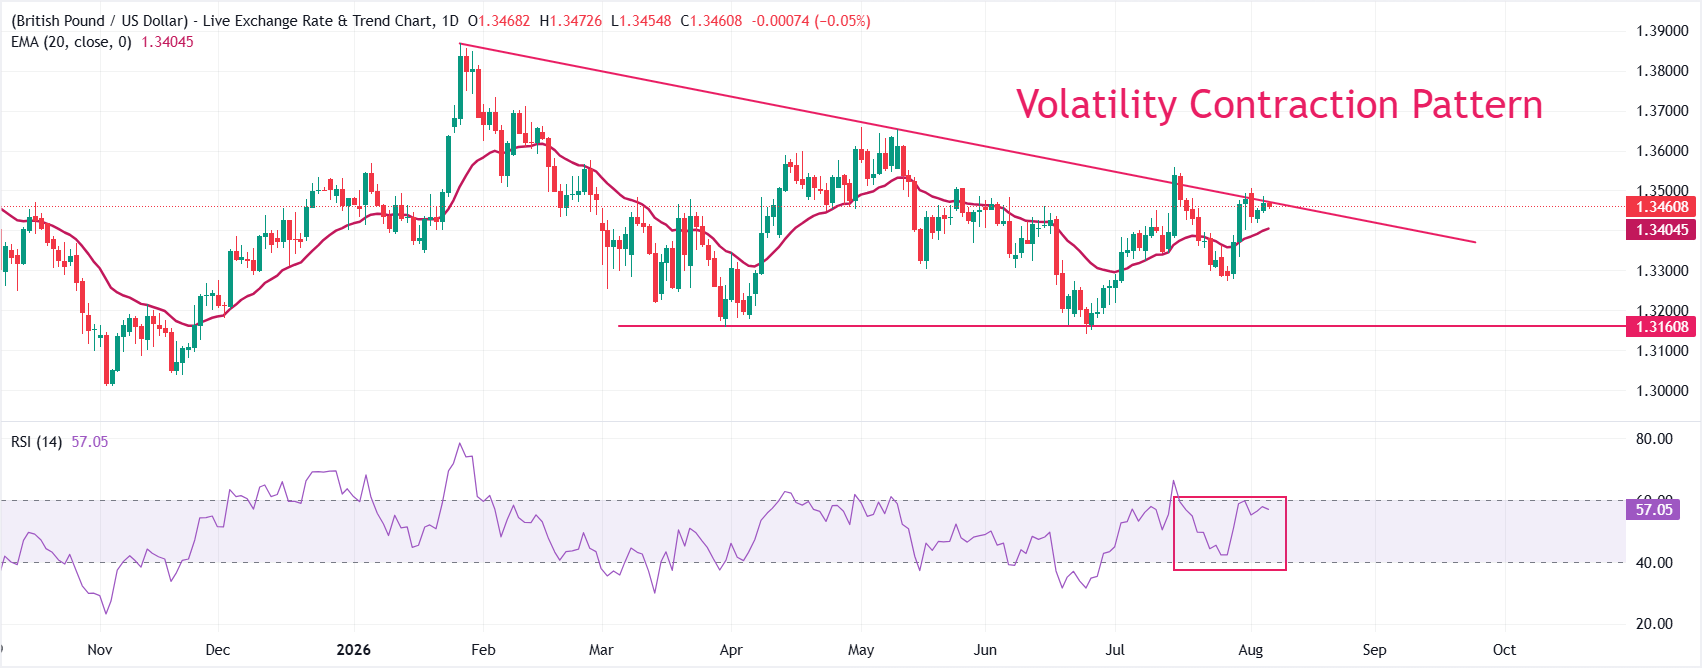
GBP/USD trades at around 1.3460, keeping a mildly bullish near-term bias as spot holds above the 20-day exponential moving average (EMA) at 1.3404, but struggles to achieve a decisive breakout of the downward-sloping border of the Volatility Contraction Pattern (VCP) at around 1.3471.
The Relative Strength Index (RSI) around 57 shows constructive but not overextended momentum, suggesting scope for further gains as long as price stays supported on dips above the EMA.
On the topside, immediate resistance is located at the former trend line break price at 1.3471, and a decisive move above this barrier would open the way for a continuation of the recent upside. Looking up, the July 15 high at 1.3558 is the key hurdle. On the downside, initial support is seen at the 20-day EMA at 1.3404, followed by the July 28 low at 1.3274.