S&P 500 — US Large Cap Index
 FTSE 100 — UK Blue Chips
 Euro Stoxx 50 — Eurozone Leaders
 DAX 40 — German Equities
 CAC 40 — French Market Index
 Nikkei 225 — Japan Benchmark
 Hang Seng — Hong Kong Index
 Shanghai Composite — China Mainland
 ASX 200 — Australian Market
 TSX Composite — Canada Index
 Nifty 50 — India Large Cap
 STI Index — Singapore Market
 KOSPI — South Korea Index
 Bovespa — Brazil Equities
 JSE Top 40 — South Africa Index
 IPC Index — Mexico Market
Gold price weakens further below $3,250 as US-China trade deal boosts USD and global risk sentiment

- Gold price kicks off the new week on a weaker note in reaction to the optimism over the US-China trade deal.
- The US and China agree to substantially move down tariff levels by 115% for an initial period of 90 days/
- Easing US recession fears and the Fed’s hawkish pause underpin the USD, and further weigh on the commodity.
Gold price (XAU/USD) adds to its heavy intraday losses following the US-China joint statement on trade talks and dives to a fresh one-week low, below the $3,250 level during the early European session on Monday. The already upbeat market mood gets an additional boost in reaction to an agreement between the US and China to lower tariffs, which, in turn, is seen as a key factor driving flows away from the safe-haven precious metal.
Meanwhile, the positive development helps to ease concerns about a US recession, which, along with the Federal Reserve’s (Fed) hawkish pause, lifts the US Dollar (USD) to its highest level since April 10. This is seen as another factor exerting downward pressure on the Gold price and supports prospects for deeper losses. The market focus now shifts to this week’s release of US inflation figures and Fed Chair Jerome Powell’s appearance.
Daily Digest Market Movers: Gold price plummets as US-China trade optimism dents demand for safe-haven assets
- The US and China ended high-stakes trade talks in Switzerland on a positive note on Sunday. In fact, US Treasury Secretary Scott Bessent and Trade Representative Jamieson Greer said that a trade deal had been struck with China.
- Adding to this, China’s Vice Premier He Lifeng said that the meeting achieved substantial progress, and reached consensus on key issues, triggering a fresh wave of global risk-on trade and undermining the safe-haven Gold price.
- The US Dollar holds steady near a one-month high amid the Federal Reserve’s hawkish signal that it is not leaning towards cutting interest rates anytime soon, as traders await more details on the US-China trade agreement.
- China’s Vice Premier He Lifeng said that a joint statement would be released in Geneva on Monday, and that it is going to be big news and good news for the world, which further adds to the latest market optimism.
- Russian President Vladimir Putin has agreed to hold direct talks with his Ukrainian counterpart Volodymyr Zelenskyy and stated that these talks should begin “without preconditions and delay” on Thursday, May 15.
- Meanwhile, Hamas said that the last living American hostage in Gaza, Edan Alexander, will be released and confirmed plans to hold direct talks with the US as part of efforts to reach a ceasefire and resume the delivery of aid.
- Traders this week will confront the release of US inflation figures. Apart from this, Fed Chair Jerome Powell’s appearance on Thursday will be looked upon for cues about the future rate-cut path and a fresh impetus.
Gold price could extend the downward trajectory towards testing the monthly trough, around the $3,200 mark
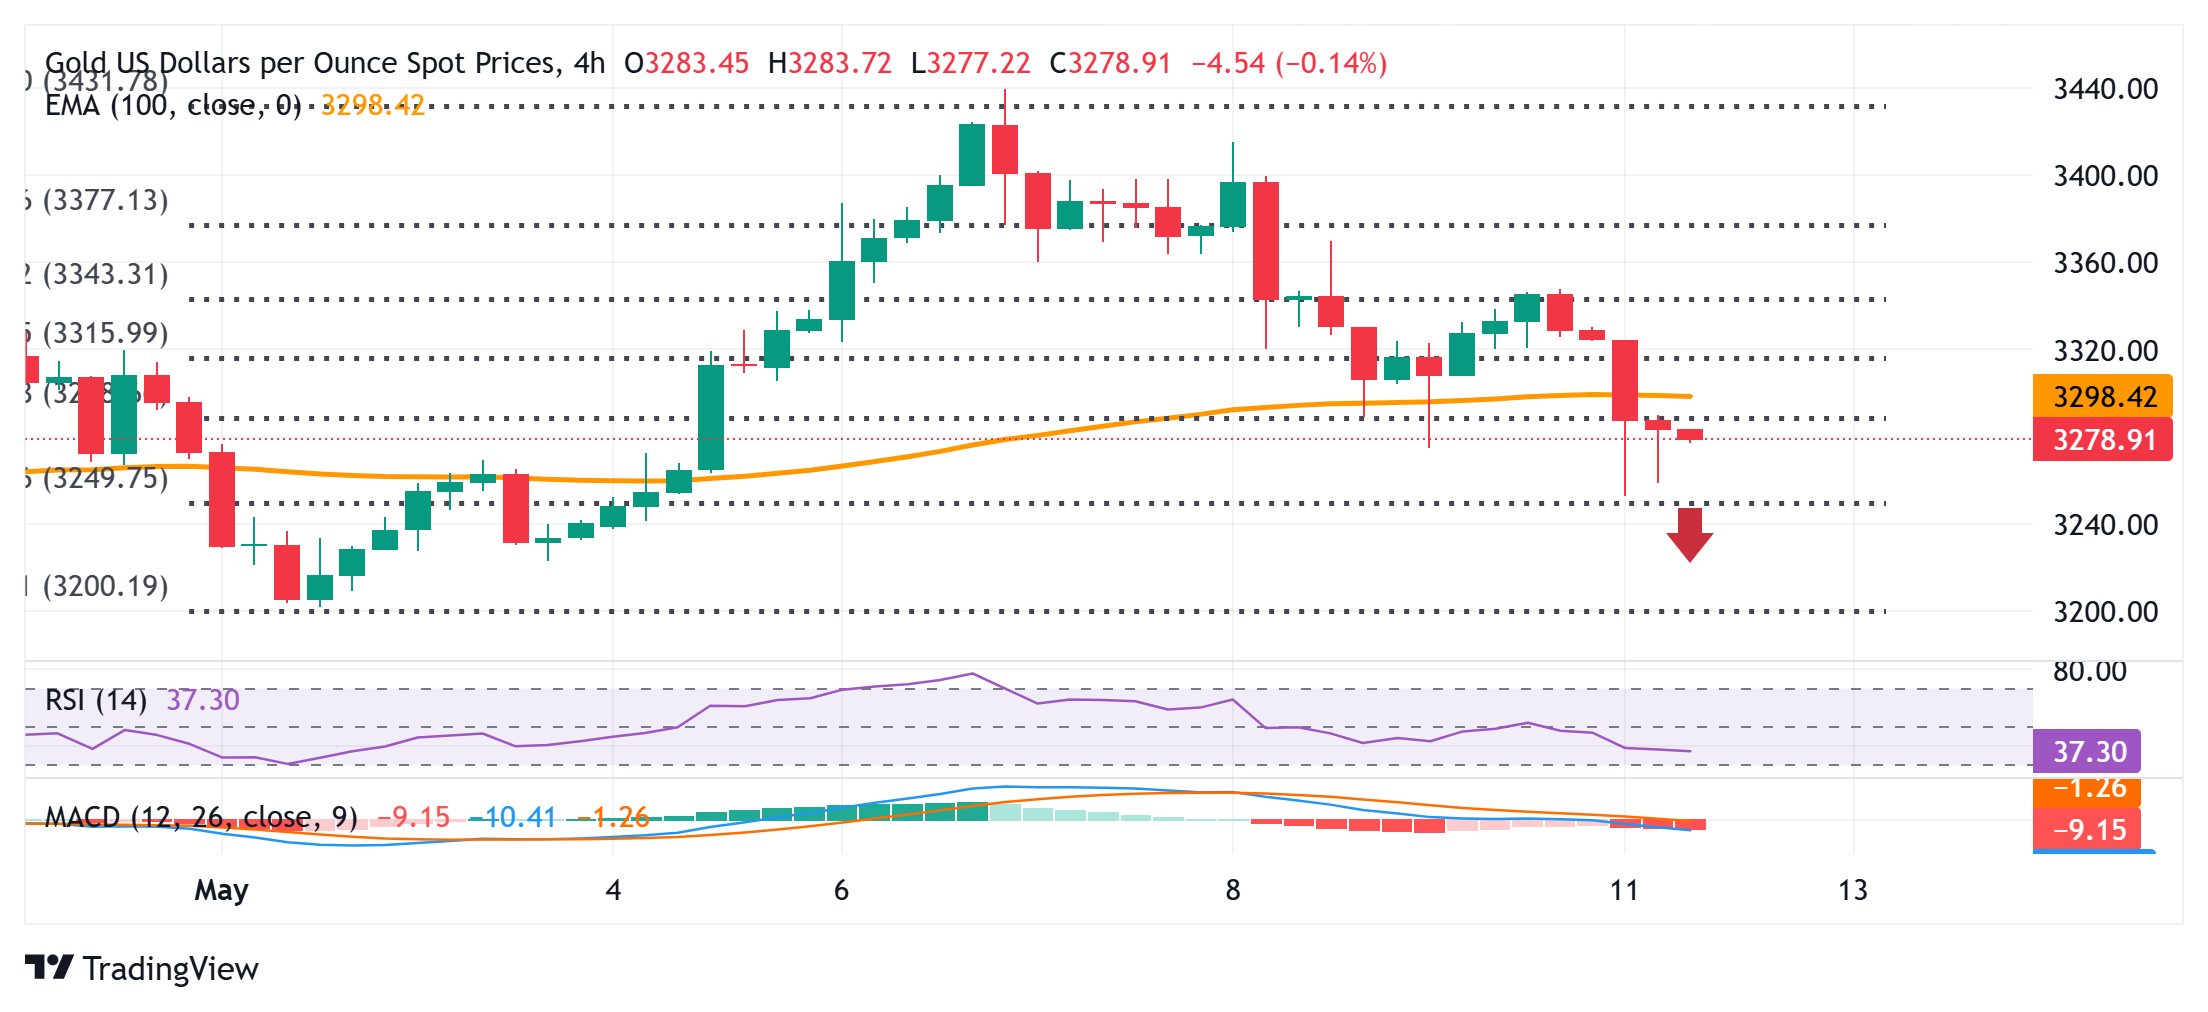
From a technical perspective, any intraday breakdown and acceptance below the $3,295-3,290 confluence – comprising the 100-period Exponential Moving Average (EMA) on the 4-hour chart and the 61.8% Fibonacci retracement level of the recent move up from the monthly low – could be seen as a key trigger for bearish traders. Moreover, oscillators on hourly charts have been gaining negative traction and support prospects for a further intraday depreciating move for the Gold price. Some follow-through selling below the Asian session low, around the $3,253-3,252 region, will reaffirm the bearish bias and expose the monthly low, around the $3,200 mark. The latter should act as a pivotal point, which, if broken decisively, should pave the way for the resumption of the prior retracement slide from the $3,500 psychological mark, or the all-time peak touched in April.
On the flip side, any recovery back above the $3,300 round figure now seems to attract fresh sellers near the $3,317-3,318 zone, or the Asian session peak. A sustained strength, however, might trigger a short-covering move and lift the Gold price to the $3,345-3,347 hurdle, representing the 38.2% Fibo. level. This is followed by the $3,360-3,365 static hurdle, which, if cleared decisively, would negate the near-term negative bias and set the stage for a move towards reclaiming the $3,400 mark.
US Dollar PRICE Today
The table below shows the percentage change of US Dollar (USD) against listed major currencies today. US Dollar was the strongest against the Euro.
| USD | EUR | GBP | JPY | CAD | AUD | NZD | CHF | |
|---|---|---|---|---|---|---|---|---|
| USD | 0.95% | 0.70% | 0.71% | 0.47% | -0.12% | 0.44% | 0.92% | |
| EUR | -0.95% | -0.11% | 0.28% | 0.02% | -0.42% | -0.02% | 0.45% | |
| GBP | -0.70% | 0.11% | 0.58% | 0.14% | -0.29% | 0.02% | 0.57% | |
| JPY | -0.71% | -0.28% | -0.58% | -0.20% | -1.39% | -1.07% | 0.02% | |
| CAD | -0.47% | -0.02% | -0.14% | 0.20% | -0.32% | -0.03% | 0.43% | |
| AUD | 0.12% | 0.42% | 0.29% | 1.39% | 0.32% | 0.31% | 0.85% | |
| NZD | -0.44% | 0.02% | -0.02% | 1.07% | 0.03% | -0.31% | 0.43% | |
| CHF | -0.92% | -0.45% | -0.57% | -0.02% | -0.43% | -0.85% | -0.43% |
The heat map shows percentage changes of major currencies against each other. The base currency is picked from the left column, while the quote currency is picked from the top row. For example, if you pick the US Dollar from the left column and move along the horizontal line to the Japanese Yen, the percentage change displayed in the box will represent USD (base)/JPY (quote).