
14:30 – Producer’s Inflation in US (May)
- PPI m/m: 1,1% (Expected: 0,7%; Previous: 1,1%)
- PPI y/y: 6,5 (Expected: 6,4%; Previous: 5,7%)
- Core PPI m/m: 0,4% (Expected: 0,5%; Previous: 0,7%)
- Core PPI y/y: 4,9% (Expected: 5,4%; Previous: 4,9%)
14:30 – Jobless Claims
- Intial Jobless Claims: 229k (Expected: 220k; Previous: 225k)
- Continuing Jobless Claims: 1,795k (Expected: 1,780k ; Previous: 1,771k)
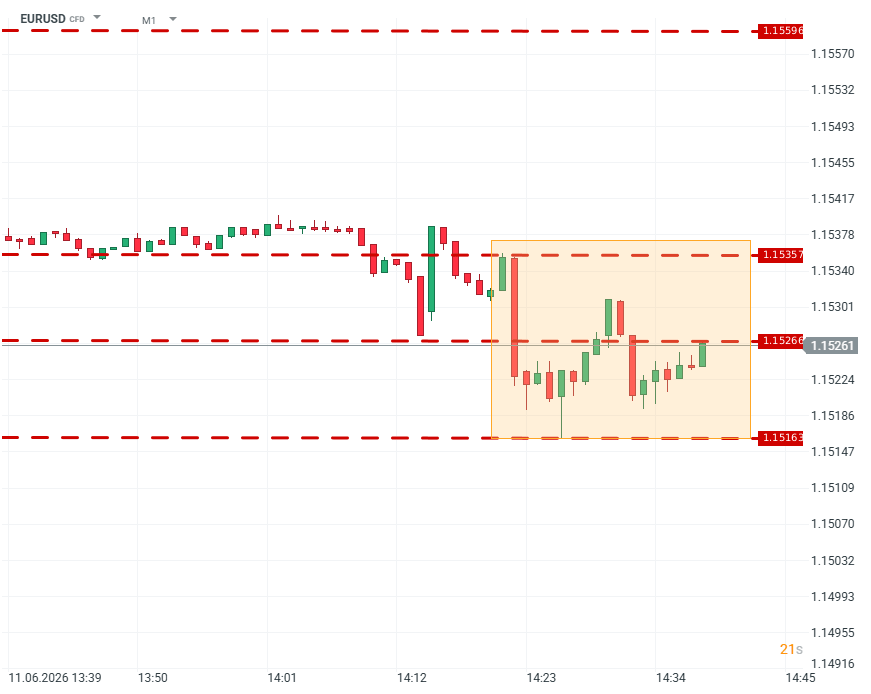
PPI data showed complicated price dynamics in the US. Both “basic” and “Core” PPI surprised market consensus, both in opposite directions. Core PPI showed substantial deceleration, noticeably below expectations – which might signal broad economy & customers weakness. On the other hand, PPI was above expectations, which might indicate that energy takes a larger-than-expected share of price acceleration. In the labor market, we could observe yet another growth, to the highest level since February. Although this would still be considered within the “average range for current market conditions. Continuous claims show that declines in the job market are slow – they are persistent; after improvement in long-term unemployment in May, the trend has been continuing an upside reversal. EURUSD (M1)
Source: xStation5