
Facts:
- The price is near the lower boundary of a consolidation range between 0.886 and 0.861.
- Upward corrections within the consolidation are breaking to increasingly lower levels, while at the same time testing resistance around 0.863.
- The EMA100 has crossed the EMA200 from above.
Recommendation:
Short position (Sell) on EURGBP at the market price.
- Target price (Take Profit; TP): 0.8400
- Stop Loss (SL): 0.8817
EURGBP (D1)
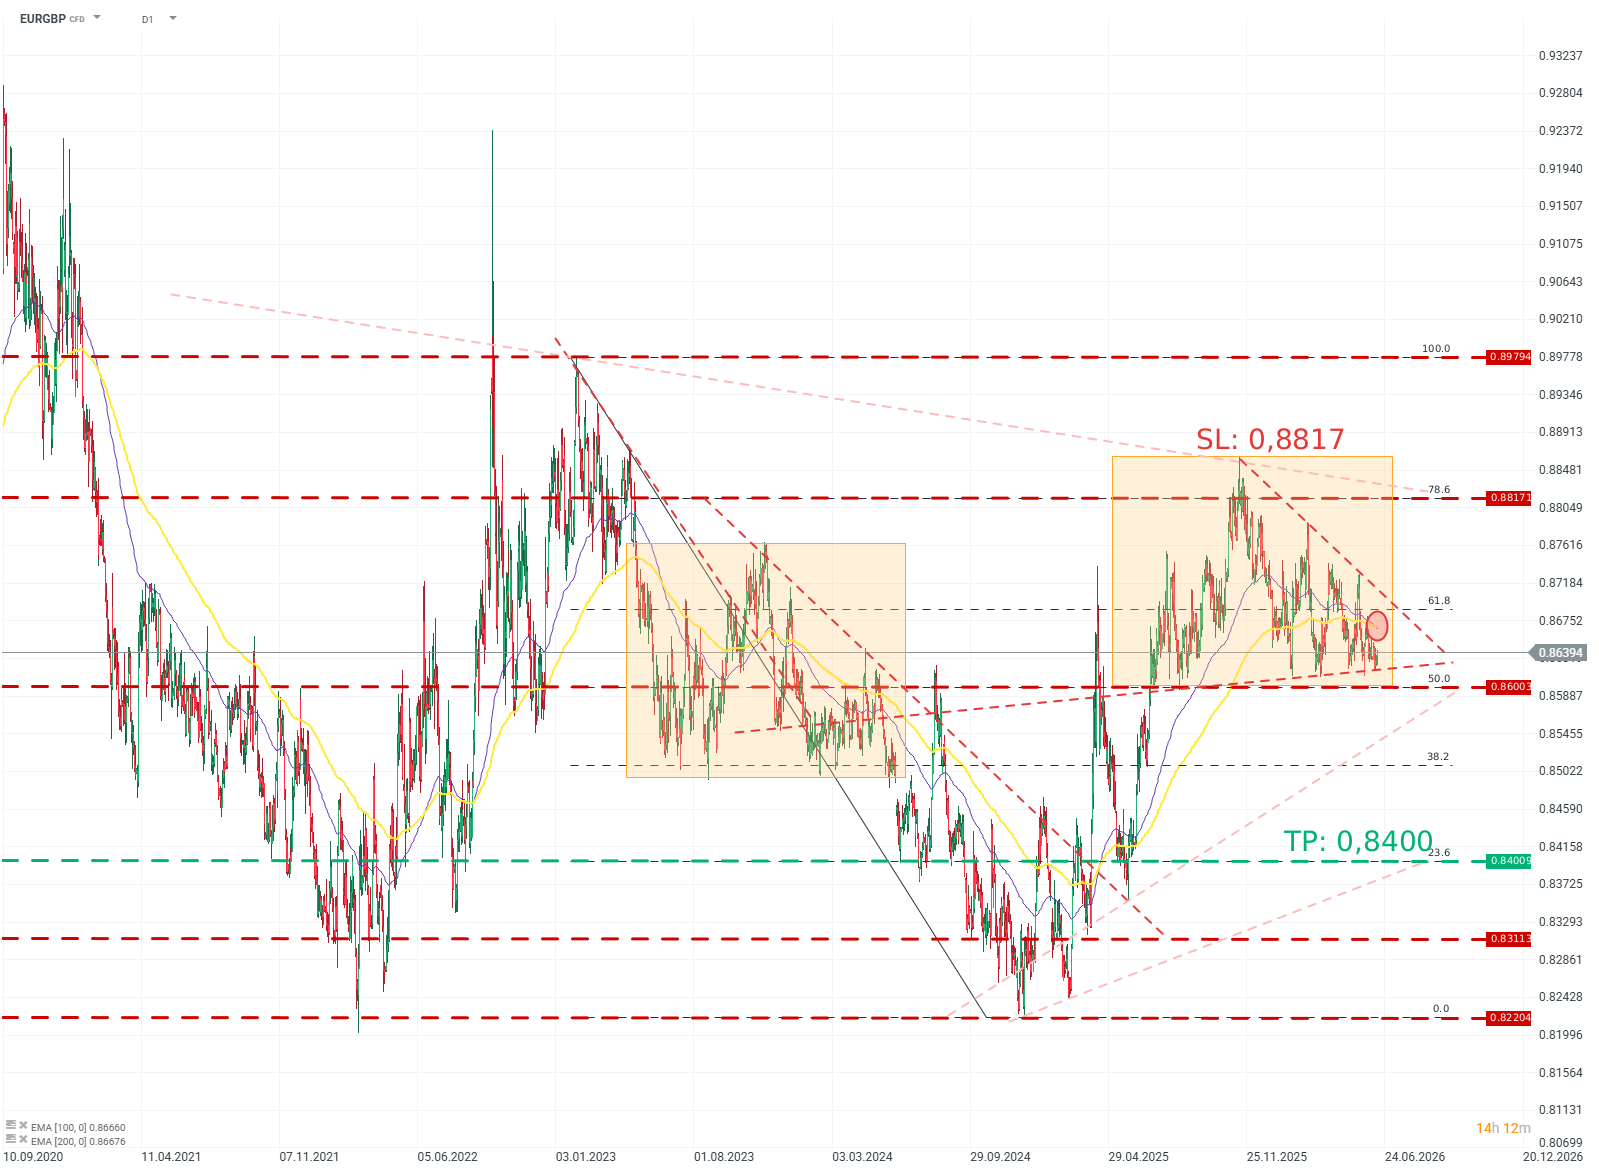
Source: xStation5
OPINION :
The EURGBP rate is once again testing the lower boundary of the consolidation, which can also be treated as a developing 1:1 pattern, potentially ending with a downside breakout. The repeated defense of the ~0.86 level indicates the strength of this zone; however, increasingly weaker upward corrections within the consolidation reveal buyer weakness and point to the likely direction of further price movement.
Methodology and assumptions:
- The recommendation is based on technical analysis of the chart, in particular EMA moving averages and Fibonacci levels.
- The target level was determined based on Fibonacci levels.
- The protective stop-loss order was set based on a favorable risk-to-reward ratio and with reference to a Fibonacci level.