
Facts:
- The MACD moving average is generating a bullish signal by crossing above the signal line from below.
- RSI (14) remains below 50.
- Price has defended the EMA200 moving average.
- The momentum of the moving averages remains bullish.
Trade idea : Long position on GOLD at market price
- Target: 4900
- Stop: 4300
GOLD (D1)
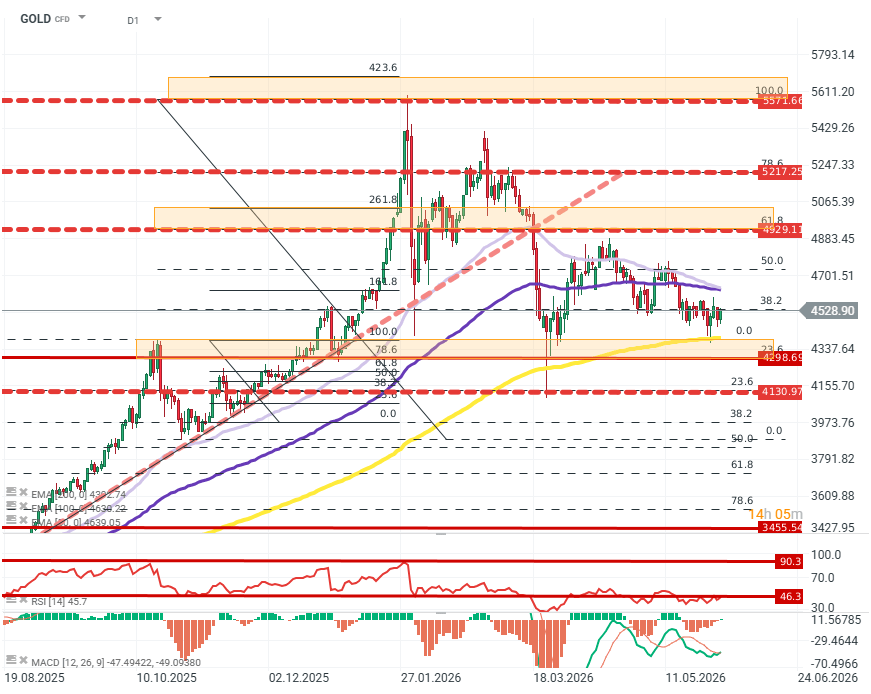
Source: xStation5
OPINION:
After the normalization of gold price movement dynamics compared to the period of elevated volatility (February–March), we can observe the commodity entering a consolidation channel between approximately USD 5000 and approximately USD 4200. Currently, the price remains closer to the lower boundary of this consolidation channel, which—considering both the geopolitical/economic context and a range of technical indicators – creates an opportunity for a breakout and a test of a higher level within the consolidation channel.
Methodology and assumptions adopted:
- The recommendation is based on technical analysis of the chart, in particular EMA moving averages, Fibonacci levels, and MACD.
- The target level was determined based on Fibonacci levels.
- The protective stop-loss order was set based on a favorable risk-to-reward ratio and based on a Fibonacci level.